
使用Prometheus+Grafana监控MySQL实践
一、介绍Prometheus
Prometheus(普罗米修斯)是一套开源的监控&报警&时间序列数据库的组合,起始是由SoundCloud公司开发的。随着发展,越来越多公司和组织接受采用Prometheus,社会也十分活跃,他们便将它独立成开源项目,并且有公司来运作。Google SRE的书内也曾提到跟他们BorgMon监控系统相似的实现是Prometheus。现在最常见的Kubernetes容器管理系统中,通常会搭配Prometheus进行监控。
Prometheus基本原理是通过HTTP协议周期性抓取被监控组件的状态,这样做的好处是任意组件只要提供HTTP接口就可以接入监控系统,不需要任何SDK或者其他的集成过程。这样做非常适合虚拟化环境比如VM或者Docker 。
Prometheus应该是为数不多的适合Docker、Mesos、Kubernetes环境的监控系统之一。
输出被监控组件信息的HTTP接口被叫做exporter 。目前互联网公司常用的组件大部分都有exporter可以直接使用,比如Varnish、Haproxy、Nginx、MySQL、Linux 系统信息 (包括磁盘、内存、CPU、网络等等),具体支持的源看:https://github.com/prometheus。
与其他监控系统相比,Prometheus的主要特点是:
- 一个多维数据模型(时间序列由指标名称定义和设置键/值尺寸)。
- 非常高效的存储,平均一个采样数据占~3.5bytes左右,320万的时间序列,每30秒采样,保持60天,消耗磁盘大概228G。
- 一种灵活的查询语言。
- 不依赖分布式存储,单个服务器节点。
- 时间集合通过HTTP上的PULL模型进行。
- 通过中间网关支持推送时间。
- 通过服务发现或静态配置发现目标。
- 多种模式的图形和仪表板支持。
二、Prometheus架构概览
该图说明了普罗米修斯(Prometheus)及其一些生态系统组件的整体架构:
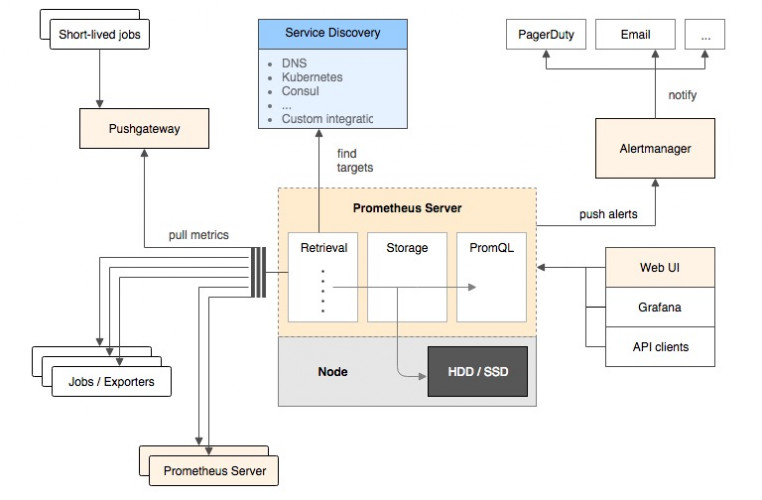
它的服务过程是这样的Prometheus daemon负责定时去目标上抓取metrics(指标) 数据,每个抓取目标需要暴露一个http服务的接口给它定时抓取。
Prometheus:支持通过配置文件、文本文件、zookeeper、Consul、DNS SRV lookup等方式指定抓取目标。支持很多方式的图表可视化,例如十分精美的Grafana,自带的Promdash,以及自身提供的模版引擎等等,还提供HTTP API的查询方式,自定义所需要的输出。
Alertmanager:是独立于Prometheus的一个组件,可以支持Prometheus的查询语句,提供十分灵活的报警方式。
PushGateway:这个组件是支持Client主动推送metrics到PushGateway,而Prometheus只是定时去Gateway上抓取数据。
如果有使用过statsd的用户,则会觉得这十分相似,只是statsd是直接发送给服务器端,而Prometheus主要还是靠进程主动去抓取。
大多数Prometheus组件都是用Go编写的,它们可以轻松地构建和部署为静态二进制文件。访问prometheus.io以获取完整的文档,示例和指南。
三、Prometheus的数据模型
Prometheus从根本上所有的存储都是按时间序列去实现的,相同的metrics(指标名称) 和label(一个或多个标签) 组成一条时间序列,不同的label表示不同的时间序列。为了支持一些查询,有时还会临时产生一些时间序列存储。
metrics name&label指标名称和标签
每条时间序列是由唯一的”指标名称”和一组”标签(key=value)”的形式组成。
指标名称:一般是给监测对像起一名字,例如http_requests_total这样,它有一些命名规则,可以包字母数字_之类的的。通常是以应用名称开头_监测对像_数值类型_单位这样。例如:push_total、userlogin_mysql_duration_seconds、app_memory_usage_bytes。
标签:就是对一条时间序列不同维度的识别了,例如一个http请求用的是POST还是GET,它的endpoint是什么,这时候就要用标签去标记了。最终形成的标识便是这样了:http_requests_total{method=”POST”,endpoint=”/api/tracks”}。
记住,针对http_requests_total这个metrics name无论是增加标签还是删除标签都会形成一条新的时间序列。
查询语句就可以跟据上面标签的组合来查询聚合结果了。
如果以传统数据库的理解来看这条语句,则可以考虑http_requests_total是表名,标签是字段,而timestamp是主键,还有一个float64字段是值了。(Prometheus里面所有值都是按float64存储)。
四、Prometheus四种数据类型
Counter
Counter用于累计值,例如记录请求次数、任务完成数、错误发生次数。一直增加,不会减少。重启进程后,会被重置。
例如:http_response_total{method=”GET”,endpoint=”/api/tracks”} 100,10秒后抓取http_response_total{method=”GET”,endpoint=”/api/tracks”} 100。
Gauge
Gauge常规数值,例如 温度变化、内存使用变化。可变大,可变小。重启进程后,会被重置。
例如: memory_usage_bytes{host=”master-01″} 100 < 抓取值、memory_usage_bytes{host=”master-01″} 30、memory_usage_bytes{host=”master-01″} 50、memory_usage_bytes{host=”master-01″} 80 < 抓取值。
Histogram
Histogram(直方图)可以理解为柱状图的意思,常用于跟踪事件发生的规模,例如:请求耗时、响应大小。它特别之处是可以对记录的内容进行分组,提供count和sum全部值的功能。
例如:{小于10=5次,小于20=1次,小于30=2次},count=7次,sum=7次的求和值。
Summary
Summary和Histogram十分相似,常用于跟踪事件发生的规模,例如:请求耗时、响应大小。同样提供 count 和 sum 全部值的功能。
例如:count=7次,sum=7次的值求值。
它提供一个quantiles的功能,可以按%比划分跟踪的结果。例如:quantile取值0.95,表示取采样值里面的95%数据。
五、安装运行Prometheus(二进制版)
下面介绍如何使用Prometheus和Grafana对MySQL服务器性能进行监控。
我们用到了以下两个exporter:
- node_exporter – 用于机器系统数据收集
- mysqld_exporter – 用于MySQL服务器数据收集
Grafana是一个开源的功能丰富的数据可视化平台,通常用于时序数据的可视化。它内置了以下数据源的支持:
下面是我们安装时用到的架构图:
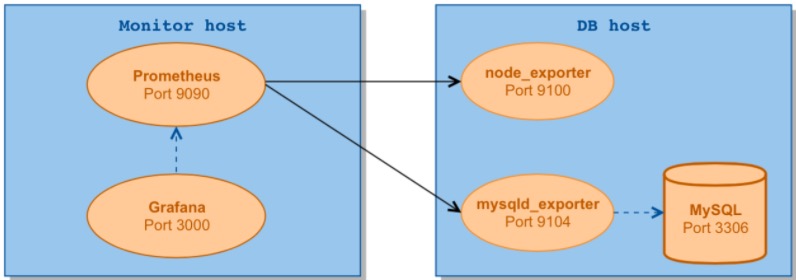
首先安装GO
$ yum install go $ go version go version go1.6.3 linux/amd64
|
1 2 3 |
$ yum install go $ go version go version go1.6.3 linux/amd64 |
下载安装Prometheus(https://prometheus.io/download/)
$ wget https://github.com/prometheus/prometheus/releases/download/v1.6.2/prometheus-1.6.2.linux-amd64.tar.gz $ tar xvf prometheus-1.6.2.linux-amd64.tar.gz -C /usr/local/ $ ln -sv /usr/local/prometheus-1.6.2.linux-amd64/ /usr/local/prometheus $ cd /usr/local/prometheus
|
1 2 3 4 |
$ wget https://github.com/prometheus/prometheus/releases/download/v1.6.2/prometheus-1.6.2.linux-amd64.tar.gz $ tar xvf prometheus-1.6.2.linux-amd64.tar.gz -C /usr/local/ $ ln -sv /usr/local/prometheus-1.6.2.linux-amd64/ /usr/local/prometheus $ cd /usr/local/prometheus |
首先,在创造上的主机文件系统的最小Prometheus配置文件prometheus.yml (替换你要监控的IP地址):
global: scrape_interval: 60s evaluation_interval: 60s scrape_configs: - job_name: prometheus static_configs: - targets: ['localhost:9090'] labels: instance: prometheus - job_name: linux static_configs: - targets: ['10.10.0.186:9100'] labels: instance: db1 - job_name: mysql static_configs: - targets: ['10.10.0.186:9104'] labels: instance: db1
|
1 2 3 4 5 6 7 8 9 10 11 12 13 14 15 16 17 18 19 20 21 22 |
global: scrape_interval: 60s evaluation_interval: 60s scrape_configs: - job_name: prometheus static_configs: - targets: ['localhost:9090'] labels: instance: prometheus - job_name: linux static_configs: - targets: ['10.10.0.186:9100'] labels: instance: db1 - job_name: mysql static_configs: - targets: ['10.10.0.186:9104'] labels: instance: db1 |
10.10.0.186是我们数据库主机的IP,端口则是对应的exporter的监听端口。
启动Prometheus
$ ./prometheus -config.file=prometheus.yml INFO[0000] Starting prometheus (version=1.6.2, branch=master, revision=b38e977fd8cc2a0d13f47e7f0e17b82d1a908a9a) source=main.go:88 INFO[0000] Build context (go=go1.8.1, user=root@c99d9d650cf4, date=20170511-12:59:13) source=main.go:89 INFO[0000] Loading configuration file prometheus.yml source=main.go:251 INFO[0000] Loading series map and head chunks... source=storage.go:421 INFO[0000] 1032 series loaded. source=storage.go:432 INFO[0000] Starting target manager... source=targetmanager.go:61 INFO[0000] Listening on :9090 source=web.go:259
|
1 2 3 4 5 6 7 8 |
$ ./prometheus -config.file=prometheus.yml INFO[0000] Starting prometheus (version=1.6.2, branch=master, revision=b38e977fd8cc2a0d13f47e7f0e17b82d1a908a9a) source=main.go:88 INFO[0000] Build context (go=go1.8.1, user=root@c99d9d650cf4, date=20170511-12:59:13) source=main.go:89 INFO[0000] Loading configuration file prometheus.yml source=main.go:251 INFO[0000] Loading series map and head chunks... source=storage.go:421 INFO[0000] 1032 series loaded. source=storage.go:432 INFO[0000] Starting target manager... source=targetmanager.go:61 INFO[0000] Listening on :9090 source=web.go:259 |
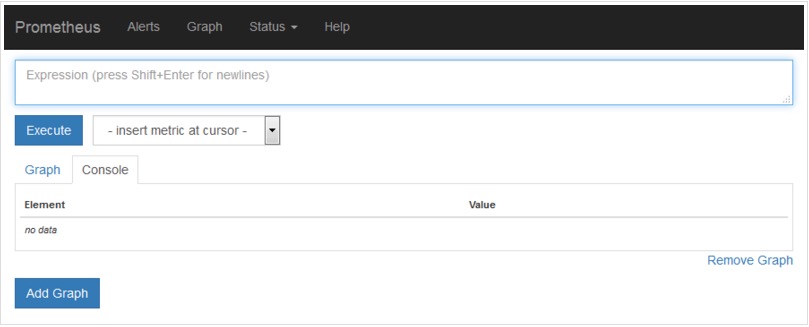
Prometheus内置了一个web界面,我们可通过http://monitor_host:9090进行访问:
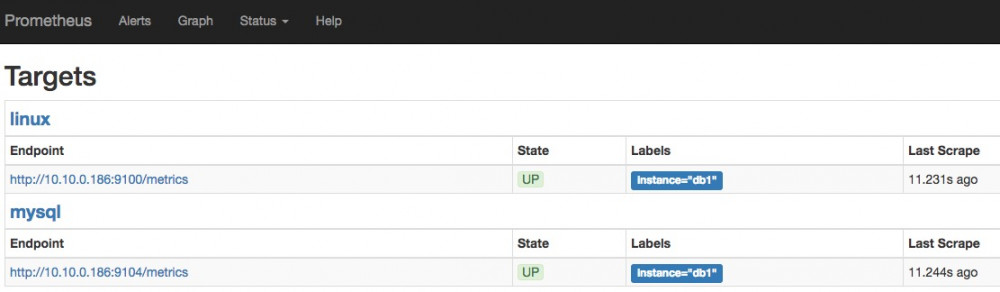
在Status->Targets页面下,我们可以看到我们配置的两个Target,它们的State为DOWN。
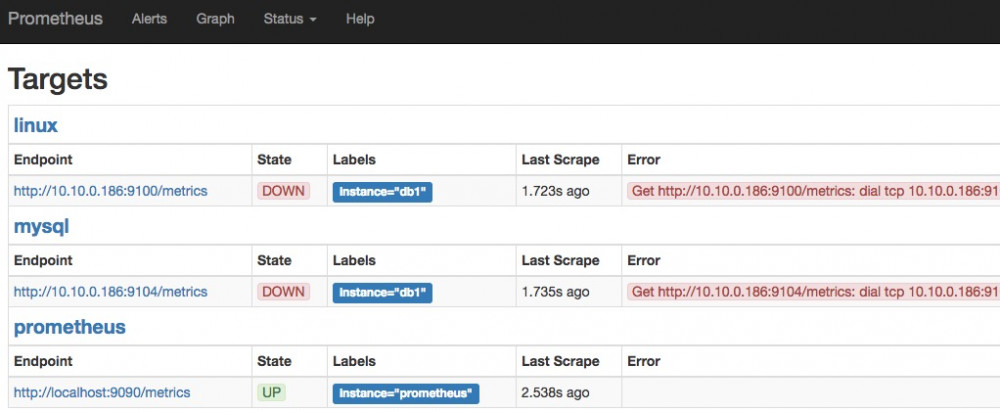
下一步我们需要安装并运行exporter,下载exporters并解压到被监控端服务器:
$ wget https://github.com/prometheus/node_exporter/releases/download/v0.14.0/node_exporter-0.14.0.linux-amd64.tar.gz $ wget https://github.com/prometheus/mysqld_exporter/releases/download/v0.10.0/mysqld_exporter-0.10.0.linux-amd64.tar.gz
|
1 2 |
$ wget https://github.com/prometheus/node_exporter/releases/download/v0.14.0/node_exporter-0.14.0.linux-amd64.tar.gz $ wget https://github.com/prometheus/mysqld_exporter/releases/download/v0.10.0/mysqld_exporter-0.10.0.linux-amd64.tar.gz |
被监控安装GO环境
$ yum install go -y $ go version go version go1.6.3 linux/amd64
|
1 2 3 |
$ yum install go -y $ go version go version go1.6.3 linux/amd64 |
安装运行node_exporter
$ tar xvf node_exporter-0.14.0.linux-amd64.tar.gz -C /usr/local/ $ nohup /usr/local/node_exporter-0.14.0.linux-amd64/node_exporter &
|
1 2 |
$ tar xvf node_exporter-0.14.0.linux-amd64.tar.gz -C /usr/local/ $ nohup /usr/local/node_exporter-0.14.0.linux-amd64/node_exporter & |
安装运行mysqld_exporter
mysqld_exporter需要连接到Mysql,所以需要Mysql的权限,我们先为它创建用户并赋予所需的权限.
mysql> GRANT REPLICATION CLIENT,PROCESS ON *.* TO 'mysql_monitor'@'localhost' identified by 'mysql_monitor'; mysql> GRANT SELECT ON *.* TO 'mysql_monitor'@'localhost';
|
1 2 |
mysql> GRANT REPLICATION CLIENT,PROCESS ON *.* TO 'mysql_monitor'@'localhost' identified by 'mysql_monitor'; mysql> GRANT SELECT ON *.* TO 'mysql_monitor'@'localhost'; |
创建.my.cnf文件并运行mysqld_exporter:
$ cat /usr/local/mysqld_exporter-0.10.0.linux-amd64/.my.cnf [client] user=mysql_monitor password=mysql_monitor
|
1 2 3 4 |
$ cat /usr/local/mysqld_exporter-0.10.0.linux-amd64/.my.cnf [client] user=mysql_monitor password=mysql_monitor |
$ tar xvf mysqld_exporter-0.10.0.linux-amd64.tar.gz -C /usr/local/ $ /usr/local/mysqld_exporter-0.10.0.linux-amd64/mysqld_exporter -config.my-cnf="/usr/local/mysqld_exporter-0.10.0.linux-amd64/.my.cnf" &
|
1 2 |
$ tar xvf mysqld_exporter-0.10.0.linux-amd64.tar.gz -C /usr/local/ $ /usr/local/mysqld_exporter-0.10.0.linux-amd64/mysqld_exporter -config.my-cnf="/usr/local/mysqld_exporter-0.10.0.linux-amd64/.my.cnf" & |
我们再次回到Status->Targets页面,可以看到两个Target的状态已经变成UP了:
接下来就可以看图形了
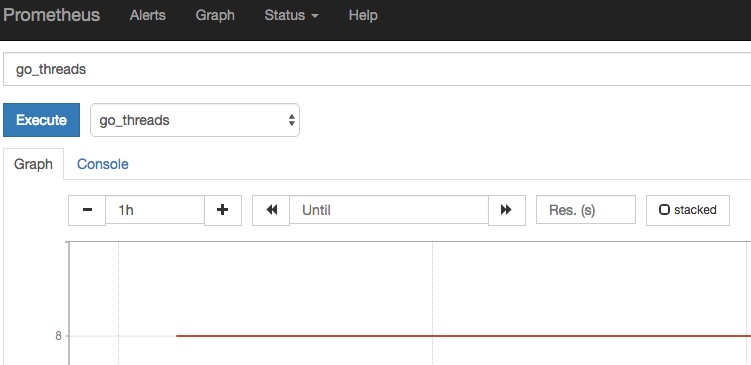
Prometheus自带的图形并不够强大,于是我们可以使用Grafana作为Prometheus的Dashboard。
六、安装运行Grafana
$ wget https://s3-us-west-2.amazonaws.com/grafana-releases/release/grafana-4.2.0-1.x86_64.rpm $ sudo yum localinstall grafana-4.2.0-1.x86_64.rpm
|
1 2 |
$ wget https://s3-us-west-2.amazonaws.com/grafana-releases/release/grafana-4.2.0-1.x86_64.rpm $ sudo yum localinstall grafana-4.2.0-1.x86_64.rpm |
编辑配置文件/etc/grafana/grafana.ini,修改dashboards.json段落下两个参数的值:
[dashboards.json] enabled = true path = /var/lib/grafana/dashboards
|
1 2 3 |
[dashboards.json] enabled = true path = /var/lib/grafana/dashboards |
安装仪表盘(Percona提供)
$ git clone https://github.com/percona/grafana-dashboards.git $ cp -r grafana-dashboards/dashboards /var/lib/grafana
|
1 2 |
$ git clone https://github.com/percona/grafana-dashboards.git $ cp -r grafana-dashboards/dashboards /var/lib/grafana |
运行以下命令为Grafana打个补丁,不然图表不能正常显示:
$ sed -i 's/expr=\(.\)\.replace(\(.\)\.expr,\(.\)\.scopedVars\(.*\)var \(.\)=\(.\)\.interval/expr=\1.replace(\2.expr,\3.scopedVars\4var \5=\1.replace(\6.interval, \3.scopedVars)/' /usr/share/grafana/public/app/plugins/datasource/prometheus/datasource.js $ sed -i 's/,range_input/.replace(\/"{\/g,"\\"").replace(\/}"\/g,"\\""),range_input/; s/step_input:""/step_input:this.target.step/' /usr/share/grafana/public/app/plugins/datasource/prometheus/query_ctrl.js
|
1 2 |
$ sed -i 's/expr=\(.\)\.replace(\(.\)\.expr,\(.\)\.scopedVars\(.*\)var \(.\)=\(.\)\.interval/expr=\1.replace(\2.expr,\3.scopedVars\4var \5=\1.replace(\6.interval, \3.scopedVars)/' /usr/share/grafana/public/app/plugins/datasource/prometheus/datasource.js $ sed -i 's/,range_input/.replace(\/"{\/g,"\\"").replace(\/}"\/g,"\\""),range_input/; s/step_input:""/step_input:this.target.step/' /usr/share/grafana/public/app/plugins/datasource/prometheus/query_ctrl.js |
最后我们运行Grafana服务
$ systemctl daemon-reload $ systemctl start grafana-server $ systemctl status grafana-server
|
1 2 3 |
$ systemctl daemon-reload $ systemctl start grafana-server $ systemctl status grafana-server |
我们可通过http://monitor_host:3000访问Grafana网页界面(缺省的帐号/密码为admin/admin):
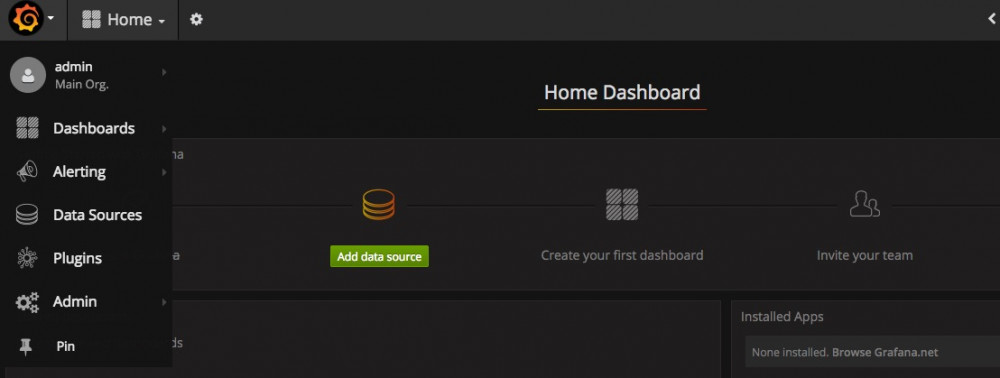
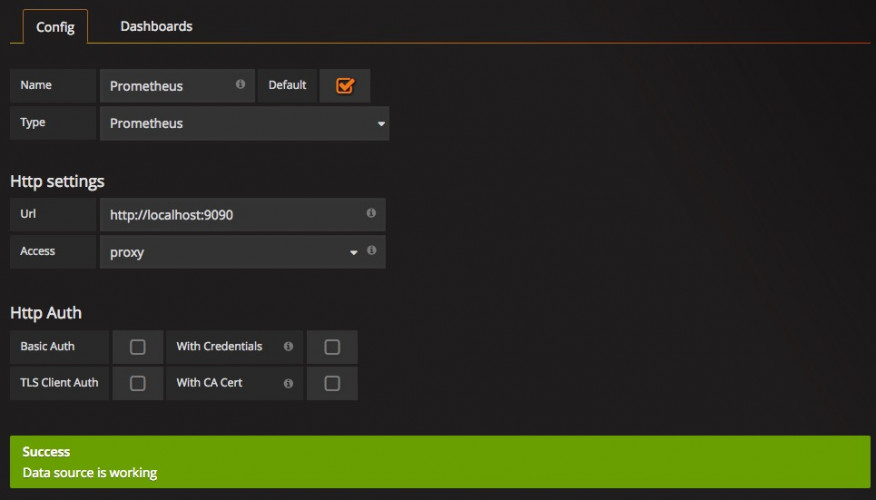
然后我们到Data Sources页面添加数据源:
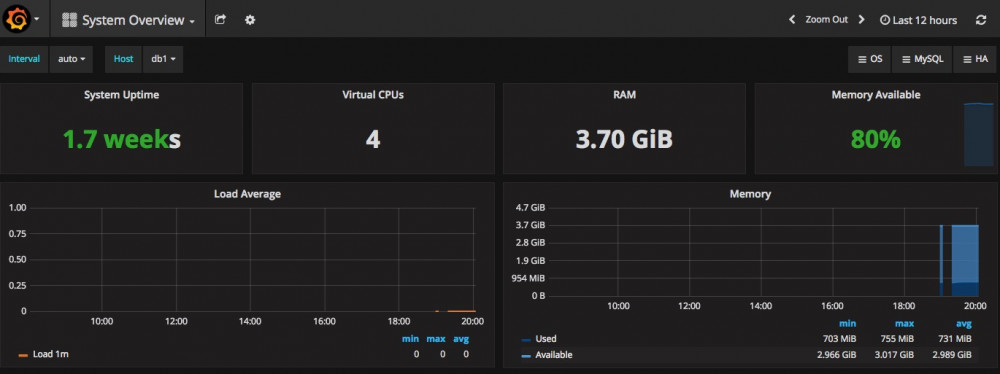
系统监控概览
MySQL监控概览
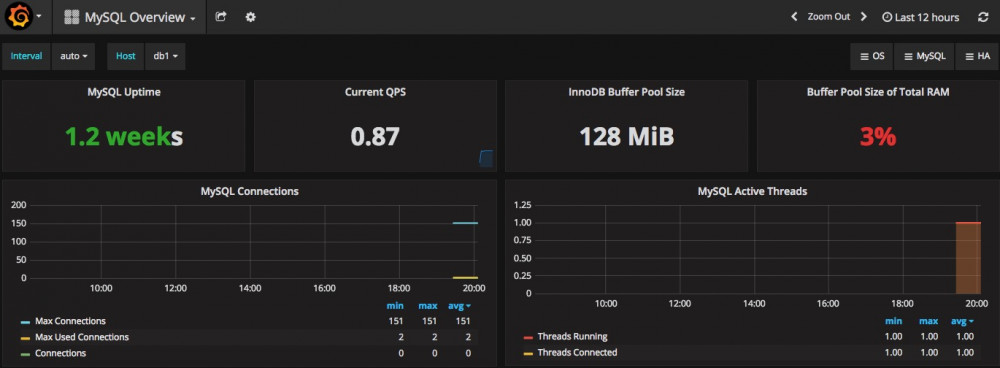
<参考资料>
https://github.com/percona/grafana-dashboards
https://www.percona.com/blog/…
如果只是想监控MySQL或MongoDB,那么请使用PMM(Percona Monitoring and Management)监控工具,在Prometheus+Granafa基础之上添加了慢查询收集等额外功能,更专业的MySQL&MongoDB监控系统。完结。。。
使用Prometheus+Grafana监控MySQL实践的更多相关文章
- prometheus+grafana监控mysql
prometheus+grafana监控mysql 1.安装配置MySQL官方的 Yum Repository(有mysql只需设置监控账号即可) [root@localhost ~]# wget - ...
- [转帖]安装prometheus+grafana监控mysql redis kubernetes等
安装prometheus+grafana监控mysql redis kubernetes等 https://www.cnblogs.com/sfnz/p/6566951.html plug 的模式进行 ...
- prometheus+grafana监控mysql最佳实践
导航 前言 环境准备 安装Docker 安装prometheus 安装mysqld_exporter prometheus采集数据 安装grafana grafana配置数据源 感谢您的阅读,预计阅读 ...
- 技术分享 | Prometheus+Grafana监控MySQL浅析
GreatSQL社区原创内容未经授权不得随意使用,转载请联系小编并注明来源. 简介 Prometheus 一套开源的监控&报警&时间序列数据库的组合,通常 Kubernetes 中都会 ...
- Prometheus+Grafana监控MySQL、Redis数据库
俗话说,没有监控的系统就是在裸奔,好的监控就是运维人员的第三只手,第三只眼.本文将使用prometheus及Grafana搭建一套监控系统来监控主机及数据库(MySQL.Redis). 1. 安装G ...
- Prometheus + Grafana 监控(mysql 和redis)
1.监控MySQL(mysqld-exporter) https://github.com/prometheus/mysqld_exporter/releases/download/v0.11.0/m ...
- Prometheus+Grafana监控部署实践
参考文档: Prometheus github:https://github.com/prometheus grafana github:https://github.com/grafana/graf ...
- 安装prometheus+grafana监控mysql redis kubernetes等
1.prometheus安装 wget https://github.com/prometheus/prometheus/releases/download/v1.5.2/prometheus-1.5 ...
- Prometheus Grafana监控全方位实践
这次就不用 docker 部署服务了,这样大家会更容易接受.欢迎阅读. 引言 Prometheus 是一个监控系统,也是一个时间序列数据库,用Go语言开发的,官方文档.通过从某些特定的目标如主机,My ...
随机推荐
- Hadoop是怎么分块Block的?
不多说,直接上干货! hadoop的分块有两部分. 第一部分就是数据的划分(即把File划分成Block),这个是物理上真真实实的进行了划分,数据文件上传到HDFS里的时候,需要划分成一块一块,每块的 ...
- R read.table 一个问题的解决
Warning message: In scan(file, what, nmax, sep, dec, quote, skip, nlines, na.strings, : EOF within q ...
- vuex状态管理2
在vuex的官网https://vuex.vuejs.org中,提到的核心概念一共有5个,分别是State.Getter.Mutation.Action和Module,在上一篇随笔中,我们主要用到其中 ...
- Linux环境下配置maven环境
1.下载安装包并解压 安装包直接去apache官网下载:https://maven.apache.org/download.cgi 将安装包放在自己指定的目录:/home/software/apach ...
- jQuery中的跨域问题
jQuery中的Ajax的跨域问题 jsonp跨域问题:回调函数中的字符串: cb或callback jsonpcallback:跟的是cb后面的函数,主要自己写: 数据中的函数fn(数据) 目前是这 ...
- Css学习(4)
文档流(标准流) 元素自上而下,自左而右,块元素独占一行,行内元素在一行上显示,碰到父集元素的边框换行. 浮动布局 float: left | right 特点: ★元素浮动之后不占据原来的 ...
- Mybatis 系列1-环境搭建
[Mybatis 系列10-结合源码解析mybatis 执行流程] [Mybatis 系列9-强大的动态sql 语句] [Mybatis 系列8-结合源码解析select.resultMap的用法] ...
- mysql数据库数据备份与恢复
备份数据: C:\Users\Administrator>mysqldump -uroot --password -v test01 test02 >e:\temp\\a3.sql Ent ...
- 数组.html
<script > var arr1 = [1, 2, 3, 4, 5, 6 ]; 赋值 var arr2 =Array(1,2,3,4,5,6); var arr3 = new Arra ...
- react 数据管理之state思想指南
react的数据管理库有不少,最常听到的可能是mobx redux altjs之类的,当然还有很多其他,可以自己搜索. 为什么需要数据管理库呢,因为react本身只是为了实现view的表现,而不是数据 ...