FSL - MELODIC
Source: http://fsl.fmrib.ox.ac.uk/fsl/fslwiki/MELODIC; https://fsl.fmrib.ox.ac.uk/fsl/fslwiki/MELODIC/FAQ#How_do_I_transform_the_MELODIC_results_from_a_low-resolution_space_to_a_higher-resolution_one.3F

Research Overview
MELODIC ( Multivariate Exploratory Linear Optimized Decomposition into Independent Components ) 3.0 uses Independent Component Analysis to decompose a single or multiple 4D data sets into different spatial and temporal components. For ICA group analysis, MELODIC uses either Tensorial Independent Component Analysis (TICA, where data is decomposed into spatial maps, time courses and subject/session modes) or a simpler temporal concatenation approach. MELODIC can pick out different activation and artefactual components without any explicit time series model being specified.
Melodic GUI
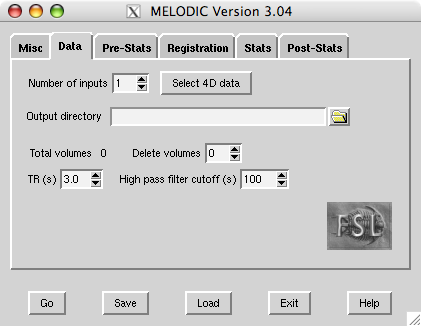
To call the MELODIC GUI, either type Melodic in a terminal (type Melodic_gui on Mac), or run fsl and press the MELODIC button.
Before calling the GUI, you need to prepare each session's data as a 4D NIFTI or Analyze format image; there are utilities in fsl/bin called fslmerge and fslsplit to convert between multiple 3D images and a single 4D (3D+time) image.
Structural images for use as "highres" images in registration should normally be brain-extracted using BET.
GUI details
Misc
Balloon help (the popup help messages in the MELODIC GUI) can be turned off once you are familiar with the GUI.
The Progress watcher button allows you to tell Melodic not to start a web browser to watch the analysis progress. If you are running lots of analyses you probably want to turn this off; you can view the same logging information by looking at the report_log.html or log.txt files in any MELODIC directories instead.
Data
First, set the filename of the 4D input image (e.g. /users/sibelius/origfunc.nii.gz) by pressing Select 4D data. You can select multiple files if you want MELODIC to perform a group analysis or if you want to run separate ICAs with the same setup. Results for each input file will be saved in separate .ica directories, the name of which is based on the input data's filename (unless you enter an Output directory name).
Delete volumes controls the number of initial FMRI volumes to delete before any further processing.
TR controls the time (in seconds) between scanning successive FMRI volumes. Changes here will not affect the analysis and only change the x-axis units of the final time series plots.
The High pass filter cutoff controls the longest temporal period that you will allow.
Pre-Stats
Low-frequency drifts and motion in the data can adversely affect the decomposition. In most cases, you would want to motion-correct the data, remove these drifts first or perform other types of typical data pre-processing before running the analysis. This can be done from within the Melodic GUI Pre-stats section.
Registration
Before any multi-session or multi-subject analyses can be carried out, the different sessions need to be registered to each other. This is made easy within MELODIC which performs registration on input data as part of an analysis using FEAT functionality. Unlike registration step in FEAT this here needs to be performed before the statistical analysis so that the filtered functional data is transformed into the standard space. For information on using multi-stage registration please consult the FEAT manual.
Standard space refers to the standard (reference) image; it should be an image already in standard space, ideally with the non-brain structures already removed.
Resampling resolution (mm) refers to the desired isotropic voxel dimension of the resampled data. In order to save on disk space and on required memory during the analysis it is advisable to resample the filtered data into standard space but keeping the resampled resolution at the FMRI resolution (typically 4mm or 5mm).
Note that any output image can be transformed to a higher resolution space later on - see FAQ
Stats
The Stats section lets you control some of the options for the decomposition. The default setting will most probably already be set to what you would want most of the time.
By default, MELODIC will variance-normalise timecourses.
By default, Melodic will automatically estimate the number of components from the data - you can switch this option off and then can specify the number of components explicitly.
You can now select the type of analysis. MELODIC currently offers three options:
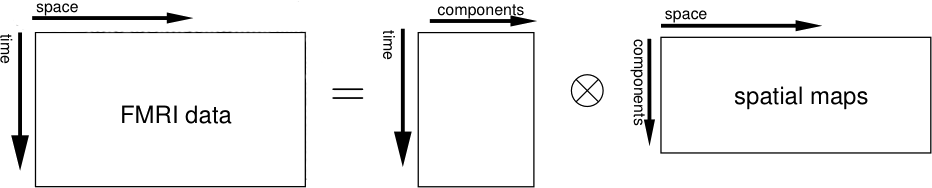
Single-session ICA: This will perform standard 2D ICA on each of the input files. The input data will each be represented as a 2D time x space matrix. MELODIC then de-composes each matrix separately into pairs of time courses and spatial maps. The original data is assumed to be the sum of outer products of time courses and spatial maps. All the different time courses (one per component) will be saved in the mixing matrix melodic_mix and all the spatial maps (one per component) will be saved in the 4D file melodic_IC.
When using separate analyses, MELODIC will attempt to find components which are relevant and non-Gaussian relative to the residual fixed-effects within session/subject variation. It is recommended to use this option in order to check for session-specific effects (such as MR artefacts). You will need to use this option if you want to perform MELODIC denoising using fsl_regfilt. When using single-session ICA the component are ordered in order of decreasing amounts of uniquely explained variance.
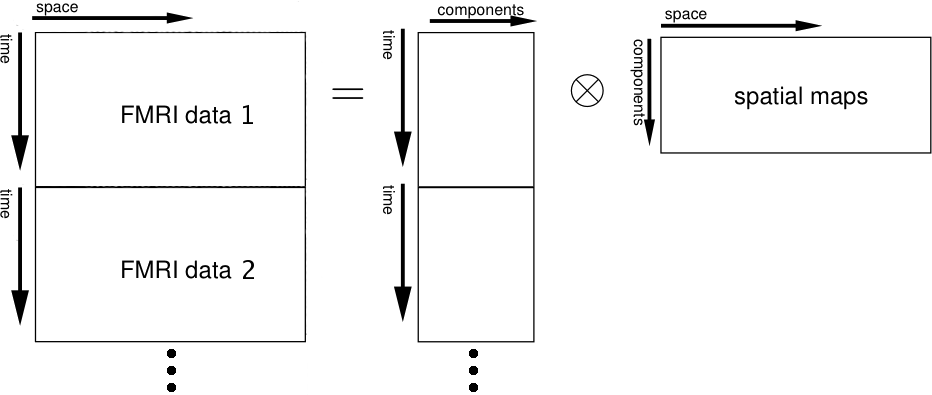
Multi-session temporal concatenation: This will perform a single 2D ICA run on the concatenated data matrix (obtained by stacking all 2D data matrices of every single data set on top of each other).
It is recommended to use this approach in cases where one is looking for common spatial patterns but can not assume that the associated temporal response is consistent between sessions/subjects. Examples include activation studies where the design was randomised between sessions or the analysis of data acquired without stimulation (resting-state FMRI).
This approach does not assume that the temporal response pattern is the same across the population, though the final web report will contain the first Eigenvector of all different temporal responses as a summary time course. Access to all time courses is available: the time series plot is linked to a text file (tXX.txt) which contains the first Eigenvector, the best model fit in case a time series design was specified and all different subject/session-specific time courses as columns. For each component the final mixing matrix melodic_mix contains the temporal response of all different data sets concatenated into a single column vector. The final reported time course will be the best rank-1 approximation to these different responses.
Multi-session Tensor-ICA: This will perform a 3D Tensor-ICA decomposition of the data. All individual data sets will be represented as a single time x space x sessions/subjects block of data. Tensor-ICA will decompose this block of data into triplets of time courses, spatial maps and session/subject modes, which - for each component - characterise the signal variation across the temporal, spatial and subject/session domain.
It is recommended to use this approach for data where the stimulus paradigm is consistent between session/subjects. Tensor-ICA assumes that the temporal response pattern is the same across the population and provides a single decomposition for all original data sets. MELODIC will attempt to find components which are highly non-Gaussian relative to the full mixed-effects variance of the residuals.
Estimated components typically fall into 2 classes: components which describe effects common to all or most subjects/sessions, and components which describe effects only contained in a small number of subjects/sessions. The former will have a non-zero estimated effect size while the latter will have an effect size around 0 for most subjects/sessions and only few high non-zero values. These different types of components can be identified easily by looking at the boxplots provided. When using Tensor-ICA the components are ordered in order of decreasing amount of median response amplitude. For details on the decomposition see the technical report http://www.fmrib.ox.ac.uk/analysis/techrep/.
Post-Stats
Melodic will also by default carry out inference on the estimated maps using a mixture model and an alternative hypothesis testing approach. A threshold level of 0.5 in the case of alternative hypothesis testing means that a voxel 'survives' thresholding as soon as the probability of being in the 'active' class (as modelled by the Gamma densities) exceeds the probability of being in the 'background' noise class. This threshold level assumes that you are placing an equal loss on false-positives and false-negatives. If, however, you consider e.g. false-positives as being twice as bad as false-negatives you should change this value to 0.66...
You can select the background image used for the generation of the spatial map overlay images.
If you select the Output full stats folder option, MELODIC will save thresholded maps and probability maps in a /stats subdirectory within its output folder.
You can specify a temporal design matrix (and in the case of a group analysis also, a session/subject design matrix) as well as corresponding contrast matrices. If these matrices are set in the GUI, MELODIC will perform a post-hoc regression analysis on estimated time courses and session/subject modes. This can be a helpful tool in order to identify whether or not a given component is task related. The matrices themselves can be created easily using the Glm GUI.
Bottom Row of Buttons
When you have finished setting up MELODIC, press Go to run the analysis. Once MELODIC is running, you can either Exit the GUI, or setup further analyses.
The Save and Load buttons enable you to save and load the complete MELODIC setup to and from file.
MELODIC report output
Melodic will then generate the results and your terminal window will tell you where to find the web report. Each IC_XX.html webpage shows one spatial map thresholded and rendered on top of a background image followed by the relevant time-course of the ICA decomposition and the power-spectrum of the time-course. If you click on the thresholded map, you can inspect the raw IC output together with probability maps and the Mixture Model fit.
In the case of TICA or simple time series concatenation the time course plotted is the rank-1 approximation to all the different time courses that correspond to the given spatial map within the population.
If a temporal design was specified in the Post-Stats section then the time series plot will also contain a plot of the total model fit. In addition, a simple GLM table will describe the fit in detail, providing information of the regression parameter estimates (PEs). Furthermore, MELODIC will perform a simple F-test on the estimated time course and the total model fit. For task-related components the model fit will explain large amounts of the variation contained in the estimated time couse. In addition, if a contrast matrix was specified, the table will also contain Z-statistics and p-values for all the contrasts. If a group analysis was carried out then the report page will also include information on the distribution of the effect size across the population. A simple plot and a boxplot show the relative effect size across the different sessions/subjects. If a design matrix was specified in the GUI setup then MELODIC will also include a GLM regression fit table.
melodic command-line program
Type melodic --help to get usage.
fsl_regfilt command-line program
Running MELODIC can be a useful tool for gaining insight into unexpected artefacts or activation in your data.
As well as being a good way to find structured noise (or unexpected activation) in your data, ICA can also be used to remove chosen components (normally obvious scanner-related or physiological artefacts) from your data in order, for example, in order to improve the FEAT results. In order to do this:
- Run MELODIC single-session ICA on a 4D image file
Open the MELODIC report (melodic_output_directory.ica/filtered_func_data.ica/report/00index.html) in a web browser and look through the components to identify those that you wish to remove; record the list of component numbers to remove.
- In a terminal, run the MELODIC denoising, using the commands:
cd melodic_output_directory.ica
fsl_regfilt -i filtered_func_data -o denoised_data -d filtered_func_data.ica/melodic_mix -f "2,5,9"
- where you should replace the comma-separated list of component numbers with the list that you previously recorded when viewing the MELODIC report.
The output file denoised_data.nii.gz then contains the filtered and denoised data set which can be used e.g. within FEAT. When running FEAT on this data make sure that the analysis is set to Stats + Post-stats as you do not want to run the other filtering steps (smoothing etc.) again on this data. Similarly, when running Group ICA on this data, you need to turn off all preprocessing, or use the command line (after transforming the data into a common space using, e.g. featregapply).
Using melodic for just doing mixture-modelling
The following explains how to apply melodic's mixture modelling to a statistic image, without actually running ICA. This can be useful when you have a statistic image that is nominally a z-statistic, but where there is a chance that it is not valid - for example if the null central part of the distribution does not have zero mean and unity standard deviation (e.g., because your data was temporally smooth, and that was not taken into account when you ran a GLM and created the z-statistic). The mixture-modelling will fit curves to the null and non-null parts of the image histogram, and force the null part of the adjusted statistic image to have zero mean and unity standard deviation.
First, create a dummy file whose contents are irrelevant - this is necessary in order to make melodic run without the full ICA estimation:
echo "1" > grot.txt
Then, feed your stats image myZstat into the mixture-modelling:
melodic -i myZstat --ICs=myZstat --mix=grot.txt -o myZstatMM --Oall --report -v --mmthresh=0
The corrected stats image will be named myZstatMM/stats/thresh_zstat1 - this will be corrected and not thresholded, the latter being because of the option --mmthresh=0 . If you wish to adjust the z-statistic and also apply mixture-model-based thresholding (in the same manner as melodic does in normal ICA usage), then set this to (e.g.) 0.5 to get an equal balance between false positives and false negatives.
FAQ
What is an Independent Component (IC) and how do I know what each one means?
Independent Component Analysis (ICA) attempts to split the 4D functional data into a set of spatial maps, each with an associated time course. This is a way of breaking up the original data set in a way which does not require the experimental paradigm to be specified and hopefully separates out signals of interest from other signals or artefacts. It is particularly useful when examining data where the timecourse of the response is uncertain. Ideally the result of running ICA will be a set of Independent Components (ICs), some of which are clearly related to activation while some are related to other physiological processes (e.g. respiration, resting-state signals, etc) or to imaging artefacts (e.g. motion, ghosting, slice dropout, noise, etc). An example of several different artefacts can be found in The Little FMRI Shop of Horror. An example of some simple activation-related signals can be found in the FSL Course Examples. There is no automatic way of determining which ICs are artefacts and which are not (since the process is model-free) and some knowledge of the experiment (and standard artefacts) is usually required to interpret the results.
Technically, ICA performs a linear decomposition of the original data, such that when all the Independent Components (ICs) are added together (each one being a 4D signal formed by the outer product of the spatial map and timecourse) they equal the original data. This is a similar concept to PCA but enforces independence between the components spatially while PCA enforces orthogonality both spatially and temporally. Note that in ICA for FMRI no relationship between the timecourses is imposed - they can be very similar. In addition, MELODIC uses a dimensionality estimation technique which separates out much of the noise before performing the ICA, thus reducing the number of purely noise-driven ICs in the output.
How do I use MELODIC to filter out unwanted components from my functional data?
To filter out unwanted components from the original data using MELODIC you will need (i) the name of the original data, (ii) the mixing matrix that defines the decomposition and (iii) a list of component numbers to remove. This is described more fully in an FSL Course Example. In brief, the required command is:
melodic -i inputdata -v -o outputname.ica --mix=inputdata.ica/melodic_mix -f "a,b,c,d,e,f,..."
where inputdata has previously been run through MELODIC, creating the output directory inputdata.ica and a,b,c etc. are the component numbers of the unwanted components found in this ouptut.
Note: You need those doublequotes so that the entire list of numbers is passed to melodic as the argument of the -f option!
How does MELODIC calculate the number of Independent Components (ICs)?
The number of components is calculated using Bayesian dimensionality estimation techniques, as detailed in the FMRIB technical report TR02CB1. Refer to this report for full details on this and other aspects of the probabilistic ICA method used in MELODIC. This dimensionality estimation is used by default in both the command line and GUI versions. It can be turned off and the number of components specified manually, although this is not recommended for FMRI data.
How do I transform the MELODIC results from a low-resolution standard space to a higher-resolution one?
Transforming an image between different resolution versions of standard space (e.g. 3mm to 2mm) should be done with flirt:
flirt -in image3mm -ref $FSLDIR/data/standard/MNI152_T1_2mm -applyxfm -usesqform -out image2mm
Note that in this case the flirt command line must be used (not applywarp) since the -usesqform flag aligns the images based on standard space coordinates, and not using a prior transformation matrix or warp. The input image can be at any resolution as long as it is in standard space (as created by MELODIC) and the reference image can be at a higher resolution (e.g. 1mm) if desired.
FSL - MELODIC的更多相关文章
- FSL - DualRegression
Source:http://fsl.fmrib.ox.ac.uk/fsl/fslwiki/DualRegression Research Overview A common need for anal ...
- fsl的feat软件分包使用笔记
introduction: 1. feat 是一种基于模型的fmri数据分析方法. 2. feat 首先使用顺手,至少看起来,比spm漂亮多了. feat是按照正常人的使用方法去设计的. spm 由于 ...
- Windows下利用虚拟机运行FSL 安装和配置
FSL是牛津大学FMRIB开发的用于分析功能磁共振影像的科研软件包. 运行要求:windows7或vista操作系统,10G硬盘空间,4G内存. 从FSL官网上下载Centos6的虚拟盘(FSLVm6 ...
- FSL安装
本文介绍如何安装医学图像处理软件fsl. 安装环境:Win8和Ubuntu 14.04 LTS(双系统和虚拟机皆可) 1. 安装ubuntu 14.04 LTS 2. 打开终端,设置ip代理:expo ...
- Ubuntu18.04环境下melodic安装gmapping
Ubuntu18.04 环境下melodic中很多包没有提供sudo apt install的安装方式,需要通过源代码安装,安装方法如下: 1.先安装依赖库: sudo apt--dev sudo a ...
- fmri 分析数据 fsl & spm 两大平台比对
基于下面这份ppt:Comparing SPM and FSL, by lChris Rorden fsl & spm都是免费的,都很受欢迎.spm更受欢迎. 两者的区别在于何时利用norma ...
- 性能优化-FSL(Force Synchronous Layout)强制同步布局
通过chrome的Perfermance工具记录程序性能,切换到帧模式,点开其中一帧,看详情,中间为紫色的区块代表Layout,右上角带有红色三角的为警告,是chrome告知的强制同步布局,即FSL. ...
- 在树莓派4b上安装 ROS MELODIC 源码安装
按照以下步骤照做就可以了,很简单的,就是浪费一点点时间罢了.也可以退而求其次,买个树莓派3B+来玩,哈哈. Step 1: Install Dependecies and Download the P ...
- 源码安装ROS Melodic Python3 指南 (转) + 安装记录
这篇文章转自 https://blog.csdn.net/id9502/article/details/80410989 csdn真是作大死,我保存这篇博客的时候还不需要花钱就能看,现在居然要v ...
随机推荐
- IOS开发——01_第一个OC程序
本文目录 一.新建Xcode项目 二.运行项目 注:建议先学习C语言, 如果你还没有编程经验,看不懂的地方可以在评论区提出,本文使用的为Xcode6.1版本,与之前版本会有所差异,但总体不变. 另:还 ...
- iOS中数据传值的几种方式
值传递:基本数据类型的变量之间的数据传递 //值传递不会改变变量的值 void func(int a) { a = ; } int main(int argc, const char * argv[] ...
- js去掉字符串前后空格的五种方法
转载 :http://www.2cto.com/kf/201204/125943.html 第一种:循环检查替换[javascript]//供使用者调用 function trim(s){ ret ...
- nodejs get/request
灌水评论示例: var http = require('http'); var querystring = require('querystring'); var postData = queryst ...
- 利用PHPMailer 来完成PHP的邮件发送
翻起之前的代码看了一下,还是发表到这里,以后容易查找. 以下的两个文件在这里下载 http://download.csdn.net/detail/u013085496/9673828 也可以直接上gi ...
- yii2 rbac权限控制之菜单menu详细教程
作者:白狼 出处:http://www.manks.top/article/yii2_rbac_menu本文版权归作者,欢迎转载,但未经作者同意必须保留此段声明,且在文章页面明显位置给出原文连接,否则 ...
- HashMap常用方法
当需要对元素进行计数时,HashMap非常有用,如下例子,统计一个字符串中每个字符出现的次数: package simplejava; import java.util.HashMap; import ...
- 安卓普通类通过classloader访问资源文件
Android studio不知道怎么设置,才可以在生成APK时把一些文件打包进去. 但是不管怎么样,放在res文件夹下的东西是一定得打包的.所以把一些资源文件放在res/raw这个文件夹里是科学的. ...
- ksvcreate: Process(m000) creation failed
一测试服务器数据库(Oracle Database 10g Release 10.2.0.5.0 - 64bit Production)突然访问不了,检查发现数据库处于挂起模式(hang mode), ...
- Python基本语法,python入门到精通[二]
在上一篇博客Windows搭建python开发环境,python入门到精通[一]我们已经在自己的windows电脑上搭建好了python的开发环境,这篇博客呢我就开始学习一下Python的基本语法.现 ...