
grafana展示的CPU利用率与实际不符的问题探究
问题描述
最近看了一个虚机的CPU使用情况,使用mpstat -P ALL命令查看系统的CPU情况(该系统只有一个CPU core),发现该CPU的%usr长期维持在70%左右,且%sys也长期维持在20%左右:
03:56:29 AM  CPU    %usr   %nice    %sys %iowait    %irq   %soft  %steal  %guest  %gnice   %idle

03:56:34 AM  all   67.11    0.00   24.83    0.00    0.00    8.05    0.00    0.00    0.00    0.00

03:56:34 AM    0   67.11    0.00   24.83    0.00    0.00    8.05    0.00    0.00    0.00    0.00
mpstat命令展示的CPU结果和top命令一致
但通过Grafana查看发现该机器的%usr和%sys均低于实际情况。如下图棕色曲线为usr,蓝色曲线为sys:
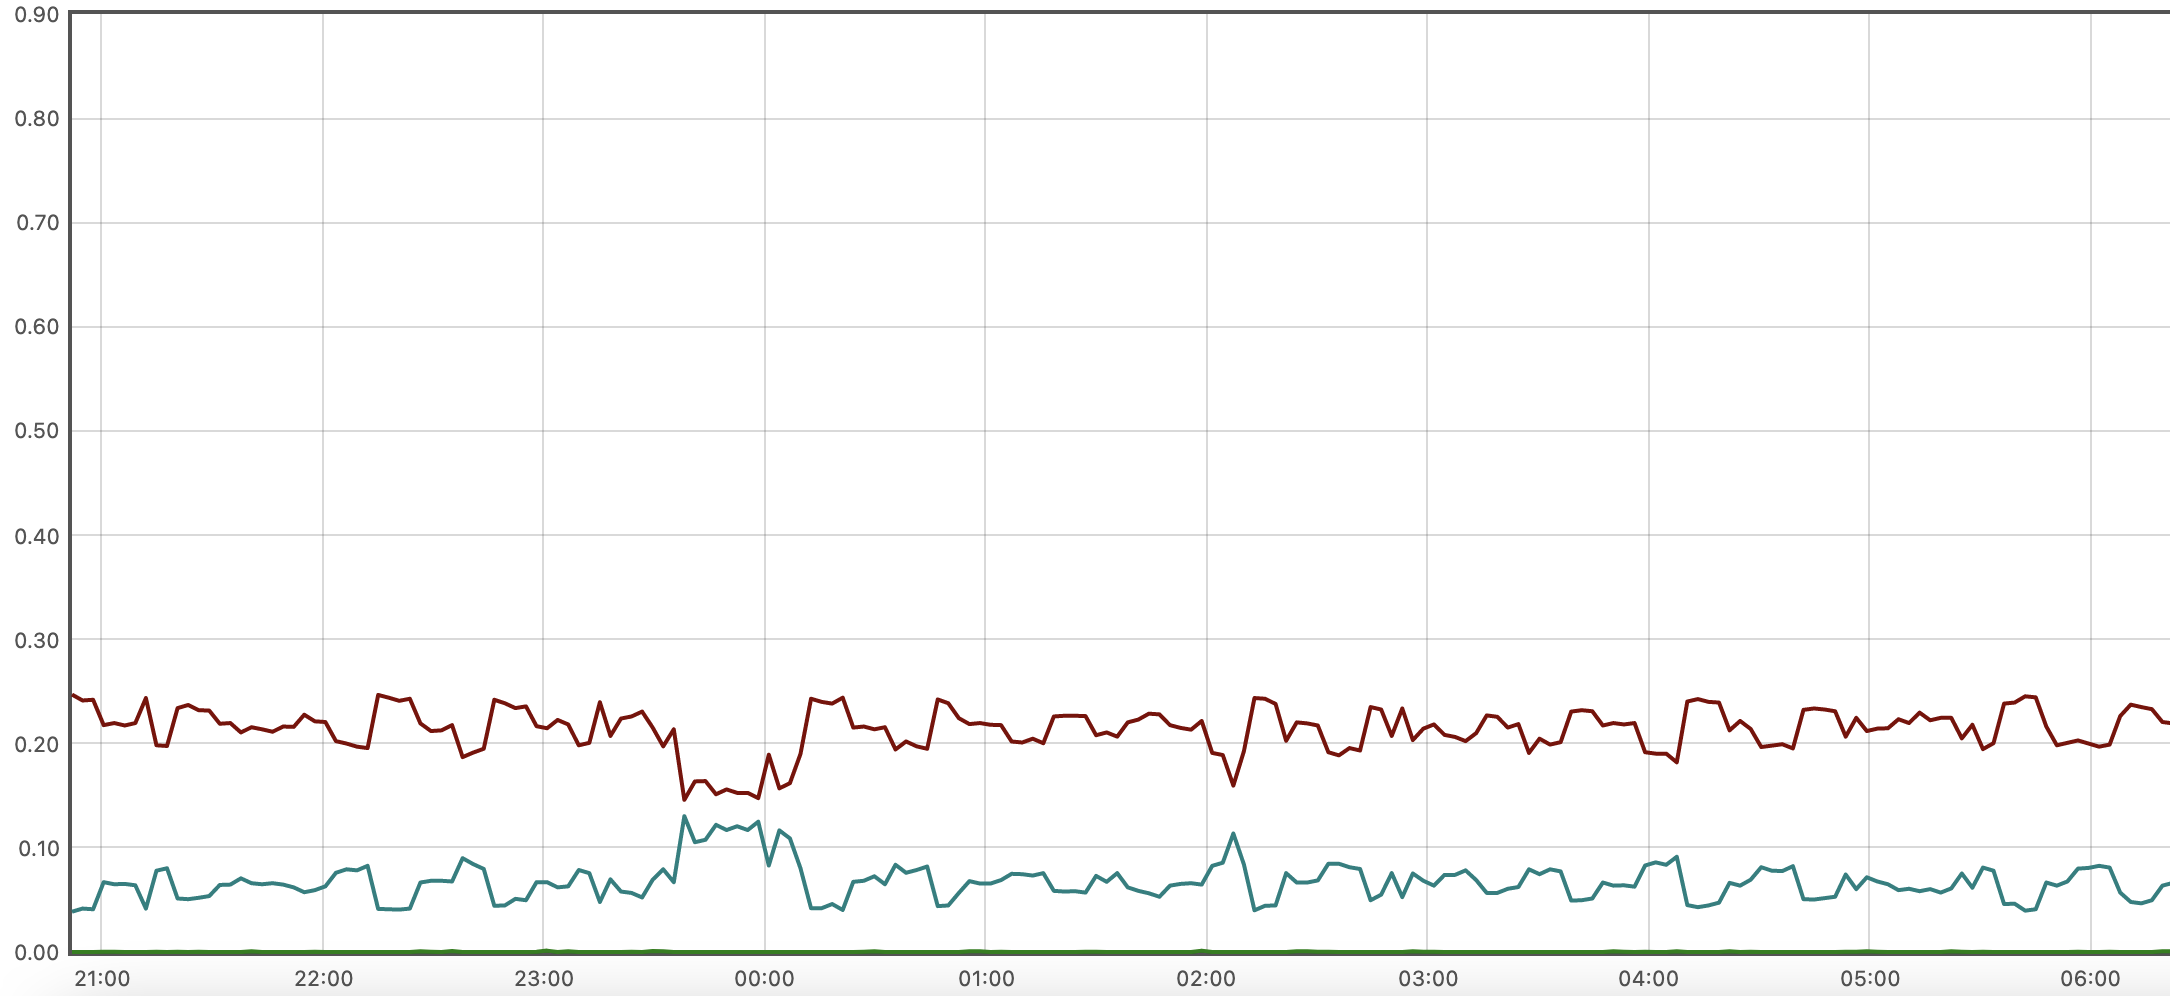
Grafana 的表达式如下:
avg by (mode, instance) (irate(node_cpu_seconds_total{instance=~"$instance", mode=~"user|system|iowait"}[$__rate_interval]))
问题解决
尝试解决
一开始怀疑是node-exporter版本问题,但查看node-exporter的release notes并没有相关bug,在切换为最新版本之后,问题也没有解决。
调研node-exporter运作方式
大部分与系统相关的prometheus指标都是直接从系统指标文件中读取并转换过来的。node-exporter中与CPU相关的指标就读取自/proc/stat,其中与CPU相关的内容就是下面的前两行,每行十列数据,分别表示User、Nice、System、Idle、Iowait、IRQ SoftIRQ、Steal、 Guest 、GuestNice
# cat /proc/stat

cpu  18651720 282843 9512262 493780943 10294540 0 2239778 0 0 0

cpu0 18651720 282843 9512262 493780943 10294540 0 2239778 0 0 0

intr 227141952 99160476 9 0 0 2772 0 0 0 0 0 0 0 157 0 0 0 0 0 0 0 0 0 0 0 0 0 0 0 0 0 0 0 0 0 0 0 0 0 0 0 0 0 0 0 0 0 0 0 0 0 0 0 0 0 0 0 0 0 0 0 0 0 0 0 0 0 0 0 0 0 0 0 0 0 0 0 0 0 0 0 0 0 0 0 0 0 0 0 0 0 0 0 0 0 0 0 0 0 0 0 0 0 0 0 0 0 0 0 0 0 0 0 0 0 0 0 0 0 0 0 0 0 0 0 0 0 0 0 0 0 0 0 0 0 0 0 0 0 0 0 0 0 0 0 0 0 0 0 0 0 0 0 0 0 0 0 0 0 0 0 0 0 0 0 0 0 0 0 0 0 0 0 0 0 0 0 0 0 0 0 0 0 0 0 0 0 0 0 0 0 0 0 0 0 0 0 0 0 0 0 0 0 0 0 0 0 0 0 0 0 0 0 0 0 0 0 0 0 0 0 0 0 0 0 0 0 0 0 0 0 0 0 0 0 0 0 0 0 0 0 0 0 0 0 0 0 0 0 0 0 0 0 0 0 0 0

ctxt 4027171429

btime 1671775036

processes 14260129

procs_running 5

procs_blocked 0

softirq 1727699538 0 816653671 1 233469155 45823320 0 52888978 0 0 578864413
node-exporter并没有做什么运算,它只是将这十列数据除以userHZ(100),打上mode标签之后转换为prometheus格式的指标:
node_cpu_seconds_total{cpu="0", instance="redis:9100", mode="user"} 244328.77
mpstat命令的计算方式
那mpstat是如何计算不同mode的CPU利用率呢?
在mpstat的源代码中可以看到,mode为User的计算方式如下,涉及三个参数:
scc: 当前采样到的CPU信息,对应/proc/stat中的CPU信息scp: 上一次采样到的CPU信息,对应/proc/stat中的CPU信息deltot_jiffies: 两次CPU采样之间的jiffies(下面介绍什么是jiffies)
ll_sp_value(scp->cpu_user - scp->cpu_guest,

				       scc->cpu_user - scc->cpu_guest, deltot_jiffies)
ll_sp_value函数的定义如下,它使用了宏定义SP_VALUE:
/*

 ***************************************************************************

 * Workaround for CPU counters read from /proc/stat: Dyn-tick kernels

 * have a race issue that can make those counters go backward.

 ***************************************************************************

 */

double ll_sp_value(unsigned long long value1, unsigned long long value2,

		   unsigned long long itv)

{

	if (value2 < value1)

		return (double) 0;

	else

		return SP_VALUE(value1, value2, itv);

}
SP_VALUE的定义如下:
/* With S_VALUE macro, the interval of time (@p) is given in 1/100th of a second */

#define S_VALUE(m,n,p)		(((double) ((n) - (m))) / (p) * 100)

/* Define SP_VALUE() to normalize to % */

#define SP_VALUE(m,n,p)		(((double) ((n) - (m))) / (p) * 100)

/*
根据SP_VALUE定义可以看到两次CPU采样获取到的mode为User的CPU占用率计算方式为:(((double) ((scp->cpu_user - scp->cpu_guest) - (scp->cpu_user - scp->cpu_guest))) / (deltot_jiffies) * 100)
下面函数用于计算deltot_jiffies,可以看到jiffies其实就是/proc/stat中的CPU数值单位:
/*

 ***************************************************************************

 * Since ticks may vary slightly from CPU to CPU, we'll want

 * to recalculate itv based on this CPU's tick count, rather

 * than that reported by the "cpu" line. Otherwise we

 * occasionally end up with slightly skewed figures, with

 * the skew being greater as the time interval grows shorter.

 *

 * IN:

 * @scc	Current sample statistics for current CPU.

 * @scp	Previous sample statistics for current CPU.

 *

 * RETURNS:

 * Interval of time based on current CPU, expressed in jiffies.

 *

 * USED BY:

 * sar, sadf, mpstat

 ***************************************************************************

 */

unsigned long long get_per_cpu_interval(struct stats_cpu *scc,

					struct stats_cpu *scp)

{

	unsigned long long ishift = 0LL;

	if ((scc->cpu_user - scc->cpu_guest) < (scp->cpu_user - scp->cpu_guest)) {

		/*

		 * Sometimes the nr of jiffies spent in guest mode given by the guest

		 * counter in /proc/stat is slightly higher than that included in

		 * the user counter. Update the interval value accordingly.

		 */

		ishift += (scp->cpu_user - scp->cpu_guest) -

		          (scc->cpu_user - scc->cpu_guest);

	}

	if ((scc->cpu_nice - scc->cpu_guest_nice) < (scp->cpu_nice - scp->cpu_guest_nice)) {

		/*

		 * Idem for nr of jiffies spent in guest_nice mode.

		 */

		ishift += (scp->cpu_nice - scp->cpu_guest_nice) -

		          (scc->cpu_nice - scc->cpu_guest_nice);

	}

	/*

	 * Workaround for CPU coming back online: With recent kernels

	 * some fields (user, nice, system) restart from their previous value,

	 * whereas others (idle, iowait) restart from zero.

	 * For the latter we need to set their previous value to zero to

	 * avoid getting an interval value < 0.

	 * (I don't know how the other fields like hardirq, steal... behave).

	 * Don't assume the CPU has come back from offline state if previous

	 * value was greater than ULLONG_MAX - 0x7ffff (the counter probably

	 * overflew).

	 */

	if ((scc->cpu_iowait < scp->cpu_iowait) && (scp->cpu_iowait < (ULLONG_MAX - 0x7ffff))) {

		/*

		 * The iowait value reported by the kernel can also decrement as

		 * a result of inaccurate iowait tracking. Waiting on IO can be

		 * first accounted as iowait but then instead as idle.

		 * Therefore if the idle value during the same period did not

		 * decrease then consider this is a problem with the iowait

		 * reporting and correct the previous value according to the new

		 * reading. Otherwise, treat this as CPU coming back online.

		 */

		if ((scc->cpu_idle > scp->cpu_idle) || (scp->cpu_idle >= (ULLONG_MAX - 0x7ffff))) {

			scp->cpu_iowait = scc->cpu_iowait;

		}

		else {

			scp->cpu_iowait = 0;

		}

	}

	if ((scc->cpu_idle < scp->cpu_idle) && (scp->cpu_idle < (ULLONG_MAX - 0x7ffff))) {

		scp->cpu_idle = 0;

	}

	/*

	 * Don't take cpu_guest and cpu_guest_nice into account

	 * because cpu_user and cpu_nice already include them.

	 */

	return ((scc->cpu_user    + scc->cpu_nice   +

		 scc->cpu_sys     + scc->cpu_iowait +

		 scc->cpu_idle    + scc->cpu_steal  +

		 scc->cpu_hardirq + scc->cpu_softirq) -

		(scp->cpu_user    + scp->cpu_nice   +

		 scp->cpu_sys     + scp->cpu_iowait +

		 scp->cpu_idle    + scp->cpu_steal  +

		 scp->cpu_hardirq + scp->cpu_softirq) +

		 ishift);

}
从上面计算方式可以看到,deltot_jiffies近似可以认为是两次CPU采样的所有mode总和之差,以下表为例:
      User     Nice   System   Idle     Iowait  IRQ SoftIRQ  Steal Guest GuestNice

cpu  18424040 281581 9443941 493688502 10284789 0    2221013   0     0       0 # 第一次采样,作为scp

cpu  18424137 281581 9443954 493688502 10284789 0    2221020   0     0       0 # 第二次采样,作为scc
deltot_jiffies的计算方式为:
(18424137+281581+9443954+493688502+10284789) - (18424040+281581+9443941+493688502+2221013) + 0 = 117
那么根据采样到的数据,可以得出当前虚拟上的mode为User的CPU占用率为:(((double) ((18424137 - 0) - (18424040 - 0))) / (117) * 100)=82.9%,与预期相符。
再回头看下出问题的Grafana表达式,可以看出其计算的是mode为User的CPU的变动趋势,而不是CPU占用率,按照mpstat的计算方式,该mode的占用率的近似计算方式如下:
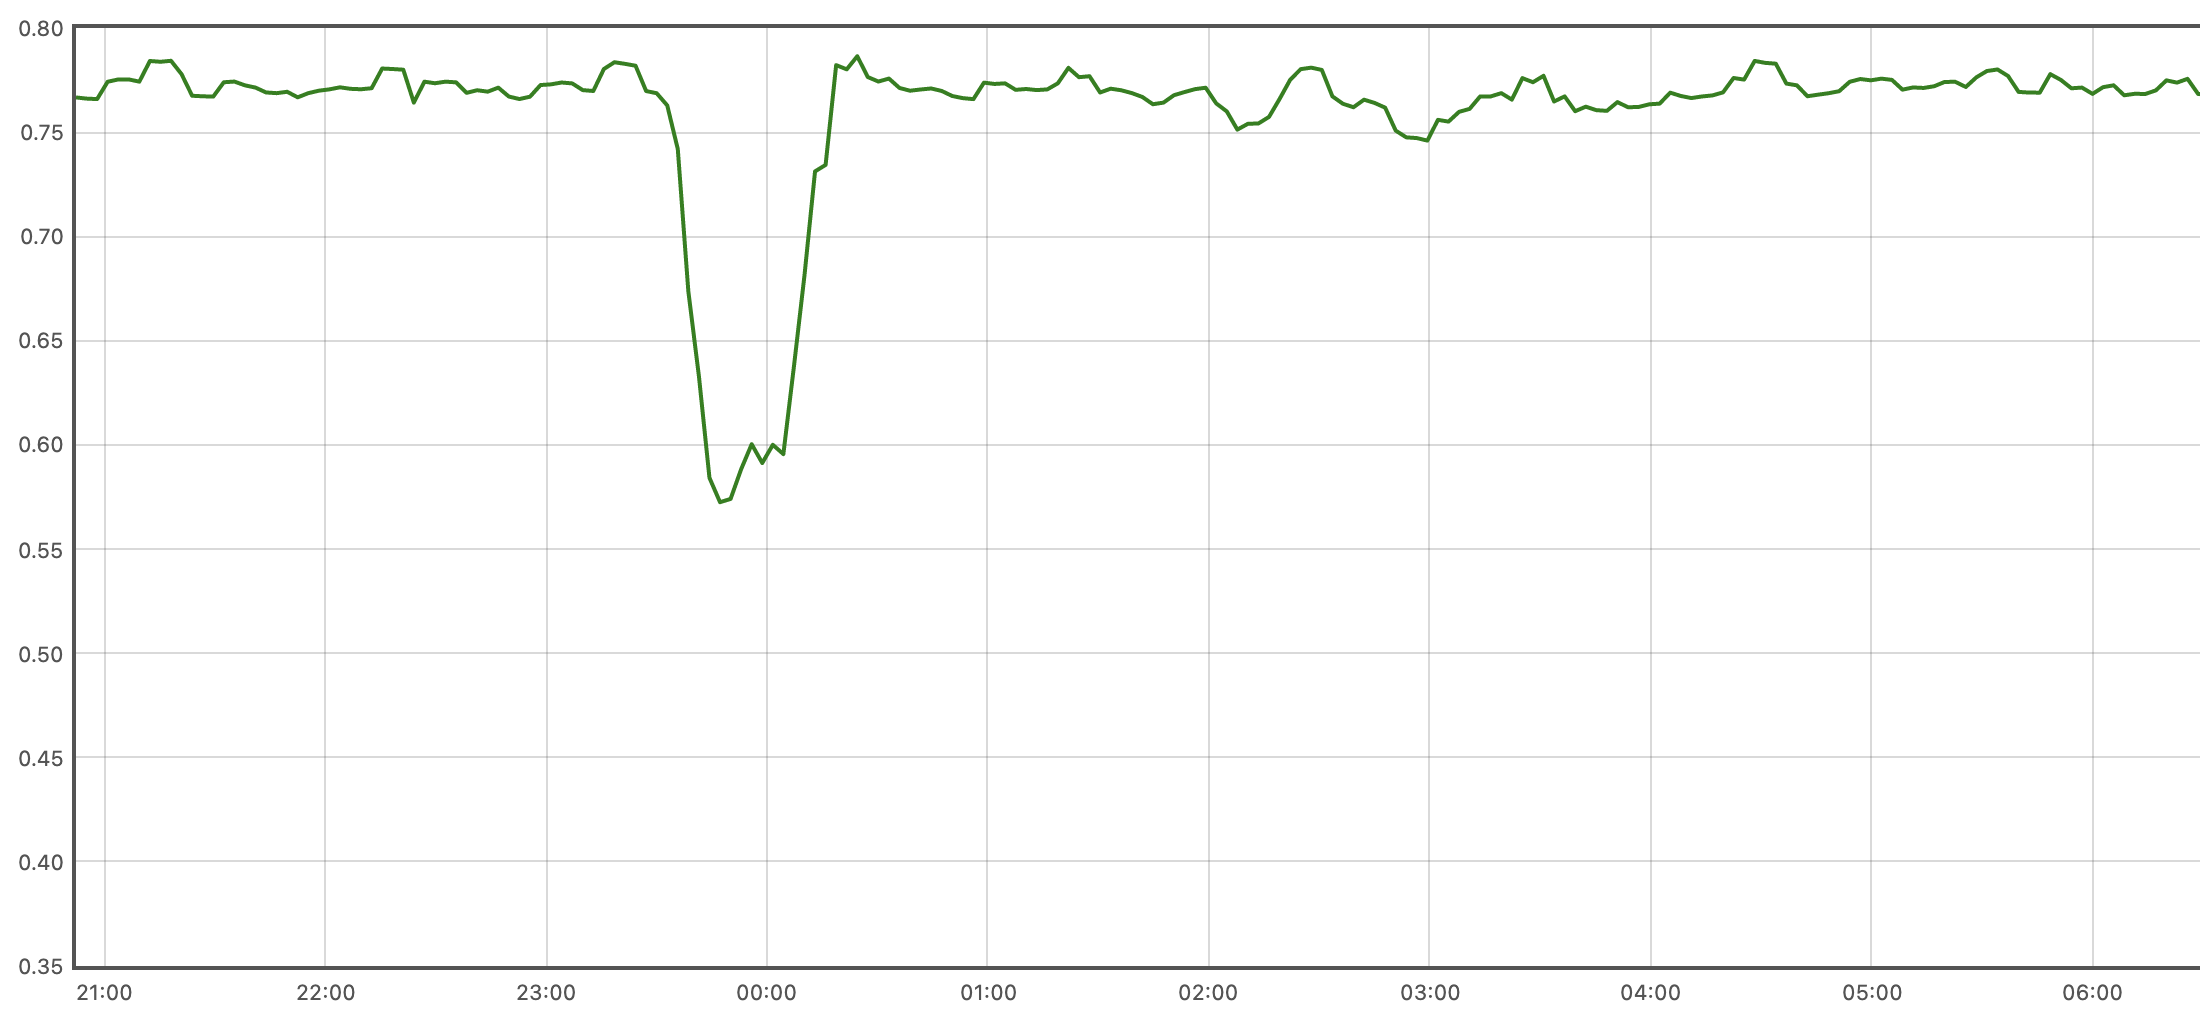
increase(node_cpu_seconds_total{mode="user", instance="drg1-prd-dragon-redis-sentinel-data-1:9100"}[10m])/on (cpu,instance)(increase(node_cpu_seconds_total{mode="user", instance="drg1-prd-dragon-redis-sentinel-data-1:9100"}[10m])+ on (cpu,instance) increase(node_cpu_seconds_total{mode="system", instance="drg1-prd-dragon-redis-sentinel-data-1:9100"}[10m]))
得出的mode为User的CPU占用率曲线图如下,与mpstat展示结果相同:
如果有必要的话,可以创建新的指标,用于准确表达CPU占用率。
grafana展示的CPU利用率与实际不符的问题探究的更多相关文章
- linux系统性能监控--CPU利用率
在对系统的方法化分析中,首要且最基本的工具之一常常是对系统的 CPU利用率进行简单测量. Linux以及大多数基于 UNIX的操作系统都提供了一条命令来显示系统的平均负荷(loadaverage) . ...
- [转帖]震惊,用了这么多年的 CPU 利用率,其实是错的
震惊,用了这么多年的 CPU 利用率,其实是错的 2018年12月22日 08:43:09 Linuxer_ 阅读数:50 https://blog.csdn.net/juS3Ve/article/d ...
- CPU 利用率背后的真相,只有 1% 人知道【转】
导读:本文翻译自 Brendan Gregg 去年的一篇博客文章 “CPU Utilization is Wrong”,从标题就能想到这篇文章将会引起争议.文章一上来就说,我们“人人皆用.处处使用,每 ...
- Prometheus笔记(二)监控go项目实时给grafana展示
欢迎加入go语言学习交流群 636728449 Prometheus笔记(二)监控go项目实时给grafana展示 Prometheus笔记(一)metric type 文章目录 一.promethe ...
- 震惊,用了这么多年的 CPU 利用率,其实是错的
导读:本文翻译自 Brendan Gregg 去年的一片博客文章 "CPU Utilization is Wrong",从标题就能想到这篇文章将会引起争议.文章一上来就说,我们&q ...
- 系统服务监控指标--load、CPU利用率、磁盘剩余空间、磁盘I/O、内存使用情况等
介绍 大型互联网企业的背后,依靠的是成千上万台服务器日夜不停的运转,以支撑其业务的运转.宕机对于互联网企业来说,代价是沉重的,轻则影响用户体验,重则直接影响交易,导致交易下跌,并且给企业声誉造成不可挽 ...
- CPU利用率异常的分析思路和方法交流探讨
CPU利用率异常的分析思路和方法交流探讨在生产运行当中,经常会遇到CPU利用率异常或者不符合预期的情况,此时,往往暗示着系统性能问题.那么究竟是核心应用的问题?是监控工具的问题?还是系统.硬件.网络层 ...
- python多进程提高cpu利用率
cpu参数: 1个物理cpu,2个逻辑cpu(超线程),单核 具体 http://blog.csdn.net/dba_waterbin/article/details/8644626 物理CPU. ...
- cpu利用率和cpu 队列
SIP的第四期结束了,因为控制策略的丰富,早先的的压力测试结果已经无法反映在高并发和高压力下SIP的运行状况,因此需要重新作压力测试.跟在测试人员后面做了快一周的压力测试,压力测试的报告也正式出炉,本 ...
- 查看进程,按内存从大到小 ,查看进程,按CPU利用率从大到小排序
查看进程,按内存从大到小 ps -e -o "%C : %p : %z : %a"|sort -k5 -nr 查看进程,按CPU利用率从大到小排序 ps -e -o "% ...
随机推荐
- <七>理解多态
理解多态 多种多样的形态(静态多态,动态多态) 静态多态(编译时期) 1:函数重载 bool comparet(int ,int); bool compare(double,double); comp ...
- 多表查询、Navicat软件、PyMySQL模块
目录 多表查询.Navicat软件.PyMySQL模块 一.多表查询的两种方法 1.准备工作 2.第一种:连表操作 3.第二种:子查询 总结与结论: 二.多表查询练习题 1.课堂多表查询练习题 2.以 ...
- vulnhub靶场之HACK ME PLEASE
准备: 攻击机:虚拟机kali.本机win10. 靶机:HACK ME PLEASE,下载地址:https://download.vulnhub.com/hackmeplease/Hack_Me_Pl ...
- 有来实验室|第一篇:Seata1.5.2版本部署和开源全栈商城订单支付业务实战
在线体验:Seata实验室 一. 前言 相信 youlai-mall 的实验室大家有曾在项目中见到过,但应该都还处于陌生的阶段,毕竟在此之前实验室多是以概念般的形式存在,所以我想借着此次的机会,对其进 ...
- go-carbon 1.5.0 版本发布,修复已知 bug 和新增德语翻译文件
carbon 是一个轻量级.语义化.对开发者友好的golang时间处理库,支持链式调用. 目前已被 awesome-go 收录,如果您觉得不错,请给个star吧 github:github.com/g ...
- base64解析爬取糗百
一.缘由 这是我之前刚开始学习的时候爬取糗百的练习内容,主要练习的是bs64解析.虽然现在用的不是特别的多,但是当初的时候用起来还是非常的顺手的. 二.代码实现 #coding:utf-8 impor ...
- Java中将 int[] 数组 转换为 List(ArrayList)
前言 说起数组转换成 ArrayList,很多同学第一反应就是遍历数组,将元素逐个添加到 ArrayList 中,但是这个看着就lower,一般不会这么答. 所以马上就会想到Arrays工具类的 as ...
- AStar寻路算法示例
概述 AStar算法是一种图形搜索算法,常用于寻路.他是以广度优先搜索为基础,集Dijkstra算法和最佳优先(best fit)于一身的一种算法. 示例1:4向 示例2:8向 思路 递归的通过估值函 ...
- c++中编码protobuf repeated string
参考:http://www.cppblog.com/API/archive/2014/12/09/209070.aspx proto文件 addressbook.proto syntax = &quo ...
- wsl2 kali修改语言
直接执行sudo dpkg-reconfigure locales 会提示 dpkg-query: package 'locales' is not installed and no informat ...