C#上位机中ZedGraph控件的使用
上位机程序控制PLC模拟量通道输出周期性正弦波信号,并采集所造成改变的模拟量输入信号,并绘制数据变化曲线。
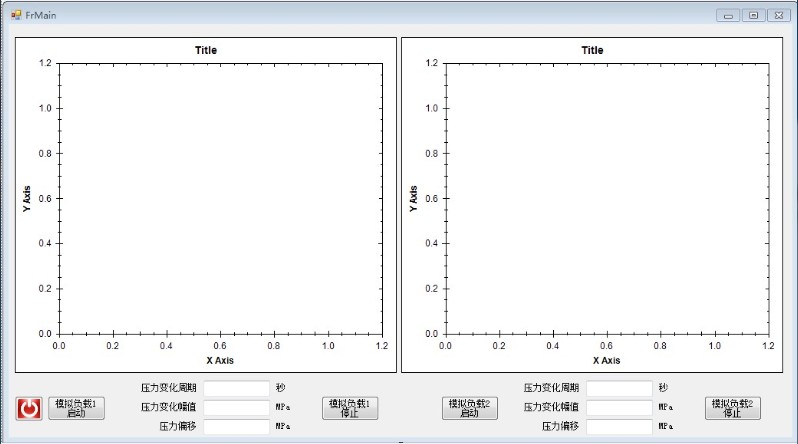
界面如图:
最后测试效果如图:

代码:
using System;

using System.Collections.Generic;

using System.ComponentModel;

using System.Data;

using System.Drawing;

using System.Linq;

using System.Text;

using System.Threading.Tasks;

using System.Windows.Forms;

using ZedGraph;

namespace ProfessionalTest

{

    public partial class FrMain : Form

    {

        #region 构造函数

        int tickStart = 0;

        int tickStart2 = 0;

        int zQ1 = 0;

        int zQ2 = 0;

        int fZ1 = 0;

        int fZ2 = 0;

        int pY1 = 0;

        int pY2 = 0;

        public FrMain()

        {

            InitializeComponent();

            this.ControlBox = false;

        }

        #endregion

        /// <summary>

        /// 窗体加载对两个表进行初始化

        /// </summary>

        /// <param name="sender"></param>

        /// <param name="e"></param>

        private void FrMain_Load(object sender, EventArgs e)

        {

            //无需油源流量压力设置,油源手动控制

            //OPC.OpcServer server = OPC.OpcServer.GetServer();  ///一个PC ACCESS 即为一个OPC server

            //server["油源"]["专业台当前流量"] = (float)50;

            //server["油源"]["专业台当前压力"] = (float)10;

            #region 负载模拟1

            //获取引用

            GraphPane myPane = zedGraphControl1.GraphPane;

            //设置标题

            myPane.Title.Text = "负载模拟1";

            //设置X轴说明文字

            myPane.XAxis.Title.Text = "时间";

            //设置Y轴说明文字

            myPane.YAxis.Title.Text = "给定压力/实测压力";

            //设置1200个点,假设每50毫秒更新一次,刚好检测1分钟,一旦构造后将不能更改这个值

            RollingPointPairList list = new RollingPointPairList(1200);

            RollingPointPairList list2 = new RollingPointPairList(1200);

            //开始,增加的线是没有数据点的(也就是list为空)

            //增加一条名称:Voltage,颜色Color.Bule,无符号,无数据的空线条

            LineItem curve = myPane.AddCurve("给定压力", list, Color.Blue, SymbolType.None);

            LineItem curve2 = myPane.AddCurve("实际压力", list2, Color.Red, SymbolType.None);

            timerDraw.Interval = 1000; //设置timer控件的间隔为500毫秒

            timerDraw.Enabled = true; //timer可用

            timerDraw.Stop(); //开始

            myPane.XAxis.Scale.Min = 0; //X轴最小值0

            myPane.XAxis.Scale.Max = 30; //X轴最大30

            myPane.XAxis.Scale.MinorStep = 1;//X轴小步长1,也就是小间隔

            myPane.XAxis.Scale.MajorStep = 5;//X轴大步长为5,也就是显示文字的大间隔

            //改变轴的刻度

            zedGraphControl1.AxisChange();

            //保存开始时间

            //tickStart = Environment.TickCount;

            #endregion

            #region 负载模拟2

            //获取引用

            GraphPane myPane1 = zedGraphControl2.GraphPane;

            //设置标题

            myPane1.Title.Text = "负载模拟2";

            //设置X轴说明文字

            myPane1.XAxis.Title.Text = "时间";

            //设置Y轴说明文字

            myPane1.YAxis.Title.Text = "给定压力/实测压力";

            //设置1200个点,假设每50毫秒更新一次,刚好检测1分钟,一旦构造后将不能更改这个值

            RollingPointPairList list3 = new RollingPointPairList(1200);

            RollingPointPairList list4 = new RollingPointPairList(1200);

            //开始,增加的线是没有数据点的(也就是list为空)

            //增加一条名称:Voltage,颜色Color.Bule,无符号,无数据的空线条

            LineItem curve3 = myPane1.AddCurve("给定压力", list3, Color.Blue, SymbolType.None);

            LineItem curve4 = myPane1.AddCurve("实际压力", list4, Color.Red, SymbolType.None);

            timer1Draw.Interval = 1000; //设置timer控件的间隔为500毫秒

            timer1Draw.Enabled = true; //timer可用

            timer1Draw.Stop(); //暂不启动

            myPane1.XAxis.Scale.Min = 0; //X轴最小值0

            myPane1.XAxis.Scale.Max = 30; //X轴最大30

            myPane1.XAxis.Scale.MinorStep = 1;//X轴小步长1,也就是小间隔

            myPane1.XAxis.Scale.MajorStep = 5;//X轴大步长为5,也就是显示文字的大间隔

            //改变轴的刻度

            zedGraphControl2.AxisChange();

            //保存开始时间

            //tickStart2 = Environment.TickCount;

            #endregion

        }

        /// <summary>

        /// 负载1模拟开始

        /// </summary>

        /// <param name="sender"></param>

        /// <param name="e"></param>

        private void button1_Click(object sender, EventArgs e)

        {

            try

            {

                zQ1 = int.Parse(textBox1.Text);

                fZ1 = int.Parse(textBox2.Text);

                pY1 = int.Parse(textBox5.Text);

                if (zQ1<=10)

                {

                    MessageBox.Show("周期过小,请将周期设为10秒以上") ;

                    return;

                }

                if (fZ1<=5)

                {

                    MessageBox.Show("幅值过小,请将幅值设为5MPa以上");

                    return;

                }

                else if (fZ1>=15)

                {

                    MessageBox.Show("幅值过大,请将幅值设为15MPa以下");

                    return;

                }

                if (pY1-fZ1 <0)

                {

                    MessageBox.Show("压力过小,请将压力设为0MPa以上");

                    return;

                }

                else if (fZ1 +pY1> 31.5)

                {

                    MessageBox.Show("压力过大,请将压力设为15MPa以下");

                    return;

                }

                button1.Enabled = false;

                timerDraw.Start();

                //保存开始时间

                tickStart = Environment.TickCount;

                #region 清空原有图表

                //确保CurveList不为空

                if (zedGraphControl1.GraphPane.CurveList.Count <= 0)

                {

                    return;

                }

                //取Graph第一个曲线,也就是第一步:在GraphPane.CurveList集合中查找CurveItem

                LineItem curve = zedGraphControl1.GraphPane.CurveList[0] as LineItem;

                LineItem curve2 = zedGraphControl1.GraphPane.CurveList[1] as LineItem;

                if (curve == null | curve2 == null)

                {

                    return;

                }

                //第二步:在CurveItem中访问PointPairList(或者其它的IPointList),根据自己的需要增加新数据或修改已存在的数据

                IPointListEdit list = curve.Points as IPointListEdit;

                IPointListEdit list2 = curve2.Points as IPointListEdit;

                list.Clear();

                list2.Clear();

                //第三步:调用Form.Invalidate()方法更新图表

                zedGraphControl1.Invalidate();

#endregion

            }

            catch (Exception)

            {

                MessageBox.Show("请输入正确数值");

            }

        }

        /// <summary>

        /// 负载2模拟开始

        /// </summary>

        /// <param name="sender"></param>

        /// <param name="e"></param>

        private void button2_Click(object sender, EventArgs e)

        {

            try

            {

                zQ2 = int.Parse(textBox3.Text);

                fZ2 = int.Parse(textBox4.Text);

                pY2 = int.Parse(textBox6.Text);

                if (zQ2 <= 10)

                {

                    MessageBox.Show("周期过小,请将周期设为10秒以上");

                    return;

                }

                if (fZ2 <= 5)

                {

                    MessageBox.Show("幅值过小,请将幅值设为5MPa以上");

                    return;

                }

                else if (fZ2 >= 15)

                {

                    MessageBox.Show("幅值过大,请将幅值设为15MPa以下");

                    return;

                }

                if (pY2 - fZ2 < 0)

                {

                    MessageBox.Show("压力过小,请将压力设为0MPa以上");

                    return;

                }

                else if (fZ2 + pY2 > 31.5)

                {

                    MessageBox.Show("压力过大,请将压力设为15MPa以下");

                    return;

                }

                button2.Enabled = false;

                timer1Draw.Start();

                //保存开始时间

                tickStart2 = Environment.TickCount;

                #region 清空原有图表

                //确保CurveList不为空

                if (zedGraphControl2.GraphPane.CurveList.Count <= 0)

                {

                    return;

                }

                //取Graph第一个曲线,也就是第一步:在GraphPane.CurveList集合中查找CurveItem

                LineItem curve3 = zedGraphControl2.GraphPane.CurveList[0] as LineItem;

                LineItem curve4 = zedGraphControl2.GraphPane.CurveList[1] as LineItem;

                if (curve3 == null | curve4 == null)

                {

                    return;

                }

                //第二步:在CurveItem中访问PointPairList(或者其它的IPointList),根据自己的需要增加新数据或修改已存在的数据

                IPointListEdit list3 = curve3.Points as IPointListEdit;

                IPointListEdit list4 = curve4.Points as IPointListEdit;

                if (list3 == null | list4 == null)

                {

                    return;

                }

                list3.Clear();

                list4.Clear();

                //第三步:调用Form.Invalidate()方法更新图表

                zedGraphControl2.Invalidate();

                #endregion

            }

            catch (Exception)

            {

                MessageBox.Show("请输入正确数值");

            }

        }

        /// <summary>

        /// 负载1模拟停止

        /// </summary>

        /// <param name="sender"></param>

        /// <param name="e"></param>

        private void button3_Click(object sender, EventArgs e)

        {

            timerDraw.Enabled = false;

            timerDraw.Stop();

            button1.Enabled = true;

            OPC.OpcServer server = OPC.OpcServer.GetServer();

            server["专业试验台"]["比例溢流阀4_1模拟缓存"] = (float)0;//写入压力0

        }

        /// <summary>

        /// 负载2模拟停止

        /// </summary>

        /// <param name="sender"></param>

        /// <param name="e"></param>

        private void button4_Click(object sender, EventArgs e)

        {

            timer1Draw.Enabled = false;

            timer1Draw.Stop();

            button2.Enabled = true;

            OPC.OpcServer server = OPC.OpcServer.GetServer();

            server["专业试验台"]["比例溢流阀4_2模拟缓存"] = (float)0;//写入压力0

        }

        /// <summary>

        /// 负载模拟1表格定时更新

        /// </summary>

        /// <param name="sender"></param>

        /// <param name="e"></param>

        private void timerDraw_Tick(object sender, EventArgs e)

        {

            //确保CurveList不为空

            if (zedGraphControl1.GraphPane.CurveList.Count <= 0)

            {

                return;

            }

            //取Graph第一个曲线,也就是第一步:在GraphPane.CurveList集合中查找CurveItem

            LineItem curve = zedGraphControl1.GraphPane.CurveList[0] as LineItem;

            LineItem curve2 = zedGraphControl1.GraphPane.CurveList[1] as LineItem;

            if (curve == null | curve2 == null)

            {

                return;

            }

            //第二步:在CurveItem中访问PointPairList(或者其它的IPointList),根据自己的需要增加新数据或修改已存在的数据

            IPointListEdit list = curve.Points as IPointListEdit;

            IPointListEdit list2 = curve2.Points as IPointListEdit;

            if (list == null | list2 == null)

            {

                return;

            }

            // 时间用秒表示

            double time = (Environment.TickCount - tickStart) / 1000.0;

            // 周期为zQ1,幅值为fZ1

            OPC.OpcServer server = OPC.OpcServer.GetServer();

            float gDYL = (float)(fZ1 * Math.Sin(2.0 * Math.PI * time / zQ1))+pY1;//给定压力值

            float sJYL = server["专业试验台"]["负载模拟压力缓存1_1"];//实际读取压力值

            server["专业试验台"]["比例溢流阀4_1模拟缓存"] = gDYL;//将周期值写入PLC

            list.Add(time, (double)gDYL);

            list2.Add(time, (double)sJYL);

            Console.WriteLine(time.ToString());

            Scale xScale = zedGraphControl1.GraphPane.XAxis.Scale;

            if (time > xScale.Max - xScale.MajorStep)

            {

                xScale.Max = time + xScale.MajorStep;

                xScale.Min = xScale.Max - 30.0;

            }

            //第三步:调用ZedGraphControl.AxisChange()方法更新X和Y轴的范围

            zedGraphControl1.AxisChange();

            //第四步:调用Form.Invalidate()方法更新图表

            zedGraphControl1.Invalidate();

        }

        /// <summary>

        /// 负载模拟2表格定时更新

        /// </summary>

        /// <param name="sender"></param>

        /// <param name="e"></param>

        private void timer1Draw_Tick(object sender, EventArgs e)

        {

            //确保CurveList不为空

            if (zedGraphControl2.GraphPane.CurveList.Count <= 0)

            {

                return;

            }

            //取Graph第一个曲线,也就是第一步:在GraphPane.CurveList集合中查找CurveItem

            LineItem curve3 = zedGraphControl2.GraphPane.CurveList[0] as LineItem;

            LineItem curve4 = zedGraphControl2.GraphPane.CurveList[1] as LineItem;

            if (curve3 == null | curve4 == null)

            {

                return;

            }

            //第二步:在CurveItem中访问PointPairList(或者其它的IPointList),根据自己的需要增加新数据或修改已存在的数据

            IPointListEdit list3 = curve3.Points as IPointListEdit;

            IPointListEdit list4 = curve4.Points as IPointListEdit;

            if (list3 == null | list4 == null)

            {

                return;

            }

            // 时间用秒表示

            double time = (Environment.TickCount - tickStart2) / 1000.0;

            // 周期为zQ2,幅值为fZ2

            OPC.OpcServer server = OPC.OpcServer.GetServer();

            float gDYL = (float)(fZ2 * Math.Sin(2.0 * Math.PI * time / zQ2))+pY2;//给定压力值

            float sJYL = server["专业试验台"]["负载模拟压力缓存1_2"];//实际读取压力值

            server["专业试验台"]["比例溢流阀4_2模拟缓存"] = gDYL;//将周期值写入PLC

            list3.Add(time, gDYL);

            list4.Add(time, sJYL);

            Console.WriteLine(time.ToString());

            Scale xScale = zedGraphControl2.GraphPane.XAxis.Scale;

            if (time > xScale.Max - xScale.MajorStep)

            {

                xScale.Max = time + xScale.MajorStep;

                xScale.Min = xScale.Max - 30.0;

            }

            //第三步:调用ZedGraphControl.AxisChange()方法更新X和Y轴的范围

            zedGraphControl2.AxisChange();

            //第四步:调用Form.Invalidate()方法更新图表

            zedGraphControl2.Invalidate();

        }

        /// <summary>

        /// 关闭窗体

        /// </summary>

        /// <param name="sender"></param>

        /// <param name="e"></param>

        private void button5_Click(object sender, EventArgs e)

        {

            OPC.OpcServer server = OPC.OpcServer.GetServer();

            server["专业试验台"]["比例溢流阀4_1模拟缓存"] = (float)0;//写入压力0

            server["专业试验台"]["比例溢流阀4_2模拟缓存"] = (float)0;//写入压力0

            this.Close();

        }

    }

}
C#上位机中ZedGraph控件的使用的更多相关文章
- 轻松学习Asp.net中的控件
C/S 结构,即大家熟知的客户机和服务器结构.它是软件系统体系结构,通过它可以充分利用两端硬件环境的优势,将任务合理分配到Client端和Server端来实现,降低了系统的通讯开销.目前大多数应用软件 ...
- 基于VB中WINSOCK控件的网上象棋系统的实现
本文发表在<微型机与应用>杂志2001年第3期. 基于VB中WINSOCK控件的网上象棋系统的实现 马根峰1 , 孙艳2 , 王平1 (1.重庆邮电学院自动化学院,重庆,40006 ...
- ZedGraph控件的使用
http://blog.chinaunix.net/uid-20776117-id-1847015.html 在我们编写程序的时候,有时候是要做一些统计的,为了达到一目了然的效果,饼状图,曲线图,柱状 ...
- ZedGraph控件的使用 --归类(转帖)
在我们编写程序的时候,有时候是要做一些统计的,为了达到一目了然的效果,饼状图,曲线图,柱状图都是很好的表现统计的直观形式.这个时候,ZedGraph控件给我们带来了极大的方便. 1.下载ZedGrap ...
- 用ZedGraph控件作图圆
转自原文 用ZedGraph控件作图圆 用ZedGraph控件绘制圆各位: 我想利用第三方控ZedGraph在WinForm窗体中绘制图形如,圆,填充圆,只是简单的圆图形,但一直没有找到相应的方 ...
- CSharpGL(26)在opengl中实现控件布局/渲染文字
CSharpGL(26)在opengl中实现控件布局/渲染文字 效果图 如图所示,可以将文字.坐标轴固定在窗口的一角. 下载 CSharpGL已在GitHub开源,欢迎对OpenGL有兴趣的同学加入( ...
- WPF中Ribbon控件的使用
这篇博客将分享如何在WPF程序中使用Ribbon控件.Ribbon可以很大的提高软件的便捷性. 上面截图使Outlook 2010的界面,在Home标签页中,将所属的Menu都平铺的布局,非常容易的可 ...
- Android线程中设置控件
在Android中经常出现多线程中设置控件的值报错的情况,今天教大家封装一个简单的类避免这样的问题,同样也调用实现也非常的方便. 自定义类: /** * Created by wade on 2016 ...
- [转载]ASP.NET中TextBox控件设立ReadOnly="true"后台取不到值
原文地址:http://www.cnblogs.com/yxyht/archive/2013/03/02/2939883.html ASP.NET中TextBox控件设置ReadOnly=" ...
随机推荐
- unittest之跳过用例(skip) (含如何调用类里面函数相互调取变量的方法)
当测试用例写完后,有些模块有改动时候,会影响到部分用例的执行,这个时候我们希望暂时跳过这些用例. 或者前面某个功能运行失败了,后面的几个用例是依赖于这个功能的用例,如果第一步就失败了,后面的用例也就没 ...
- I/O通信模型(BIO,NIO,AIO)
一.传统的BIO 网络编程的基本模型是Client/Server模型,也就是两个进程之间进行相互通信,其中服务端提供位置信息(绑定的IP地址和监听端口),客户端通过连接操作向服务端监听的地址发起连接请 ...
- 1146 Topological Order
题意:判断序列是否为拓扑序列. 思路:理解什么是拓扑排序就好了,简单题.需要注意的地方就是,因为这里要判断多个,每次判断都会改变入度indegree[],因此记得要把indegree[]留个备份.ps ...
- tp5 快速接入扫码支付
前提是申请好微信支付,同时配置好key,以及支付回调地址 1.composer composer require yansongda/pay 2.引入 use Yansongda\Pay\Pay; / ...
- Dynamics CRM 2011 WebResources
Type Limitation Capabilities Usage Images JPG, PNG, GIF, ICO Custom entity icons Icons for custom ...
- Linux - 用户的增删改查及组的相关操作
useradd:新增一个用户 useradd 几个常用的参数: -u:指定用户的 uid -g:指定用户所属的组 -d:指定用户的家目录 -c:指定用户的备注信息 -s:指定用户所用的 shell [ ...
- PHP字符串的处理(三)-字符串的输出
1.echo() echo()实际不是一个函数,是一个语言结构,不需要使用括号 <?php $str = "test"; echo $str."<br> ...
- Three.js创建运动立体几何体示例
效果图 安装 帧率统计工具 变量控制GUI demo 效果图 安装 npm install three 帧率统计工具 // 监听动画帧率 var Stats = function () { var m ...
- java - 判断 字符串是否为空
java - 判断 字符串是否为空 方法一: 最多人使用的一个方法, 直观, 方便, 但效率很低.1:if(s == null || s.equals(""));方法二: 比较字符 ...
- hive函数
内置函数 测试各种内置函数的快捷方法: 1.创建一个dual表 create table dual(id string); 2.load一个文件(一行,一个空格)到dual表 3.select sub ...