建立Heapster Influxdb Grafana集群性能监控平台
依赖于kubenets dns服务
图形化展示度量指标的实现需要集成k8s的另外一个Addons组件: Heapster 。
Heapster原生支持K8s(v1.0.6及以后版本)和 CoreOS ,并且支持多种存储后端,比如: InfluxDB 、 ElasticSearch 、 Kafka 。
镜像地址:
index.tenxcloud.com/jimmy/heapster-amd64:v1.3.0-beta.1
index.tenxcloud.com/jimmy/heapster-influxdb-amd64:v1.1.1
index.tenxcloud.com/jimmy/heapster-grafana-amd64:v4.0.2
安装Heapster
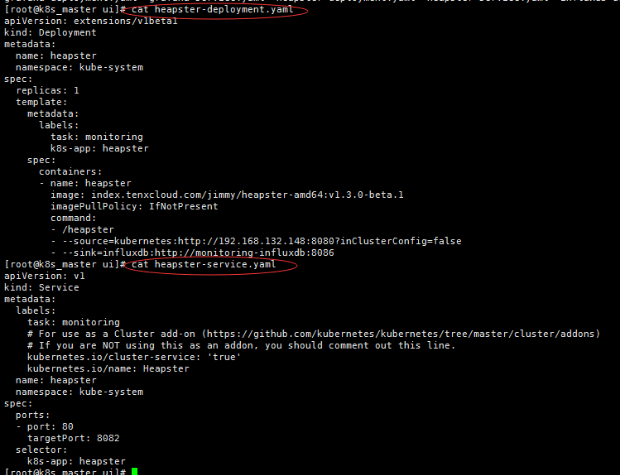
heapster-deployment.yaml
[root@k8s_master ui]# cat heapster-deployment.yaml
apiVersion: extensions/v1beta1
kind: Deployment
metadata:
  name: heapster
  namespace: kube-system
spec:
  replicas: 1
  template:
    metadata:
      labels:
        task: monitoring
        k8s-app: heapster
    spec:
      containers:
      - name: heapster
        image: index.tenxcloud.com/jimmy/heapster-amd64:v1.3.0-beta.1
        imagePullPolicy: IfNotPresent
        command:
        - /heapster
        - --source=kubernetes:http://192.168.132.148:8080?inClusterConfig=false
        - --sink=influxdb:http://monitoring-influxdb:8086
注意:修改- --source为自己的master apiserver访问地址 ,修改image地址(上面已经提供)
heapster-service.yaml
[root@k8s_master ui]# cat heapster-service.yaml
apiVersion: v1
kind: Service
metadata:
  labels:
    task: monitoring
    # For use as a Cluster add-on (https://github.com/kubernetes/kubernetes/tree/master/cluster/addons)
    # If you are NOT using this as an addon, you should comment out this line.
    kubernetes.io/cluster-service: 'true'
    kubernetes.io/name: Heapster
  name: heapster
  namespace: kube-system
spec:
  ports:
  - port: 80
    targetPort: 8082
  selector:
    k8s-app: heapster
创建deployment和service
#kubectl create -f heapster-deployment.yaml
#kubectl create -f heapster-service.yaml
配置Influxdb
influxdb 官方建议使用命令行或 HTTP API 接口来查询数据库,从 v1.1.0 版本开始默认关闭 admin UI,将在后续版本中移除 admin UI 插件。
开启镜像中 admin UI的办法如下:先导出镜像中的 influxdb 配置文件,开启插件后,再将配置文件内容写入 ConfigMap,最后挂载到镜像中,达到覆盖原始配置的目的。
$ #在镜像所在的宿主机上,导出镜像中的influxdb配置文件
$ docker run --rm --entrypoint 'cat' -ti heapster-influxdb-amd64:v1.1.1 /etc/config.toml >config.toml.orig
$ cp config.toml.orig config.toml
$ # 修改:启用 admin 接口
$ vim config.toml
修改第35行
< enabled = false
---
> enabled = true
$ #将修改后的config.toml拷贝到Master上,再将修改后的配置写入到ConfigMap对象中
$ kubectl create configmap influxdb-config --from-file=config.toml -n kube-system
$ # 将ConfigMap中的配置文件挂载到Pod中,达到覆盖原始配置的目的
influxdb-deployment.yaml文件
[root@k8s_master ui]# cat influxdb-deployment.yaml
apiVersion: extensions/v1beta1
kind: Deployment
metadata:
  name: monitoring-influxdb
  namespace: kube-system
spec:
  replicas: 1
  template:
    metadata:
      labels:
        task: monitoring
        k8s-app: influxdb
    spec:
      containers:
      - name: influxdb
        image: index.tenxcloud.com/jimmy/heapster-influxdb-amd64:v1.1.1
        volumeMounts:
        - mountPath: /data
          name: influxdb-storage
        - mountPath: /etc/
          name: influxdb-config
      volumes:
      - name: influxdb-config
        configMap:
          name: influxdb-config
      - name: influxdb-storage
        emptyDir: {}
influxdb-service.yaml
[root@k8s_master ui]# cat influxdb-service.yaml
apiVersion: v1
kind: Service
metadata:
  labels:
    task: monitoring
    # For use as a Cluster add-on (https://github.com/kubernetes/kubernetes/tree/master/cluster/addons)
    # If you are NOT using this as an addon, you should comment out this line.
    kubernetes.io/cluster-service: 'true'
    kubernetes.io/name: monitoring-influxdb
  name: monitoring-influxdb
  namespace: kube-system
spec:
  type: NodePort
  ports:
  - port: 8086
    targetPort: 8086
    name: http
  - port: 8083
    targetPort: 8083
    name: api
  selector:
    k8s-app: influxdb
创建deployment和service
#kubectl create -f influxdb-deployment.yaml
#kubectl create -f influxdb-service.yaml
安装grafana
grafana-deployment.yaml
[root@k8s_master ui]# cat grafana-deployment.yaml
apiVersion: extensions/v1beta1
kind: Deployment
metadata:
  name: monitoring-grafana
  namespace: kube-system
spec:
  replicas: 1
  template:
    metadata:
      labels:
        task: monitoring
        k8s-app: grafana
    spec:
      containers:
      - name: grafana
        image: index.tenxcloud.com/jimmy/heapster-grafana-amd64:v4.0.2
        ports:
          - containerPort: 3000
            protocol: TCP
        volumeMounts:
        - mountPath: /var
          name: grafana-storage
        env:
        - name: INFLUXDB_HOST
          value: monitoring-influxdb
        - name: GRAFANA_PORT
          value: "
          # The following env variables are required to make Grafana accessible via
          # the kubernetes api-server proxy. On production clusters, we recommend
          # removing these env variables, setup auth for grafana, and expose the grafana
          # service using a LoadBalancer or a public IP.
        - name: GF_AUTH_BASIC_ENABLED
          value: "false"
        - name: GF_AUTH_ANONYMOUS_ENABLED
          value: "true"
        - name: GF_AUTH_ANONYMOUS_ORG_ROLE
          value: Admin
        - name: GF_SERVER_ROOT_URL
          # If you're only using the API Server proxy, set this value instead:
          value: /api/v1/proxy/namespaces/kube-system/services/monitoring-grafana/
          #value: /
      volumes:
      - name: grafana-storage
        emptyDir: {}
grafana-service.yaml
[root@k8s_master ui]# cat grafana-service.yaml
apiVersion: v1
kind: Service
metadata:
  labels:
    # For use as a Cluster add-on (https://github.com/kubernetes/kubernetes/tree/master/cluster/addons)
    # If you are NOT using this as an addon, you should comment out this line.
    kubernetes.io/cluster-service: 'true'
    kubernetes.io/name: monitoring-grafana
  name: monitoring-grafana
  namespace: kube-system
spec:
  # In a production setup, we recommend accessing Grafana through an external Loadbalancer
  # or through a public IP.
  # type: LoadBalancer
  # You could also use NodePort to expose the service at a randomly-generated port
  # type: NodePort
  ports:
  - port: 80
    targetPort: 3000
  selector:
    k8s-app: grafana
创建deployment和service
#kubectl create -f grafana-deployment.yaml
#kubectl create -f grafana-service.yaml
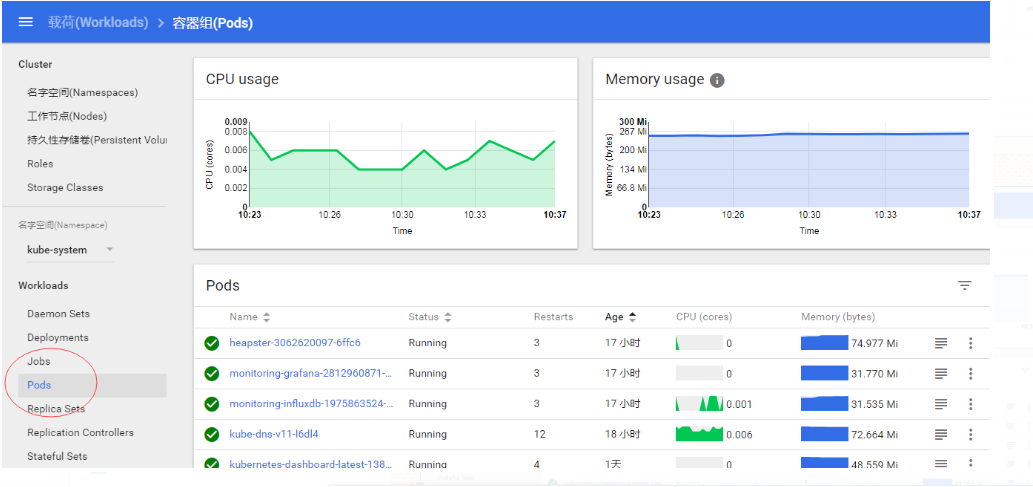
获取所有pod
[root@k8s_master ui]#  kubectl get pod -n kube-system
NAME                                           READY     STATUS    RESTARTS   AGE
heapster-3275159538-fdvhf                      1/1       Running   0          5s
kubernetes-dashboard-latest-1381663337-0wwml   1/1       Running   1          19h
monitoring-grafana-2812960871-gbsdf            1/1       Running   1          16h
monitoring-influxdb-1975863524-nmbpk           1/1       Running   1          16h
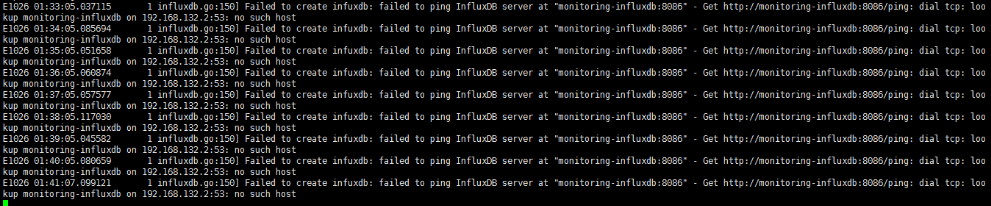
打印日志
[root@k8s_master ui]# kubectl logs -f pods/heapster-3275159538-fdvhf -n kube-system

如果没有配置dns,Influxdb会报如下错误
访问验证:
http://192.168.132.148:8080/ui
验证Influxdb
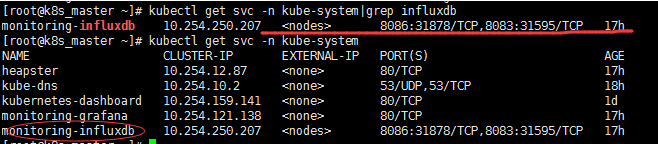
8086端口对应31878
访问:
http://192.168.132.148:8080/api/v1/proxy/namespaces/kube-system/services/monitoring-influxdb:8083/

这里的ip为部署influxdb的主机
查看状态
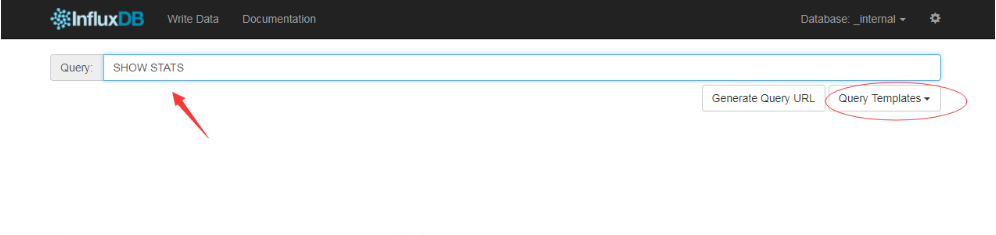
直接回车

通过 kube-apiserver 的非安全端口访问 influxdb 的 admin UI 界面:
[root@k8s_master ~]# kubectl cluster-info

注:这些地址均可在以上的deployment.yaml 里设置
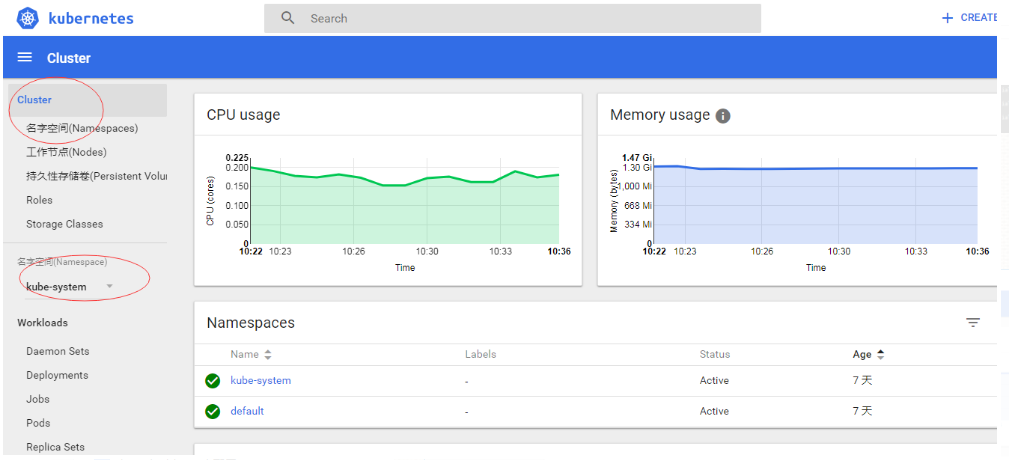
grafan地址:
http://192.168.132.148:8080/api/v1/proxy/namespaces/kube-system/services/monitoring-grafana/dashboard/db/cluster
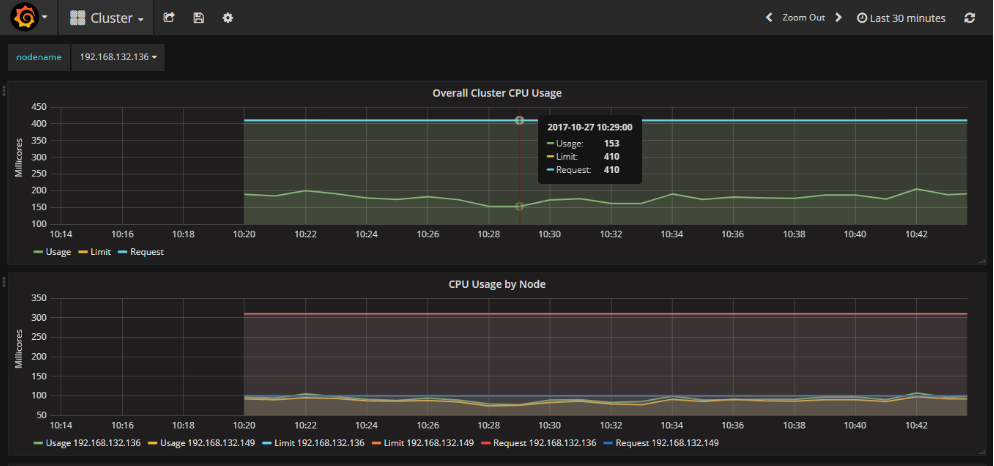

配置信息

建立Heapster Influxdb Grafana集群性能监控平台的更多相关文章
- cAdvisor0.24.1+InfluxDB0.13+Grafana4.0.2搭建Docker1.12.3 Swarm集群性能监控平台
目录 [TOC] 1.基本概念 既然是对Docker的容器进行监控,我们就不自己单独搭建cAdvisor.InfluxDB.Grarana了,本文中这三个实例,主要以Docker容器方式运行. 本 ...
- 高可用Kubernetes集群-14. 部署Kubernetes集群性能监控平台
参考文档: Github介绍:https://github.com/kubernetes/heapster Github yaml文件: https://github.com/kubernetes/h ...
- 搭建jmeter+influxdb+grafana压测实时监控平台(超详细,小白适用)
1.前言 在使用jmeter做性能测试的时候,监控系统性能的时候,无论是使用插件还是报告生成,都没法实现实时监控.使用JMeter+Influxdb+Grafana可以实现实时监控. 本次环境搭建各软 ...
- .NET Core微服务之基于App.Metrics+InfluxDB+Grafana实现统一性能监控
Tip: 此篇已加入.NET Core微服务基础系列文章索引 一.关于App.Metrics+InfluxDB+Grafana 1.1 App.Metrics App.Metrics是一款开源的支持. ...
- Linux服务器集群性能监控之Performance Co-Pilot(PCP)部署
转载自:https://blog.csdn.net/w84268426/article/details/78431778 在部署PCP时,我用到了两台cent os 7虚拟机. 1.官方安装文档htt ...
- 详解k8s原生的集群监控方案(Heapster+InfluxDB+Grafana) - kubernetes
1.浅析监控方案 heapster是一个监控计算.存储.网络等集群资源的工具,以k8s内置的cAdvisor作为数据源收集集群信息,并汇总出有价值的性能数据(Metrics):cpu.内存.netwo ...
- kubernetes 监控方案之:heapster+influxdb+grafana(十八)
目录 一.Heapster 介绍 二.部署 三.使用 heapster 已经 deprecated 了:https://github.com/kubernetes/heapster,所以下面的演示主要 ...
- Docker系列——InfluxDB+Grafana+Jmeter性能监控平台搭建(一)
在做性能测试的时候,重点关注点是各项性能指标,用Jmeter工具,查看指标数据,就是借助于聚合报告,但查看时也并不方便.那如何能更直观的查看各项数据呢?可以通过InfluxDB+Grafana+Jme ...
- Docker系列——InfluxDB+Grafana+Jmeter性能监控平台搭建(二)
在上一篇博文中,主要是讲了InfluxDB的配置,博文链接:https://www.cnblogs.com/hong-fithing/p/14453695.html,今天来分享下Jmeter的配置. ...
随机推荐
- LAMP架构部署和动态网站环境的配置
实验环境: 操作系统:centos 7.5 服务器IP:192.168.10.5 运行用户:root 连接工具:xshell工具 web环境:Linux+apache+php+mariadb(LAMP ...
- Codeforces Round #419 Div. 1
A:暴力枚举第一列加多少次,显然这样能确定一种方案. #include<iostream> #include<cstdio> #include<cmath> #in ...
- C# 电脑上提示未知发布者
参考6楼:http://tieba.baidu.com/p/5767451198?pid=120504172126&cid=120504203560#120504203560 解决方案:mak ...
- Linux大学实验
一. 准备工作(预防抄袭,此步必做) 1. 请将提示符设为:学号加波浪号.输入PS1=学号~,如PS1=110015~, 回车执行 2. 如发现提示符.学号不匹配, 视为抄袭或无效 二.操作题(每题5 ...
- GCD HDU - 2588
输入 N 和 M (2<=N<=1000000000, 1<=M<=N), 找出所有满足1<=X<=N 且 gcd(X,N)>=M 的 X 的数量. Inpu ...
- 最简单的spring boot web项目
搭建效果为: 直接在网页输入请求,在页面中显示一行文字:Hello,Spring Boot 与一般的wen项目不同的地方: 1.不需要配置web.xml 文件,但需要注解@SpringBootAppl ...
- studio 连不上远程仓库的各种原因分析
Unable to open the project 1.远程服务器挂了2.网络断了3.登录远程服务器的账号.密码错了4.远程仓库的url地址,被本地的hosts文件重定向了5.要下载远程仓库的某个j ...
- Git回滚代码暴力法
Git回滚有多种方式,这里使用的是[强制提交到远程分支] 效果为:如回滚前的提交记录是 1.2.3.4,使用这种方法回滚到2,那么提交记录就变成了1.2. 操作方法: 需要在本地的Git仓库,右键选择 ...
- project 2013 任务显示编号
1. 方法 格式-->大纲数字勾起来即可 2.结果
- [luogu2286][HNOI2004]宠物收养场【平衡树】
[传送门] 前言 这一篇题解并不是为了讲什么算法,只是总结一下平衡树在OI考试中的注意事项. 题意简化(给不想看题目的小伙伴们一点福利) 给你两堆数,每一次给你一个数,每一次在另外一堆数中找到这个数的 ...