d3.js多个x轴y轴canvas柱状图
最终效果图镇楼:
本文通过三个步骤来介绍d3.js。
1、简单的柱状图;
2、多个x轴的柱状图;
3、多个x轴、y轴的柱状图;
学习心得:
d3.js入门相对比较困难,一旦掌握了核心思想,不断熟悉API,就可以做出很灵活、实用的图表。
canvas中,d3帮我们计算好了每个图形的位置,我们再一个一个的画上即可。
不要担心代码看起来很多,一个一个的分析出来,就会发现其实还是有套路的。
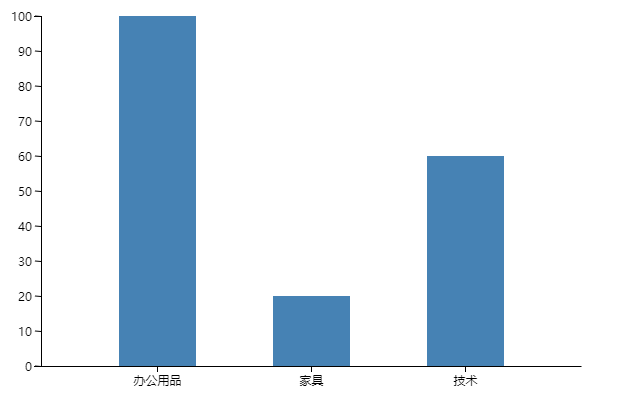
一、简单图表
示意图:
代码:
<!DOCTYPE html>

<html lang="en">

<head>

  <meta charset="UTF-8">

  <title></title>

</head>

<body>

<canvas id="myCanvas" width="600" height="400"></canvas>

<script src="d3.min.js"></script>

<script>

  "use strict";

  (function () {

    function init() {

      initData();

    }

    function initData() {var oneData = [

        {'name': '办公用品', 'value': 100},

        {'name': '家具', 'value': 20},

        {'name': '技术', 'value': 60}

      ];

      initUI(oneData);

    }

    function initUI(data) {

      var canvas = document.querySelector('#myCanvas');

      var context = canvas.getContext('2d');

      var margin = {top: 20, right: 20, bottom: 30, left: 40};

      var width = canvas.width - margin.left - margin.right;

      var height = canvas.height - margin.top - margin.bottom;

      var x0 = d3.scaleBand()

        .domain(data.map(function (d) {

          return d.name;

        }))

        .rangeRound([0, width])

        .padding(0.5);

      var y0 = d3.scaleLinear()

        .domain([0, d3.max(data, function (d) {

          return d.value;

        })])

        .range([height, 0]);

      context.translate(margin.left, margin.top);

      context.beginPath();

      x0.domain().forEach(function (d) {

        context.moveTo(x0(d) + x0.bandwidth() / 2, height);

        context.lineTo(x0(d) + x0.bandwidth() / 2, height + 6);

      });

      context.strokeStyle = 'black';

      context.stroke();

      context.textAlign = "center";

      context.textBaseline = "top";

      x0.domain().forEach(function (d) {

        context.fillText(d, x0(d) + x0.bandwidth() / 2, height + 6);

      });

      context.beginPath();

      context.moveTo(0.5, height + 0.5);

      context.lineTo(width + 0.5, height + 0.5);

      context.strokeStyle = "black";

      context.stroke();

      var yTickCount = 10;

      var yTicks = y0.ticks(yTickCount);

      context.beginPath();

      yTicks.forEach(function (d) {

        context.moveTo(0, y0(d) + 0.5);

        context.lineTo(-6, y0(d) + 0 / 5);

      });

      context.strokeStyle = 'black';

      context.stroke();

      context.textAlign = "right";

      context.textBaseline = "middle";

      yTicks.forEach(function (d) {

        context.fillText(d, -9, y0(d));

      });

      context.beginPath();

      context.moveTo(-6.5, 0 + 0.5);

      context.lineTo(0.5, 0 + 0.5);

      context.lineTo(0.5, height + 0.5);

      context.lineTo(-6.5, height + 0.5);

      context.strokeStyle = "black";

      context.stroke();

      context.fillStyle = "steelblue";

      data.forEach(function (d) {

        context.fillRect(x0(d.name), y0(d.value), x0.bandwidth(), height - y0(d.value));

      });

    }

    init();

  }());

</script>

</body>

</html>
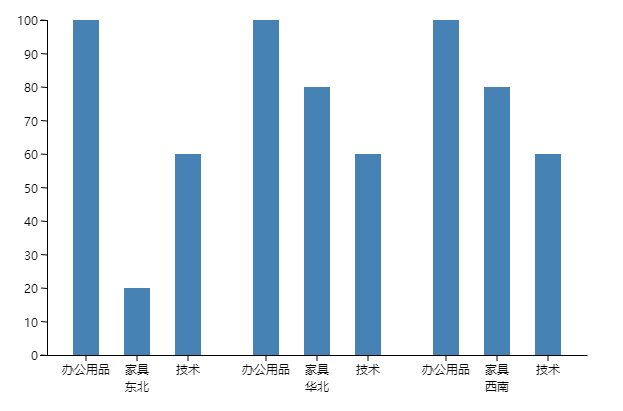
二、多个x轴
示意图:
代码:
<!DOCTYPE html>

<html lang="en">

<head>

  <meta charset="UTF-8">

  <title></title>

</head>

<body>

<canvas id="myCanvas" width="600" height="400"></canvas>

<script src="d3.min.js"></script>

<script>

  "use strict";

  (function () {

    function init() {

      initData();

    }

    function initData() {var data =

        [

          {

            'name': '东北',

            'value': [

              {'name': '办公用品', 'value': 100},

              {'name': '家具', 'value': 20},

              {'name': '技术', 'value': 60}

            ]

          },

          {

            'name': '华北',

            'value': [

              {'name': '办公用品', 'value': 100},

              {'name': '家具', 'value': 80},

              {'name': '技术', 'value': 60}

            ]

          },

          {

            'name': '西南',

            'value': [

              {'name': '办公用品', 'value': 100},

              {'name': '家具', 'value': 80},

              {'name': '技术', 'value': 60}

            ]

          }

        ];

      initUI(data);

    }

    function initUI(data) {

      var canvas = document.querySelector('#myCanvas');

      var context = canvas.getContext('2d');

      var margin = {top: 20, right: 20, bottom: 45, left: 40};

      var width = canvas.width - margin.left - margin.right;

      var height = canvas.height - margin.top - margin.bottom;

      var xAxis0 = d3.scaleBand()

        .domain(data.map(function (d) {

          return d.name;

        }))

        .rangeRound([0, width]);

      var firstRow = data[0];

      var xAxis1 = d3.scaleBand()

        .domain(firstRow.value.map(function (d) {

          return d.name;

        }))

        .rangeRound([0, xAxis0.bandwidth()])

        .padding(0.5);

      var yAxis0 = d3.scaleLinear()

        .domain([0, d3.max(data, function (d0) {

          return d3.max(d0.value, function (d1) {

            return d1.value;

          })

        })])

        .range([height, 0]);

      context.translate(margin.left, margin.top);

      context.beginPath();

      context.textAlign = "center";

      context.textBaseline = "top";

      xAxis0.domain().forEach(function (d) {

        context.fillText(d, xAxis0(d) + xAxis0.bandwidth() / 2, height + 23);

      });

      data.forEach(function (d0) {

        var pX0 = xAxis0(d0.name);

        d0.value.forEach(function (d1) {

          context.moveTo(pX0 + xAxis1(d1.name) + xAxis1.bandwidth() / 2, height);

          context.lineTo(pX0 + xAxis1(d1.name) + xAxis1.bandwidth() / 2, height + 6);

          context.fillText(d1.name, pX0 + xAxis1(d1.name) + xAxis1.bandwidth() / 2, height + 6);

        });

      });

      context.strokeStyle = 'black';

      context.stroke();

      context.beginPath();

      context.moveTo(0.5, height + 0.5);

      context.lineTo(width + 0.5, height + 0.5);

      context.strokeStyle = "black";

      context.stroke();

      var yTickCount = 10;

      var yTicks = yAxis0.ticks(yTickCount);

      context.beginPath();

      yTicks.forEach(function (d) {

        context.moveTo(0, yAxis0(d) + 0.5);

        context.lineTo(-6, yAxis0(d) + 0 / 5);

      });

      context.strokeStyle = 'black';

      context.stroke();

      context.textAlign = "right";

      context.textBaseline = "middle";

      yTicks.forEach(function (d) {

        context.fillText(d, -9, yAxis0(d));

      });

      context.beginPath();

      context.moveTo(-6.5, 0 + 0.5);

      context.lineTo(0.5, 0 + 0.5);

      context.lineTo(0.5, height + 0.5);

      context.lineTo(-6.5, height + 0.5);

      context.strokeStyle = "black";

      context.stroke();

      context.fillStyle = "steelblue";

      data.forEach(function (d0) {

        var pX0 = xAxis0(d0.name);

        d0.value.forEach(function (d1) {

          var pX1 = pX0 + xAxis1(d1.name);

          var pY1 = yAxis0(d1.value);

          var pWidth = xAxis1.bandwidth();

          var pHeight = height - yAxis0(d1.value);

          context.fillRect(pX1, pY1, pWidth, pHeight);

        })

      });

    }

    init();

  }());

</script>

</body>

</html>
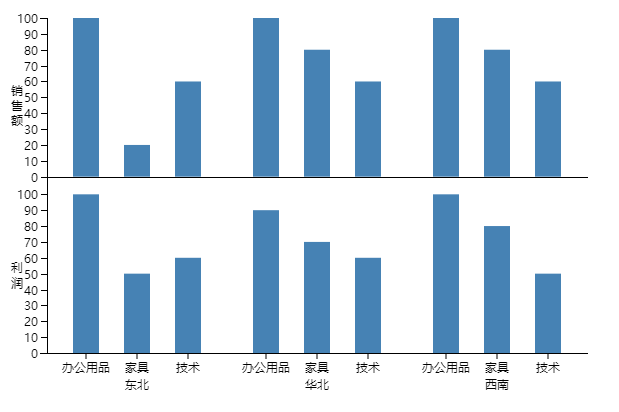
三、多个x、y轴
示意图:

代码:
<!DOCTYPE html>

<html lang="en">

<head>

  <meta charset="UTF-8">

  <title></title>

</head>

<body>

<canvas id="myCanvas" width="600" height="400"></canvas>

<script src="d3.min.js"></script>

<script>

  "use strict";

  (function () {

    function init() {

      initData();

    }

    function initData() {var data =

        [

          {

            'name': '利润',

            'value': [

              {

                'name': '东北',

                'value': [

                  {'name': '办公用品', 'value': 100},

                  {'name': '家具', 'value': 50},

                  {'name': '技术', 'value': 60}

                ]

              },

              {

                'name': '华北',

                'value': [

                  {'name': '办公用品', 'value': 90},

                  {'name': '家具', 'value': 70},

                  {'name': '技术', 'value': 60}

                ]

              },

              {

                'name': '西南',

                'value': [

                  {'name': '办公用品', 'value': 100},

                  {'name': '家具', 'value': 80},

                  {'name': '技术', 'value': 50}

                ]

              }

            ]

          },

          {

            'name': '销售额',

            'value': [

              {

                'name': '东北',

                'value': [

                  {'name': '办公用品', 'value': 100},

                  {'name': '家具', 'value': 20},

                  {'name': '技术', 'value': 60}

                ]

              },

              {

                'name': '华北',

                'value': [

                  {'name': '办公用品', 'value': 100},

                  {'name': '家具', 'value': 80},

                  {'name': '技术', 'value': 60}

                ]

              },

              {

                'name': '西南',

                'value': [

                  {'name': '办公用品', 'value': 100},

                  {'name': '家具', 'value': 80},

                  {'name': '技术', 'value': 60}

                ]

              }

            ]

          }

        ];

      initUI(data);

    }

    function initUI(data) {

      var canvas = document.querySelector('#myCanvas');

      var context = canvas.getContext('2d');

      var margin = {top: 20, right: 20, bottom: 45, left: 40};

      var width = canvas.width - margin.left - margin.right;

      var height = canvas.height - margin.top - margin.bottom;

      var firstRow = data[0].value;

      var firstFirstRow = firstRow[0].value;

      var xAxis0 = d3.scaleBand()

        .domain(firstRow.map(function (d) {

          return d.name;

        }))

        .rangeRound([0, width]);

      var xAxis1 = d3.scaleBand()

        .domain(firstFirstRow.map(function (d) {

          return d.name;

        }))

        .rangeRound([0, xAxis0.bandwidth()])

        .padding(0.5);

      var yAxis0 = d3.scaleBand()

        .domain(data.map(function (d) {

          return d.name;

        }))

        .range([height, 0])

        .paddingInner(0.1);

      var yAxis1 = d3.scaleLinear()

        .domain([0, d3.max(data, function (d0) {

          return d3.max(d0.value, function (d1) {

            return d3.max(d1.value, function (d2) {

              return d2.value;

            })

          })

        })])

        .range([yAxis0.bandwidth(), 0]);

      context.translate(margin.left, margin.top);

      context.beginPath();

      context.textAlign = "center";

      context.textBaseline = "top";

      xAxis0.domain().forEach(function (d) {

        context.fillText(d, xAxis0(d) + xAxis0.bandwidth() / 2, height + 23);

      });

      firstRow.forEach(function (xData0) {

        var pX0 = xAxis0(xData0.name);

        xData0.value.forEach(function (xData1) {

          context.moveTo(pX0 + xAxis1(xData1.name) + xAxis1.bandwidth() / 2, height);

          context.lineTo(pX0 + xAxis1(xData1.name) + xAxis1.bandwidth() / 2, height + 6);

          context.fillText(xData1.name, pX0 + xAxis1(xData1.name) + xAxis1.bandwidth() / 2, height + 6);

        })

      });

      context.strokeStyle = 'black';

      context.stroke();

      context.beginPath();

      data.forEach(function (yData0) {

        var pY0 = yAxis0(yData0.name);

        var y = +(pY0 + yAxis0.bandwidth()).toFixed(0) + 0.5;

        context.moveTo(0.5, y);

        context.lineTo(width + 0.5, y);

      });

      context.strokeStyle = "black";

      context.stroke();

      var yTickCount = 10;

      var yTicks = yAxis1.ticks(yTickCount);

      context.beginPath();

      data.forEach(function (yData0) {

        var pY0 = yAxis0(yData0.name);

        for (var idx = 0; idx < yData0.name.length; idx++) {

          context.fillText(yData0.name[idx], -30, pY0 + yAxis0.bandwidth() / 2 - 15 + idx * 15);

        }

        yTicks.forEach(function (d) {

          var y = +(pY0 + yAxis1(d)).toFixed(0) + 0.5;

          context.moveTo(0, y);

          context.lineTo(-6, y);

        });

      });

      context.strokeStyle = 'black';

      context.stroke();

      context.textAlign = "right";

      context.textBaseline = "middle";

      data.forEach(function (yData0) {

        var pY0 = yAxis0(yData0.name);

        yTicks.forEach(function (d) {

          var y = pY0 + yAxis1(d);

          context.fillText(d, -9, y);

        });

      });

      context.beginPath();

      context.moveTo(-6.5, 0 + 0.5);

      context.lineTo(0.5, 0 + 0.5);

      context.lineTo(0.5, height + 0.5);

      context.lineTo(-6.5, height + 0.5);

      context.strokeStyle = "black";

      context.stroke();

      context.fillStyle = "steelblue";

      data.forEach(function (yData0) {

        var pY0 = yAxis0(yData0.name);

        yData0.value.forEach(function (xData0) {

          var pX0 = xAxis0(xData0.name);

          xData0.value.forEach(function (xData1) {

            var pX1 = pX0 + xAxis1(xData1.name);

            var pY1 = pY0 + yAxis1(xData1.value);

            var pWidth = xAxis1.bandwidth();

            var pHeight = yAxis0.bandwidth() - yAxis1(xData1.value);

            context.fillRect(pX1, pY1, pWidth, pHeight);

          })

        })

      });

    }

    init();

  }());

</script>

</body>

</html>
源码下载:src
d3.js多个x轴y轴canvas柱状图的更多相关文章
- vue中使用v-chart改变柱状图颜色以及X轴Y轴的文字颜色和大小以及标题
1.html部分 <ve-histogram :tooltip-visible="true" :x-axis="xAxis" :y-axis=" ...
- highcharts 不显示X轴 Y轴 刻度
xAxis: { tickWidth:0, //设置刻度标签宽度 lineColor:'#ffffff',//设置坐标颜色 lineWidth:0, //设置坐标宽度 la ...
- 3d照片环效果(修改版--添加了x轴y轴双向转动和修复模糊度的bug)
今天用用前两天总结的css3新效果写了一个3d照片环的效果,其中还有些bug大家可以看一看,一起改进. <!DOCTYPE html> <html lang="en&quo ...
- JS逆向实战6-- x轴 y轴 过点触验证码
点触验证码是一种常见的反爬手段 解决方案有两种:一种是直接解决,这需要深度学习机器学习等图像处理技术,以大量的数据训练识别模型,最终达到模型足矣识别图片中的文字提示和应该点击的区域之间的对应关系. 这 ...
- PhoneGap 加速计 api 获取加速计 x 轴 y 轴 z 轴信息
一.PhoneGap 加速计 Accelerometer 对象介绍 1.主要方法 accelerometer.getCurrentAcceleration 获取当前设备在 x,y,z 轴上的加速度信息 ...
- Echarts X轴 Y轴 线的类型、颜色、及标签字体颜色 设置
// 人均效能 var initRjxnChart = function () { var rjxnChart = echarts.init(document.getElementById(" ...
- svg 动画 透明度 放大缩小 x轴Y轴
参考链接:https://www.cnblogs.com/Chrimisia/p/6670303.html vue 中封装svg:http://www.cnblogs.com/Jiangchuanwe ...
- 绕X 轴 Y轴 Z轴旋转的结果
void warp_perspect_3_angle(cv::Mat face, float roll, float yaw, float pitch) { cv::Mat face_img = fa ...
- Opencv中图像height width X 轴 Y轴 rows cols之间的对应关系
这里做一个备忘录:
随机推荐
- 【JAVASCRIPT】React入门学习-文本渲染
摘要 react 学习包括几个部分: 文本渲染 JSX 语法 组件化思想 数据流 文本渲染 1. 纯文本渲染 <!DOCTYPE html> <html> <head&g ...
- Android对话框和帧动画
Android对话框 在一个例子中展示四种对话框. 设置四个按钮 <LinearLayout xmlns:android="http://schemas.android.com/apk ...
- 31. leetcode 122. Best Time to Buy and Sell Stock II
122. Best Time to Buy and Sell Stock II Say you have an array for which the ith element is the price ...
- jQuery 去空
//去左右空格; function trim(s){ return s.replace(/(^\s*)|(\s*$)/g, ""); } //去掉字符串中所有空格(包括中间 ...
- 实例甜点 Unreal Engine 4迷你教程(5)之函数中的静态变量
本小节的教程无前置教程,可直接学习,篇幅很短. 本教程浓缩起来就是一句话:函数中的静态变量在调试过程中保留值.所以需要谨慎对待. 什么意思?请先不要一步一步对着做,而整体地看一遍下面的过程: 第一步: ...
- Git版本控制系统之基本使用
最早是通过接触著名的开源社区Github了解到Git的,但一直没有系统学习过.这次下定决心从头到尾系统的学一学,也将学习过程记录于此,供大家批驳.本篇文章先从以下几个方面简单了解一下Git: Git的 ...
- MySQL的MySQL 的JDBC的安装与使用
1.配置好环境,主要是安装mysql和下载连接需要的包(我用的是mysql-connector-java-5.1.3-rc-bin.jar) 2.注册驱动 Class.forName("c ...
- Misra-Gries 算法
2017/8/13 12:51:30 一.算法解决的问题 统计频繁项:统计一个数据流中出现频率最高的 k 的元素. 例如 问:k=3,统计数据流 [1,2,1,4,2,5,6,4] 中的频繁项. 答: ...
- python 导入模块 import 理解
--python 导入模块 import 理解 -----------------------------------2014/03/18 python 导入一个模块的过程要求有一个叫做“路径搜索”的 ...
- SQL 三种基本Join
Join是关系型数据库系统的重要操作之一,SQL常用Join:内联接.外联接和交叉联接等. 这里讨论一下这常用的三种连接. 测试环境:db2 v10.1, linux 表定义: --用户 CREATE ...