VS2015调用matlab Plot函数
最近经常采用Matlab仿真,然后C语言实现,最后需要将计算结果使用Qt的qwt或者matlab中的plot函数绘图。
因此想借用matlab的plot函数接口,使用VS2015来编写信号处理代码,最后通过绘图来验证。
参考博客:
https://blog.csdn.net/shouzang/article/details/80795945
https://blog.csdn.net/libing403/article/details/79135220
非常感谢!
一、VS2015调用Matlab2016a进行绘图
运行环境
Windows 10 64bit
Visual Studio Community 2015/2017
Matlab 2016a
1.1 检查Matlab对C++编译器的支持情况
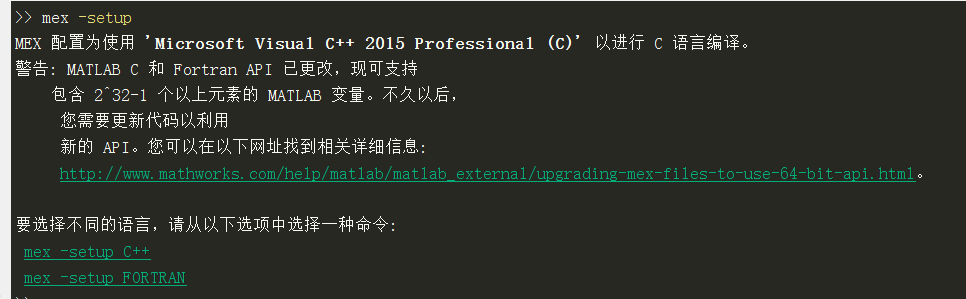
打开Matlab,在命令行中输入
mex -setup
如下图所示,此时Matlab已经可以识别VC++ 2015。
以管理员身份运行命令提示符,切换到"matlab.exe"的路径,输入下方命令进行注册。
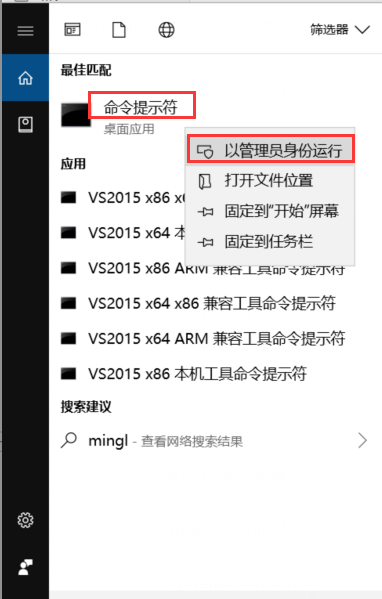

若不注册,在使用engOpen()打开Matlab引擎会提示失败。
二、VS配置及代码示例
测试Demo
#include<cstdlib>

#include <cstdio>

#include<cstring>

#include"engine.h"

const int BUFFER_SIZE = 1024;

char buffer[BUFFER_SIZE];

void test()

{

	Engine* ep;

	mxArray *x1 = NULL;

	mxArray *y1 = NULL;

	if ((ep = engOpen("")) == NULL)

	{

		printf("Engine Fail\n");

	}

	engOutputBuffer(ep, buffer, BUFFER_SIZE);

	printf("Init Success\n");

	double x[5] = { 1.0, 2.5,3.7,4.4,5.1 };

	double y[5] = { 3.3,4.7,9.6,15.6,21.3 };

	x1 = mxCreateDoubleMatrix(1, 5, mxREAL);

	y1 = mxCreateDoubleMatrix(1, 5, mxREAL);

	memcpy((char*)mxGetPr(x1), (void *)x, 5 * sizeof(double));

	memcpy((char*)mxGetPr(y1), (void *)y, 5 * sizeof(double));

	engPutVariable(ep, "x", x1);

	engPutVariable(ep, "y", y1);

	engEvalString(ep, "plot(x,y)");

	getchar();

	engClose(ep);

}

int main()

{

	test();

}
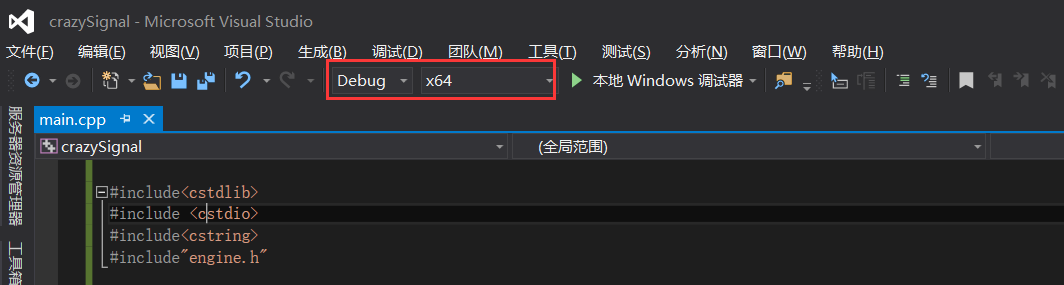
值得注意的是,由于matlab是在64位环境下安装的,对应的库文件也只有64位的,因此我们的vs工程是在X64平台的。
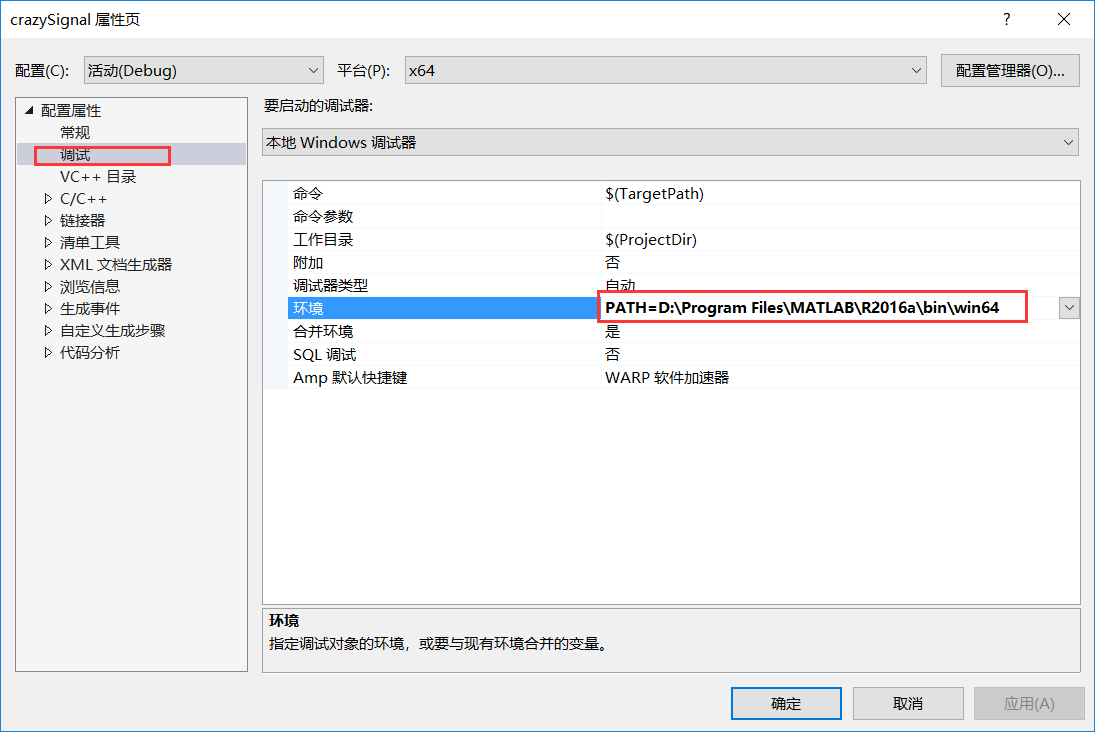
打开工程属性页,在“调试”选项中,添加“PATH=<Matlab安装路径\bin\win64>”,否则会提示找不到dll。 (PATH=D:\Program Files\MATLAB\R2016a\bin\win64)
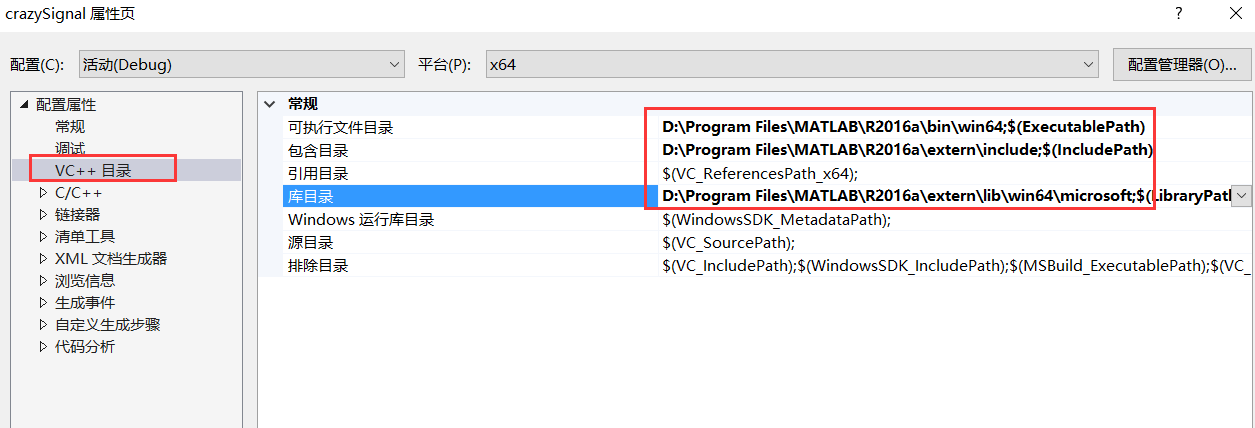
在“VC++目录”中:
“可执行文件目录”中添加“Matlab安装路径\bin\win64”,(D:\Program Files\MATLAB\R2016a\bin\win64)

“包含目录”中添加“Matlab安装路径\extern\include”, (D:\Program Files\MATLAB\R2016a\extern\include)

“库目录”中添加“Matlab安装路径\extern\lib\win64\microsoft” (D:\Program Files\MATLAB\R2016a\extern\lib\win64\microsoft)
如下图所示。
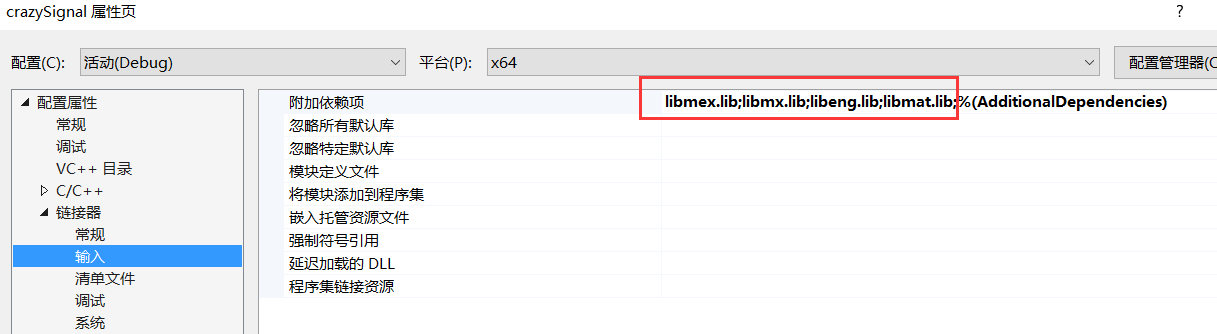
在“链接器”-“输入”中,“附加依赖项”中添加“libmat.lib”,“libeng.lib”,“libmx.lib”,“libmex.lib”,如下图所示。
Demo编译后即可调用Matlab进行画图,如下图所示。
三、引擎讲解
在VS中调用matlab引擎
包含头文件
#include "engine.h"
打开引擎
    Engine* pEng = NULL;

    if (!(pEng = engOpen(NULL)))

    {

        printf("Open matlab enging fail!");

        getchar();

        return -1;

    }
向matlab工作空间设置/获取数据常用的函数
int engPutVariable(Engine *ep, const char *name, const mxArray *pm)
设置一个变量数组的值
mxArray *engGetVariable(Engine *ep, const char *name)获取一个变量

int engEvalString(Engine* ep, const char* string)执行Matlab表达式
关闭引擎
if(pEng)

    engClose(pEng);
正弦波代码示例:
#include<stdio.h>

#include<string.h>

#include<math.h>

#include<engine.h>

#define dataNum 100

int main()

{

    int ret = 0;

    Engine* eg = NULL;

    if (!(eg = engOpen(NULL)))

    {

        printf("Open matlab enging fail!");

        return 1;

    }

    double xtemp[dataNum] = { 0 };

    double ytemp[dataNum] = { 0 };

    for (int i = 0; i < dataNum; i++)

    {

        xtemp[i] = i * 2.0 * 3.1415926 / 100.0;

        ytemp[i] = sin(xtemp[i]);

    }

    mxArray *X = mxCreateDoubleMatrix(1, dataNum, mxREAL);//创建matlab存储数据的指针

    mxArray *Y = mxCreateDoubleMatrix(1, dataNum, mxREAL);

    memcpy(mxGetPr(X), xtemp, dataNum * sizeof(double)); //数据复制

    memcpy(mxGetPr(Y), ytemp, dataNum * sizeof(double));

    if ((ret = engPutVariable(eg, "X", X)) != 0)   //把数据传递到matlab工作空间,并命名为X

        printf("engPutVariable error:%d\n", ret);

    if ((ret = engPutVariable(eg, "Y", Y)) != 0)

        printf("engPutVariable error:%d\n", ret);

    engEvalString(eg, "plot(X,Y)");//运行绘图命令

    getchar();

    if(eg)

        engClose(eg);

    return 0;

}
编写matlab命令封装函数
从上面的编程可以看出,调用matlab进行绘图过程也显得比较繁琐,例如要创建变量,复制内存数据,运行命令表达式等一系列操作。为了像在matlab中一样调用运行matlab命令的体验,可以把matlab的命令封装成c语言的函数。例如,下面是对plot命令的封装:
#include<stdio.h>

#include<string.h>

#include<math.h>

#include<engine.h>

#define dataNum 100

//忽略4096错误

#pragma warning(disable:4996)

int mat_plot(Engine *eg, double *x, double *y, int N, char *LineStyle, double LineWidth, double MarkerSize)

{

	int ret = 0;

	mxArray *X = mxCreateDoubleMatrix(1, N, mxREAL);

	mxArray *Y = mxCreateDoubleMatrix(1, N, mxREAL);

	mxArray *MS = mxCreateDoubleScalar(MarkerSize);

	memcpy(mxGetPr(X), x, N * sizeof(double));

	memcpy(mxGetPr(Y), y, N * sizeof(double));

	if ((ret = engPutVariable(eg, "X", X)) != 0)

		printf("engPutVariable error:%d\n", ret);

	if ((ret = engPutVariable(eg, "Y", Y)) != 0)

		printf("engPutVariable error:%d\n", ret);

	//gennerate the plot command

	char plotCommand[256] = "fig=plot(X,Y,'";

	//set line style and marker

	if (strlen(LineStyle) > 0)

		strncat(plotCommand, LineStyle, strlen(LineStyle));

	else

	{

		strncat(plotCommand, "-", strlen("-"));

	}

	strncat(plotCommand, "',", strlen(LineStyle));

	char temp[20] = "";

	//set line width

	if (LineWidth < 1.0)

		LineWidth = 1.0;

	strncat(plotCommand, "'LineWidth',", strlen("'LineWidth',"));

	memset(temp, 0, sizeof(temp));

	sprintf(temp, "%f,", LineWidth);

	strncat(plotCommand, temp, strlen(temp));

	//set marker size

	strncat(plotCommand, "'MarkerSize',", strlen("'MarkerSize',"));

	sprintf(temp, "%f", MarkerSize);

	strncat(plotCommand, temp, strlen(temp));

	strncat(plotCommand, ");", strlen(temp));

	//plot

	if ((ret = engEvalString(eg, plotCommand)) != 0)

	{

		printf("\nplot Command error:%s\n", plotCommand);

		return ret;

	}

	engEvalString(eg, "set(gcf,'color','w');");

	printf("plot Command ok:%s\n", plotCommand);

	//destroy mxArray,but they are still in matlab workspace

	mxDestroyArray(X);

	mxDestroyArray(Y);

	return 0;

}

int main()

{

	Engine* eg = NULL;

	if (!(eg = engOpen(NULL)))

	{

		printf("Open matlab enging fail!");

		return 1;

	}

	int ret = 0;

	double xtemp[dataNum] = { 0 };

	double ytemp[dataNum] = { 0 };

	for (int i = 0; i < dataNum; i++)

	{

		xtemp[i] = i * 2.0 * 3.1415926 / 100.0;

		ytemp[i] = sin(xtemp[i]);

	}

	mat_plot(eg, xtemp, ytemp, dataNum, "-r", 1, 5);

	getchar();

	if (eg)

		engClose(eg);

	return 0;

}
这样使用起matlab命令就方便多了,例如我要用c语言里运算的数据来画图,直接调用封装的函数就可以了
mat_plot(eg, xtemp, ytemp, dataNum, "-r", 1, 5);
上面参数含义
eg:指向打开的matlab引擎指针
xtemp:x坐标数据
ytemp:y轴坐标数据
dataNum:数据个数
“-r”:线型,颜色(还可以设置标记例如“–r*”)
1:线宽
5:标记大小
这样就不用关心数据是怎样传递数据到matlab和怎样运行画图命令的。封装函数写得好些,就可以像matlab里面使用更像,例如直接设置线型,线宽。
四、小结
以前对c算法进行测试时,需要把c产生的数据导数到matlab,再进行绘图,看效果。这样既要写c语言程序,还得专门写matlab程序进行测试,而且要绘制动态图形就特别麻烦。现在这样通过直接在c/c++调用matlab引擎进行数据可视化处理,可以在C语言环境里,调用matlab几乎所有命令。要是把matlab命令封装好,就跟在matlab里画图一样方便,可以极大提高开发效率。
VS2015调用matlab Plot函数的更多相关文章
- IIR滤波器设计(调用MATLAB IIR函数来实现)
转载请注明文章来源 – http://blog.csdn.net/v_hyx ,请勿用于任何商业用途 对于滤波器设计,以前虽然学过相关的理论(现代数字信号处理和DSP设计),但一直不求 ...
- MyEclipse调用Matlab打包函数
本文部分内容参考了http://www.360doc.com/content/15/1103/16/1180274_510463048.shtml 一.检查Java环境 对于已经装上JAVA环境的计算 ...
- MATLAB plot函数的一些参数
直接从帮助文档中抓图,注意是颜色.线型什么的.
- (转)JAVA 调用matlab
本文仅用于学习. 原文地址链接:http://blog.csdn.net/wannshan/article/details/5907877 前段时间摸索了java调用matlab东西,不说学的有多深, ...
- C++调用matlab编程
C++调用Matlab,实在是不得已的方法.原文链接: http://kylen314.blog.com/2012/12/11/matlab_for_cplusplus/ 这是个很善良的博客,只出现 ...
- matlab画图函数plot()/set/legend
简单plot()/legend/XY轴范围axis 除了坐标轴信息外还可以添加其它的信息,如所画曲线的信息等:测试代码如下 x=0:pi/20:2*pi; y1=sin(x); y2=cos(x); ...
- 【原创】Matlab.NET混合编程技巧之直接调用Matlab内置函数
本博客所有文章分类的总目录:[总目录]本博客博文总目录-实时更新 Matlab和C#混合编程文章目录 :[目录]Matlab和C#混合编程文章目录 在我的上一篇文章[ ...
- java调用matlab函数
如何将实验结果在matlab中可视化呢,下面使用java语言编程,调用matlab中的函数: 本人安装的是Matlab7.11.0 (R2010a)和 Eclipse 4.2 : 1)首先设置环境变量 ...
- Matlab中plot函数参数解析
功能 二维曲线绘图 语法 plot(Y) plot(X1,Y1,...) plot(X1,Y1,LineSpec,...) plot(...,'PropertyName',PropertyValue, ...
随机推荐
- 虚拟机环境下DPDK运行时的一些错误解决
在绑定网卡到DPDK模块时 报错 :is active. Not modifying Routing table indicates that interface 0000:02:01.0 is ac ...
- 二路归并排序java实现
二路归并排序:其核心思想时将问题一分为二,并递归调用一分为二方法,使问题分割到不能再分各的原子问题,然后再归并,从实现原子问题开始,层层向上归并,最终解决整体问题.即所谓“分而治之,万流归一” 二路归 ...
- 封装GetQueryString()方法来获取URL的value值(转载)
首先测试URL:http://192.168.1.82:8020/juzhong/daojishi.html?name=xiangruding&sex=nuuu&age=90 代码如下 ...
- 1014 C语言文法定义与C程序的推导过程
<程序> -> <外部声明> | <程序> <外部声明> <外部声明> -> <函数定义> | <声明> ...
- linux安全配置学习
参考摘自https://www.cnblogs.com/hiccup/p/4300963.html 1.关闭icmp请求 #vm虚拟机是130地址,通过echo 1 > /proc/sys/ne ...
- 获取字符串中某个指定的子串出现的开始位置(CHARINDEX用法)
CHARINDEX作用 写SQL语句我们经常需要判断一个字符串中是否包含另一个字符串,但是SQL SERVER中并没有像C#提供了Contains函数,不过SQL SERVER中提供了一个叫CHAEI ...
- mysqldumpslow 分析slow query日志和explain分析mysql查询结构
mysqldumpslow的使用:比如我们要查询按时间返回前5条日志信息,格式如下:mysqldumpslow -s t -t 5 /var/log/mysql/slowquery_20180303. ...
- [cnbeta] 波音系列飞机价格。。。
https://www.cnbeta.com/articles/tech/786745.htm 单价最便宜的是波音737-700,为0.858亿美元(约合5.96亿元). 评论网友调侃,“你家能满40 ...
- 第214天:Angular 基础概念
一.Angular 简介 1. 什么是 AngularJS - 一款非常优秀的前端高级 JS 框架 - 最早由 Misko Hevery 等人创建 - 2009 年被 Google 公式收购,用于其多 ...
- Nim游戏学习笔记