Monitoring tools that everyone's currently using
Although a lot of new tools have arrived since 2011, it's clear that older open source tools like Nagios, and Nagios alternatives like Zabbix and Icinga, still dominate the market, with 70% of the companies we spoke to still using these tools for their core monitoring & alerting.
Around 70% of the companies used more than one monitoring tool, with most using an average of two. Nagios/Graphite configurations were most common, with many also using New Relic. However, only two of the companies we spoke to actually paid for New Relic, with most of the companies using the free version as they found the paid version too expensive.
In the "other" category, there were a lot of different tools with no particular one standing out. Types of tools that fell into this category were SaaS monitoring tools such as Librato & Datadog, used by several smaller start-ups, or many older open source tools like Cacti or Munin. Some AWS users rely on CloudWatch, and there were even a few custom built solutions.

Graph 1: Percentage of companies with monitoring tools deployed.
If we look at tool usage versus the number of servers the companies manage (< 20 being new startup services, and all the way to > 1000 servers for the large online services), you can see that the proportion of older open source tools like Nagios, or paid on-premise tools goes up as the service gets larger, whereas the smaller, newer services are more likely to use developer focused tools like Graphite, LogStash and New Relic.
This makes sense, as many of the larger services are older (> 5 years old) so have legacy monitoring infrastructure, and also have the resources to hire a dedicated operations team who tend to bring in the tools their most familiar with, namely Nagios or Nagios alternatives. They also have more money to pay for monitoring tools like Splunk (which everyone would love to have if they could afford it) or AppDynamics.
The newer smaller services tend not to have any DevOps/Operations people in their company, so developers tend to use simpler-to-install SaaS monitoring tools, or tools that help them such as Graphite or LogStash. There seems to be a tipping point between 50-100 servers when the company has the resources to bring in a DevOps/Operations person or team and they start bringing in the infrastructure monitoring tools like Nagios to provide the coverage they need.
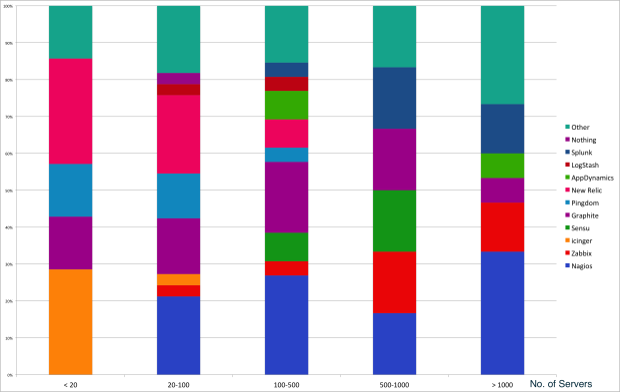
Graph 2: Tool Usage vs. Number of Servers Managed
Key Trends:
1. Many people found the newer services lacked the flexibility of open source solutions with their ability to customize them to their requirements, and didn't like the idea of learning a proprietary system with its own plugin design and features. So they built their own "kit car".
2. While the services became larger, the trend was the move towards microservices, with different cross-functional development teams building, deploying and supporting their own parts of the service.
3. There are some simpler things that can be done to reduce spammy alerts with potential of predictive & more intelligent alerting using machine learning.
[excerpt from Outlyer]
Monitoring tools that everyone's currently using的更多相关文章
- PostgreSQL Performance Monitoring Tools
PostgreSQL Performance Monitoring Tools https://github.com/CloudServer/postgresql-perf-tools This pa ...
- 4. Traffic monitoring tools (流量监控工具 10个)
4. Traffic monitoring tools (流量监控工具 10个)EttercapNtop SolarWinds已经创建并销售了针对系统管理员的数十种专用工具. 安全相关工具包括许多网络 ...
- Top 10 Free Wireless Network hacking/monitoring tools for ethical hackers and businesses
There are lots of free tools available online to get easy access to the WiFi networks intended to he ...
- Top 12 Best Free Network Monitoring Tools (12种免费网络监控工具)
1) Fiddler Fiddler(几乎)是适用于任何平台和任何操作系统的最好的免费网络工具,并提供了一些广受欢迎的关键特性.如:性能测试.捕捉记录HTTP/HTTPs请求响应.进行web调试等很多 ...
- Java Monitoring&Troubleshooting Tools
JDK Tools and Utilities Monitoring Tools You can use the following tools to monitor JVM performance ...
- troubleshooting tools in JDK 7--转载
This chapter describes in detail the troubleshooting tools that are available in JDK 7. In addition, ...
- Java Performance Optimization Tools and Techniques for Turbocharged Apps--reference
Java Performance Optimization by: Pierre-Hugues Charbonneau reference:http://refcardz.dzone.com/refc ...
- Flink监控:Monitoring Apache Flink Applications
This post originally appeared on the Apache Flink blog. It was reproduced here under the Apache Lice ...
- MySQL Performance Tuning: Tips, Scripts and Tools
With MySQL, common configuration mistakes can cause serious performance problems. In fact, if you mi ...
随机推荐
- hibernate集合的加载策略
在集合方配置lazy和fetch的方式,默认的是lazy为true,fetch为select,lazy有true,extra和false,true和extra都是懒加载,只是extra比true更懒, ...
- Google Chrome 未响应。是否立即重新启动?
不当的退出会造成 Google Chrome 无法启动.出现“Google Chrome 未响应.是否立即重新启动?”的错误.要解决这个问题: 1.同时按住Windows旗帜键 + R键,调 ...
- HDU 2480 Steal the Treasure (并查集+贪心)
题意:给你n个点,m条边,包括有向边与无向边,每条边都有一个权值.在每个点上都有一个人,他可以走与这个点直接相连的所有边中任意一条边一次,并且得到这个权值,就不能走了,注意这条路也只能被一个人走.问最 ...
- 用外部物理路由器时使用Neutron dhcp-agent提供的metadata服务(by quqi99)
作者:张华 发表于:2015-12-29版权声明:可以任意转载,转载时请务必以超链接形式标明文章原始出处和作者信息及本版权声明 ( http://blog.csdn.net/quqi99 ) 环境搭 ...
- Windows Live Writer加载代码着色插件步骤
博客园内置支持SyntaxHighlighter代码着色,代码着色语法:<pre class='brush:编程语言'>代码</pre>. 需要注意的是:如何你使用Syntax ...
- java编程将命令行参数转化为整数并实现求和的功能。
- CSS高度自适应 height:100%;
在初次尝试高度自适应时都会遇到这样的问题: 对象的heith:100%; 并不能直接产生实际效果 为什么呢?之所以没有效果,与浏览器的解析方式有一定关系,查看下面代码 <!DOCTYPE htm ...
- iostat相关参数说明——await:平均每次设备I/O操作的等待时间 (毫秒),如果%util接近 100%,说明产生的I/O请求太多
iostat是I/O statistics(输入/输出统计)的缩写,iostat工具将对系统的磁盘操作活动进行监视.它的特点是汇报磁盘活动统计情况,同时也会汇报出 CPU使用情况.同vmstat一样, ...
- hadoop2.5.2 安装与部署
主从机构 主:jobtracker 从:tasktracker 四个阶段 1. split 2. Mapper: key-value(对象) 3. shuffle a) 分区(partition,H ...
- JDK自动安装脚本
A:本脚本运行的机器,Linux B:待安装JDK的机器, Linux 首先在脚本运行的机器A上确定可以ssh无密码登录到待安装jdk的机器B上,然后就可以在A上运行本脚本: 代码如下: $ ./in ...