prometheus部署
1.prometheus安装
软件下载:
wget https://dl.grafana.com/oss/release/grafana-6.4.2-1.x86_64.rpm
https://github.com/prometheus/prometheus/releases/download/v2.13.0/prometheus-2.13.0.linux-amd64.tar.gz
wget https://golang.org/doc/install?download=go1.13.1.linux-amd64.tar.gz
说明:虚拟机Centos7 环境下进行安装.
1.1环境装备
配置golang的环境

wget https://golang.org/doc/install?download=go1.13.1.linux-amd64.tar.gz

tar -C /usr/local/ -xvf    go1.13.1.linux-amd64.tar.gz

添加到环境变量中

vim /etc/profile

export PATH=$PATH:/usr/local/go/bin

重载环境变量

source /etc/profile

查看版本

go   version
1.2安装Prometheus
tar -C /usr/local/ -xvf   prometheus-2.13.0.linux-amd64.tar.gz

ln -sv /usr/local/prometheus-2.13.0.linux-amd64/   /usr/local/prometheus

启动:

/usr/local/prometheus/prometheus  --storage.tsdb.path=/data/     --config.file=/usr/local/prometheus/prometheus.yml

暂时关闭防火墙

systemctl stop firewalld.service

登录:http://192.168.31.91:9090
1.3安装Grafana
rpm -ivh --nodeps grafana-6.4.2-1.x86_64.rpm

启动:

systemctl daemon-reload

systemctl enable grafana-server.service

systemctl start grafana-server.service

登录:http://192.168.31.91:3000/login  初始密码:admin admin

安装饼图插件:

grafana-cli plugins install grafana-piechart-panel
注意Grafana 密码重置
yum的安装方式,源码安装方式找到grafana.db文件
sqlite3 /var/lib/grafana/grafana.db
update user set password = '59acf18b94d7eb0694c61e60ce44c110c7a683ac6a8f09580d626f90f4a242000746579358d77dd9e570e83fa24faa88a8a6', salt = 'F3FAxVm33R' where login = 'admin';
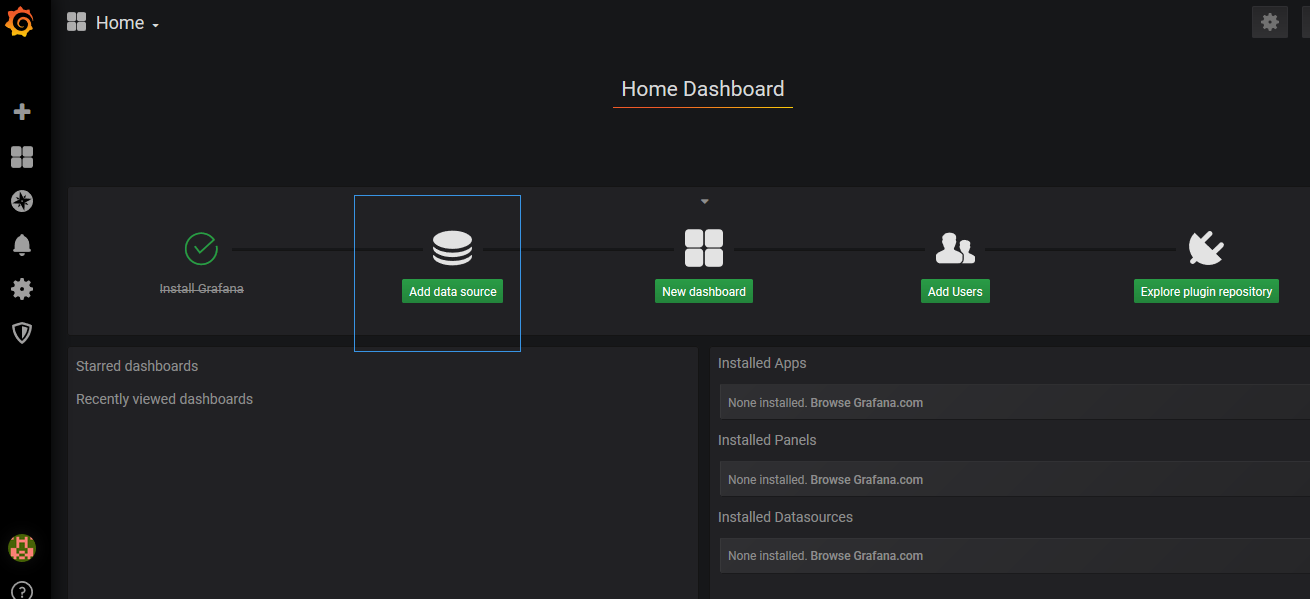
1.4.配置Grafana
添加prometheus数据源
点击主界面的“Add data source”
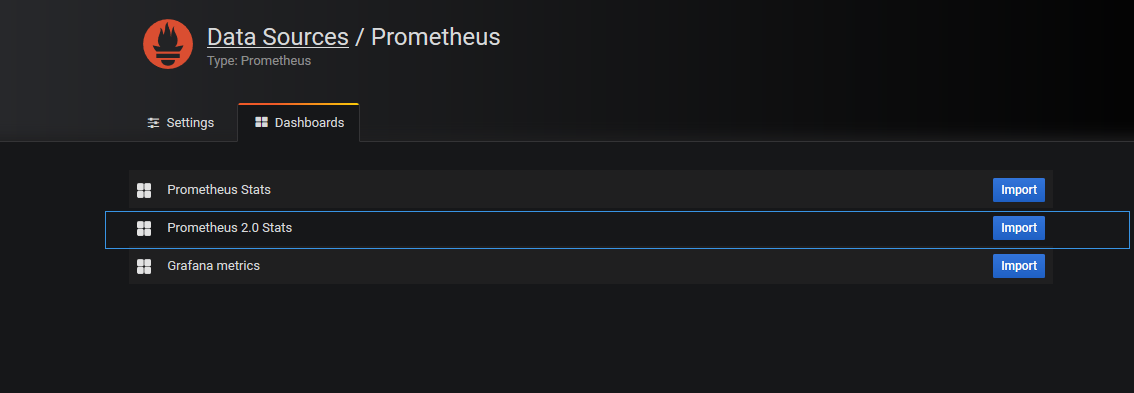
Dashboards页面选择“Prometheus 2.0 Stats”
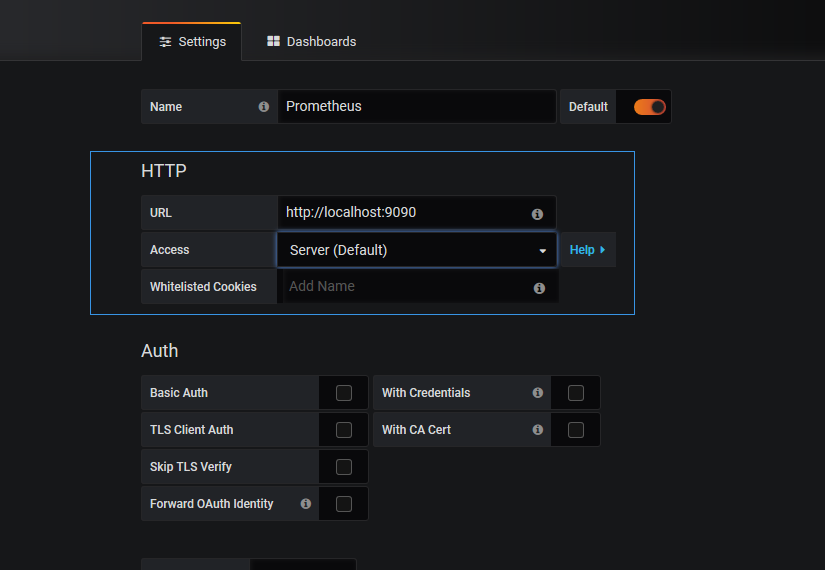
Settings页面填写普罗米修斯地址并保存
如果需要告警的配置需要下载alertmanager
Prometheus的告警机制是server推送告警到alertmanger,配置告警规则和告警方式
插件下载地址https://github.com/prometheus/alertmanager/releases/download/v0.19.0/alertmanager-0.19.0.linux-amd64.tar.gz
具体架构图如下:

如果在prometheus的http://localhost:9090/管理界面没有数据同时又
No datapoints found报错显示
解决方案:一定要修改服务器的时间
prometheus部署的更多相关文章
- k8s全方位监控-prometheus部署
1.k8s 监控资源对象 2. prometheus简单介绍. https://github.com/prometheus •多维数据模型:由度量名称和键值对标识的时间序列数据•PromSQL:一种灵 ...
- Prometheus部署各服务的Node监控
1.部署监控主机 部署主机监控,需要安装node_exporter 1.1 下载node exporter wget https://github.com/prometheus/node_export ...
- prometheus部署安装
1. 下载&部署 # 下载 [root@prometheus src]# cd /usr/local/src/ [root@prometheus src]# wget https://gith ...
- Kubernetes实战总结 - Prometheus部署
什么是普罗米修斯? Prometheus是最初在SoundCloud上构建的开源系统监视和警报工具包 . 自2012年成立以来,许多公司和组织都采用了Prometheus,该项目拥有非常活跃的开发人员 ...
- Prometheus部署监控容器
Prometheus架构描述 Prometheus 是一个非常优秀的监控工具.准确的说,应该是监控方案.Prometheus 提供了监控数据搜集.存储.处理.可视化和告警一套完整的解决方案 Prome ...
- Prometheus学习笔记(2)Prometheus部署
目录 Prometheus的安装配置启动 Prometheus的安装配置启动 1.Prometheus二进制安装 Prometheus下载链接:https://prometheus.io/downlo ...
- Prometheus 和 Grafana 安装部署
Prometheus 是一套开源的系统监控报警框架.Prometheus 作为生态圈 Cloud Native Computing Foundation(简称:CNCF)中的重要一员,其活跃度仅次于 ...
- prometheus + grafana安装部署(centos6.8)
官方网址:https://prometheus.io/ GitHub网址:https://github.com/prometheus/prometheus 软件下载地址:https://prometh ...
- Prometheus+Grafana监控部署实践
参考文档: Prometheus github:https://github.com/prometheus grafana github:https://github.com/grafana/graf ...
随机推荐
- Docker 安装 Tomcat
查找Docker Hub上的tomcat镜像 docker search tomcat 取官方的镜像 docker pull tomcat 使用tomcat镜像 创建目录tomcat,用于存放后面的相 ...
- spring cloud微服务docker启动
1. 背景 将系统拆分成微服务,一个系统可能拆分成十几个服务,服务太多会影响发布和管理,所以容器话之后易于管理和版本发布,鉴于此将spring cloud微服无docker容器化. 2.依赖环境 Ce ...
- [转载]ASP.NET Core文件上传与下载(多种上传方式)
ASP.NET Core文件上传与下载(多种上传方式) 前言 前段时间项目上线,实在太忙,最近终于开始可以研究研究ASP.NET Core了. 打算写个系列,但是还没想好目录,今天先来一篇,后面在 ...
- (七)Spring 配置 c3p0 连接池
目录 在 Spring 核心配置文件中配置 c3p0 连接池 配置 JdbcTemplate 对象 在 service 层注入 userDao 在 UserDao 里面注入 JdbcTemplate ...
- celery(芹菜) 异步任务 定时任务 周期任务
什么是celery Celery是一个简单.灵活且可靠的,处理大量消息的分布式系统 专注于实时处理的异步任务队列 同时也支持任务调度 celery架构 celery的架构由三部分组成,消息中间件(me ...
- python保留字及其说明
保留字 说 明 and 用于表达式运算,逻辑与操作 as 用于类型转换 assert 断言,用于判断变量或条件表达式的值是否为真 break 中断循环语句的执行 class 用于定义类 con ...
- Go语言注意事项
必须恰当导入需要的包,缺少了必要的包或者导入了不需要的包,程序都无法编译通过.这项严格要求避免了程序开发过程中引入未使用的包(译注:Go语言编译过程没有警告信息,争议特性之一 import 声明必须跟 ...
- S02_CH08_ ZYNQ 定时器中断实验
S02_CH08_ ZYNQ 定时器中断实验 上一章实现了PS接受来自PL的中断,本章将在ZYNQ的纯PS里实现私有定时器中断.每隔一秒中断一次,在中断函数里计数加1,通过串口打印输出. 8.1中断原 ...
- 牛客 197C 期望操作数
大意: 给定$x,q$, 每步操作$x$等概率变为$[x,q]$中任意一个数, 求变为$q$的期望操作数. 很容易可以得到$f(x,q)=\frac{\sum\limits_{i=x+1}^qf(i, ...
- hdu 6077多校签到
#include <iostream> #include <cstdio> using namespace std; ][]; int f(int pos) { ; ;i< ...