Grafan+Prometheus 监控 MySQL
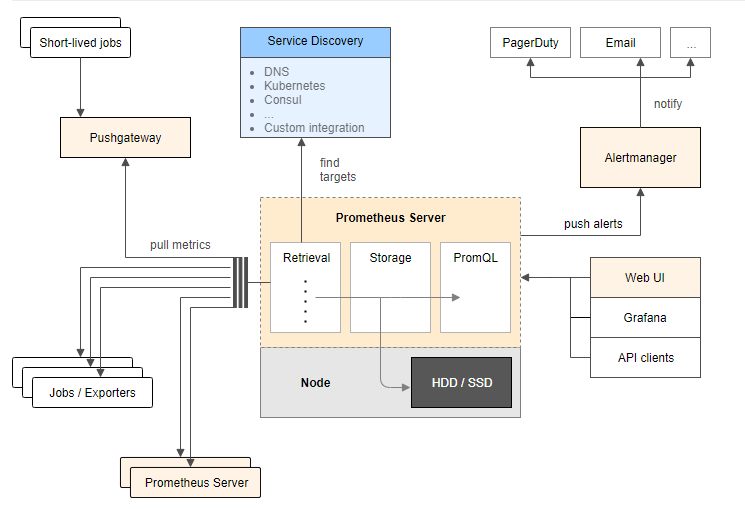
架构图
环境
| IP | 环境 | 需装软件 |
|---|---|---|
| 192.168.0.237 | mysql-5.7.20 | node_exporter-0.15.2.linux-amd64.tar.gz mysqld_exporter-0.10.0.linux-amd64.tar.gz |
| 192.168.0.248 | grafana+prometheus | prometheus-2.1.0.linux-amd64.tar.gz node_exporter-0.15.2.linux-amd64.tar.gz grafana-4.6.3.linux-x64.tar.gz |
在 192.168.0.248 上安装 grafana prometheus
安装 prometheus
# 创建保存软件的目录

mkdir /data/software/ -p

cd /data/software/

# 解压 prometheus

tar xvf prometheus-2.1.0.linux-amd64.tar.gz -C /iba/

cd /iba/

mv prometheus-2.1.0.linux-amd64 prometheus

cd prometheus/

cp prometheus.yml /tmp/prometheus.yml.20181203

# 配置 prometheus.yml

cat prometheus.yml

# my global config

global:

  scrape_interval:    15s # Set the scrape interval to every 15 seconds. Default is every 1 minute.

  evaluation_interval: 15s # Evaluate rules every 15 seconds. The default is every 1 minute.

  # scrape_timeout is set to the global default (10s).

# A scrape configuration containing exactly one endpoint to scrape:

# Here it's Prometheus itself.

scrape_configs:

- job_name: 'Host'

  file_sd_configs:

  - files:

    - host.yml

  metrics_path: /metrics

  relabel_configs:

  - source_labels: [__address__]

    regex: (.*)

    target_label: instance

    replacement: $1

  - source_labels: [__address__]

    regex: (.*)

    target_label: __address__

    replacement: $1:9100

- job_name: 'MySQL'

  file_sd_configs:

  - files:

    - mysql.yml

  metrics_path: /metrics

  relabel_configs:

  - source_labels: [__address__]

    regex: (.*)

    target_label: instance

    replacement: $1

  - source_labels: [__address__]

    regex: (.*)

    target_label: __address__

    replacement: $1:9104

- job_name: 'prometheus'

  static_configs:

  - targets:

    - localhost:9090

cat host.yml

- labels:

    service: test

  targets:

  - 192.168.0.248

  - 192.168.0.237

cat mysql.yml

- labels:

    service: test

  targets:

  - 192.168.0.237

# 测试 prometheus 是否可以正常启动

/iba/prometheus/prometheus --storage.tsdb.retention=30d &

ps -ef|grep prometh

kill -9 14650

# 配置 prometheus.service 文件

vi /usr/lib/systemd/system/prometheus.service

# 内容为

[Unit]

Description=Prometheus instance

Wants=network-online.target

After=network-online.target

[Service]

User=root

Group=root

Type=simple

Restart=on-failure

WorkingDirectory=/iba/prometheus/

RuntimeDirectory=prometheus

RuntimeDirectoryMode=0750

ExecStart=/iba/prometheus/prometheus  --storage.tsdb.retention=30d --config.file=/iba/prometheus/prometheus.yml

LimitNOFILE=10000

TimeoutStopSec=20

[Install]

WantedBy=multi-user.target

# 启动 prometheus

systemctl start prometheus

systemctl status prometheus -l

# 开放防火墙

firewall-cmd --permanent --add-rich-rule="rule family="ipv4" source address="192.168.0.0/16" accept"

firewall-cmd --reload
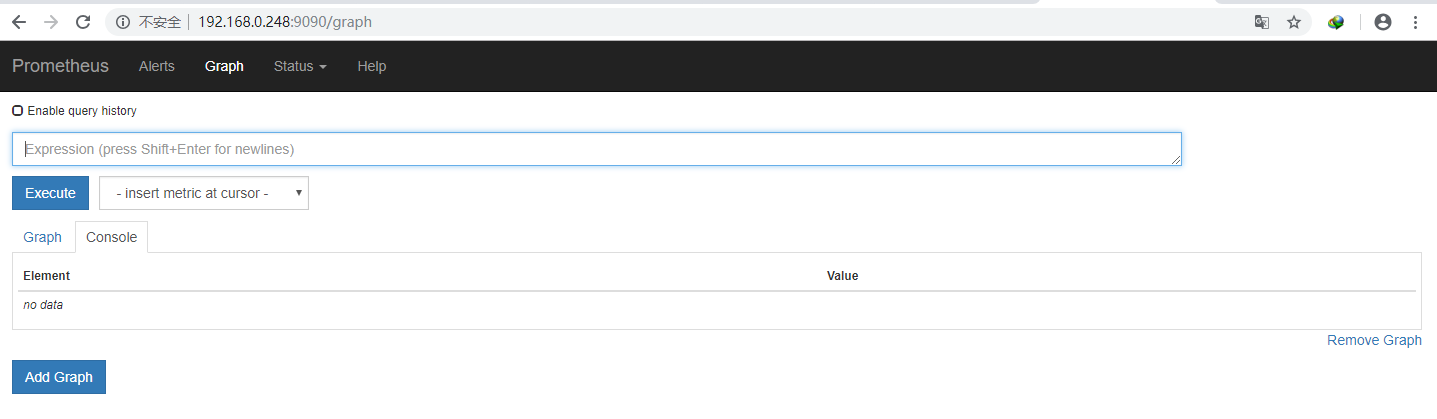
浏览器输入 http://192.168.0.248:9090 访问
prometheus.yml 文件参考:
https://prometheus.io/docs/prometheus/latest/configuration/configuration/
https://prometheus.io/docs/prometheus/latest/configuration/configuration/#<relabel_config>
https://prometheus.io/docs/prometheus/latest/configuration/configuration/#<file_sd_config>
安装 node_exporter 获取主机信息
# 解压 node_exporter

cd /data/software/

tar xf node_exporter-0.15.2.linux-amd64.tar.gz -C /usr/local

mv node_exporter-0.15.2.linux-amd64 node_exporter

nohup ./node_exporter &
安装 grafana
cd /iba/software

# 解压

tar xf grafana-4.6.3.linux-x64.tar.gz -C /iba/prometheus/

cd /iba/prometheus/

mv grafana-4.6.3 grafana

cd grafana/

# 测试

./bin/grafana-server

# 停止

ctrl+c

cat /usr/lib/systemd/system/grafana-server.service

[Unit]

Description=Grafana instance

Documentation=http://docs.grafana.org

Wants=network-online.target

After=network-online.target

[Service]

User=root

Group=root

Type=simple

Restart=on-failure

WorkingDirectory=/iba/prometheus/grafana

RuntimeDirectory=grafana

RuntimeDirectoryMode=0750

ExecStart=/iba/prometheus/grafana/bin/grafana-server

LimitNOFILE=10000

TimeoutStopSec=20

[Install]

WantedBy=multi-user.target

# 启动

systemctl start grafana-server

systemctl status grafana-server -l
访问 http://192.168.0.248:3000,默认用户和密码是 admin/admin

配置数据源


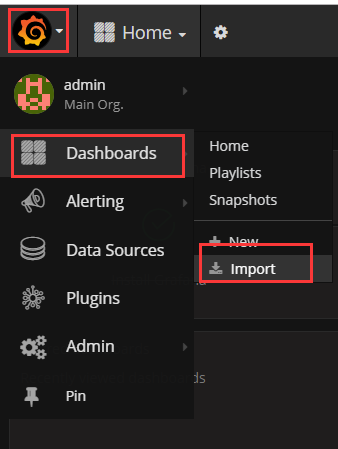
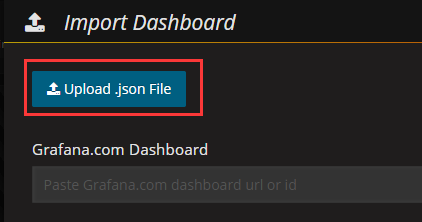
下载 grafana-dashboards-1.6.1.tar.gz,解压,使用浏览器导入 dashboard, 下载地址:https://github.com/percona/grafana-dashboards/archive/v1.6.1.tar.gz

在 192.168.0.237 安装 node_exporter 和 mysqld_exporter
cd /iba/software/

tar zxf node_exporter-0.15.2.linux-amd64.tar.gz -C /usr/local/

cd /usr/local/

mv node_exporter-0.15.2.linux-amd64 node_exporter

# 启动

cd node_exporter/

nohup ./node_exporter &
几分钟后 grafana 出现了新服务器的信息

在mysql上配置监控使用的用户
GRANT REPLICATION CLIENT, PROCESS, SELECT ON *.* TO 'mysql_monitor'@'%' IDENTIFIED BY 'mysql_monitor';

FLUSH PRIVILEGES;
cd /iba/software/

tar zxf mysqld_exporter-0.10.0.linux-amd64.tar.gz -C /usr/local/

cd /usr/local/

mv mysqld_exporter-0.10.0.linux-amd64/ mysqld_exporter

cd mysqld_exporter/

# 在 mysql 上创建一个专门用于监控的用户,

cat .my.cnf

[client]

user=mysql_monitor

password=mysql_monitor

# 启动

nohup /usr/local/mysqld_exporter/mysqld_exporter  -config.my-cnf="/usr/local/mysqld_exporter/.my.cnf" &
导入 dashboard: MySQL_Overview.json

Grafan+Prometheus 监控 MySQL的更多相关文章
- Grafana+Prometheus 监控 MySQL
转自:Grafana+Prometheus 监控 MySQL 架构图 环境 IP 环境 需装软件 192.168.0.237 mysql-5.7.20 node_exporter-0.15.2.lin ...
- Prometheus 监控Mysql服务器及Grafana可视化
Prometheus 监控Mysql服务器及Grafana可视化. mysql_exporter:用于收集MySQL性能信息. 使用版本 mysqld_exporter 0.11.0 官方地址 使用文 ...
- 使用 Docker 部署 Grafana + Prometheus 监控 MySQL 数据库
一.背景 在平时开发过程当中需要针对 MySQL 数据库进行监控,这里我们可以使用 Grafana 和 Prometheus 来实现监控功能.Grafana 是一款功能强大的仪表盘面板,支持多种数据源 ...
- 采用prometheus 监控mysql
1. prometheus 是什么 开源的系统监控和报警工具,监控项目的流量.内存量.负载量等实时数据. 它通过直接或短时jobs中介收集监控数据,在本地存储所有收集到的数据,并且通过定义好的rule ...
- Grafana+Prometheus监控mysql性能
#cmd /usr/local 今天讲一下如何监控服务器中的mysql数据库的性能 一.数据库操作 1.mysql启动 #service mysqld start #启动数据库 #service my ...
- Prometheus 监控MySQL
目录 0.简介 1.mysql_exporter部署 2.mysql报警规则 0.简介 文中主要监控MySQL/MySQL主从信息 版本:mysql-5.7,mysql_exporter-0.12.1 ...
- 手把手教你使用 Prometheus 监控 MySQL 与 MariaDB.md
概述 MySQL 是常用的关系型数据库,MariaDB 作为 MySQL 的分支版本,兼容 MySQL 协议,也越来越流行.在 Kubernetes 环境中如何使用 Prometheus 来对它们进行 ...
- prometheus监控mysql
创建一个用于mysqld_exporter连接到MySQL的用户并赋予所需的权限 mysql> GRANT REPLICATION CLIENT, PROCESS ON *.* TO '; my ...
- 使用Prometheus监控SpringBoot应用
通过之前的文章我们使用Prometheus监控了应用服务器node_exporter,数据库mysqld_exporter,今天我们来监控一下你的应用.(本文以SpringBoot 2.1.9.REL ...
随机推荐
- 第86节:Java中的JQuery基础
第86节:Java中的JQuery 前言复习 定时器: setInterval clearInterval setTimeout clearTimeout 显示: img.style.display ...
- centos6安装cas5
cas是Central Authentication Service的缩写,中文为中央认证服务,在这里我就不说理论了,在公司里项目研发需要cas平台,所以经过两天研究,搞了一个简化版的cas服务,有不 ...
- Ansible工具原理一
ansible是新出现的自动化运维工具,基于Python开发,集合了众多运维工具(puppet.cfengine.chef.func.fabric)的优点,实现了批量系统配置.批量程序部署.批量运行命 ...
- 利用node 剥取其他网站的文档数据结构 ---
1.如何利用nodejs获取其他网站的文档结构呢 以下是代码演示------! //首先需要引入一些核心模块 var http = require('http'); var fs = require( ...
- 排除Transformation Errors
当运行session时,会产生大量的Transformation Errors,这些Error会导致性能变慢 1 Transformation Errors导致性能降低的原因 当有大量记录有Trans ...
- Mac-Navicat Premium For Mac 12 破解 - [数据库可视化工具,亲测完美破解]
一.下面的公钥和私钥暂时存到文本编辑器中 公钥: -----BEGIN PUBLIC KEY-----MIIBITANBgkqhkiG9w0BAQEFAAOCAQ4AMIIBCQKCAQB8vXG0I ...
- python高级-异常(13)
一.异常介绍 print("1---------------------") open("123.txt","r") print(" ...
- Docker学习之3——容器
容器(Container) 容器介绍: docker是通过容器来运行业务的,就像运行一个kvm虚拟机是一样的.容器其实就是从镜像创建的一个实例. 我们可以对容器进行增删改查,容器之间也是相互隔离的.和 ...
- RestyCircuitBreaker --- openresty断路器
简介 由于某些场景下服务提供方和调用方都无法做到可用性,当系统远程调用时,可能会因为某些接口变慢导致调用方大量HTTP连接被阻塞而引发雪崩. 解决思路如下: 服务提供方实现接口快速失败,当处理时间达到 ...
- JAVA UUID 生成唯一标识
Writer:BYSocket(泥沙砖瓦浆木匠) 微博:BYSocket 豆瓣:BYSocket Reprint it anywhere u want 需求 项目在设计表的时候,要处理并发多的一些数据 ...