Grafan+Prometheus 监控 MySQL
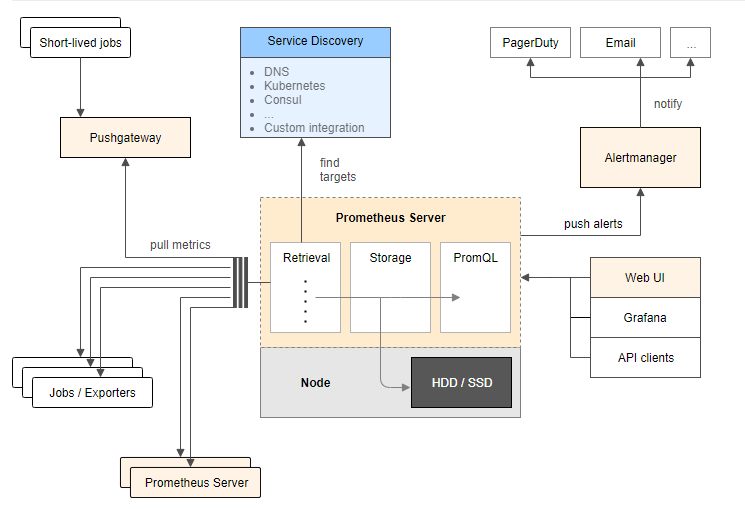
架构图
环境
| IP | 环境 | 需装软件 |
|---|---|---|
| 192.168.0.237 | mysql-5.7.20 | node_exporter-0.15.2.linux-amd64.tar.gz mysqld_exporter-0.10.0.linux-amd64.tar.gz |
| 192.168.0.248 | grafana+prometheus | prometheus-2.1.0.linux-amd64.tar.gz node_exporter-0.15.2.linux-amd64.tar.gz grafana-4.6.3.linux-x64.tar.gz |
在 192.168.0.248 上安装 grafana prometheus
安装 prometheus
# 创建保存软件的目录

mkdir /data/software/ -p

cd /data/software/

# 解压 prometheus

tar xvf prometheus-2.1.0.linux-amd64.tar.gz -C /iba/

cd /iba/

mv prometheus-2.1.0.linux-amd64 prometheus

cd prometheus/

cp prometheus.yml /tmp/prometheus.yml.20181203

# 配置 prometheus.yml

cat prometheus.yml

# my global config

global:

  scrape_interval:    15s # Set the scrape interval to every 15 seconds. Default is every 1 minute.

  evaluation_interval: 15s # Evaluate rules every 15 seconds. The default is every 1 minute.

  # scrape_timeout is set to the global default (10s).

# A scrape configuration containing exactly one endpoint to scrape:

# Here it's Prometheus itself.

scrape_configs:

- job_name: 'Host'

  file_sd_configs:

  - files:

    - host.yml

  metrics_path: /metrics

  relabel_configs:

  - source_labels: [__address__]

    regex: (.*)

    target_label: instance

    replacement: $1

  - source_labels: [__address__]

    regex: (.*)

    target_label: __address__

    replacement: $1:9100

- job_name: 'MySQL'

  file_sd_configs:

  - files:

    - mysql.yml

  metrics_path: /metrics

  relabel_configs:

  - source_labels: [__address__]

    regex: (.*)

    target_label: instance

    replacement: $1

  - source_labels: [__address__]

    regex: (.*)

    target_label: __address__

    replacement: $1:9104

- job_name: 'prometheus'

  static_configs:

  - targets:

    - localhost:9090

cat host.yml

- labels:

    service: test

  targets:

  - 192.168.0.248

  - 192.168.0.237

cat mysql.yml

- labels:

    service: test

  targets:

  - 192.168.0.237

# 测试 prometheus 是否可以正常启动

/iba/prometheus/prometheus --storage.tsdb.retention=30d &

ps -ef|grep prometh

kill -9 14650

# 配置 prometheus.service 文件

vi /usr/lib/systemd/system/prometheus.service

# 内容为

[Unit]

Description=Prometheus instance

Wants=network-online.target

After=network-online.target

[Service]

User=root

Group=root

Type=simple

Restart=on-failure

WorkingDirectory=/iba/prometheus/

RuntimeDirectory=prometheus

RuntimeDirectoryMode=0750

ExecStart=/iba/prometheus/prometheus  --storage.tsdb.retention=30d --config.file=/iba/prometheus/prometheus.yml

LimitNOFILE=10000

TimeoutStopSec=20

[Install]

WantedBy=multi-user.target

# 启动 prometheus

systemctl start prometheus

systemctl status prometheus -l

# 开放防火墙

firewall-cmd --permanent --add-rich-rule="rule family="ipv4" source address="192.168.0.0/16" accept"

firewall-cmd --reload
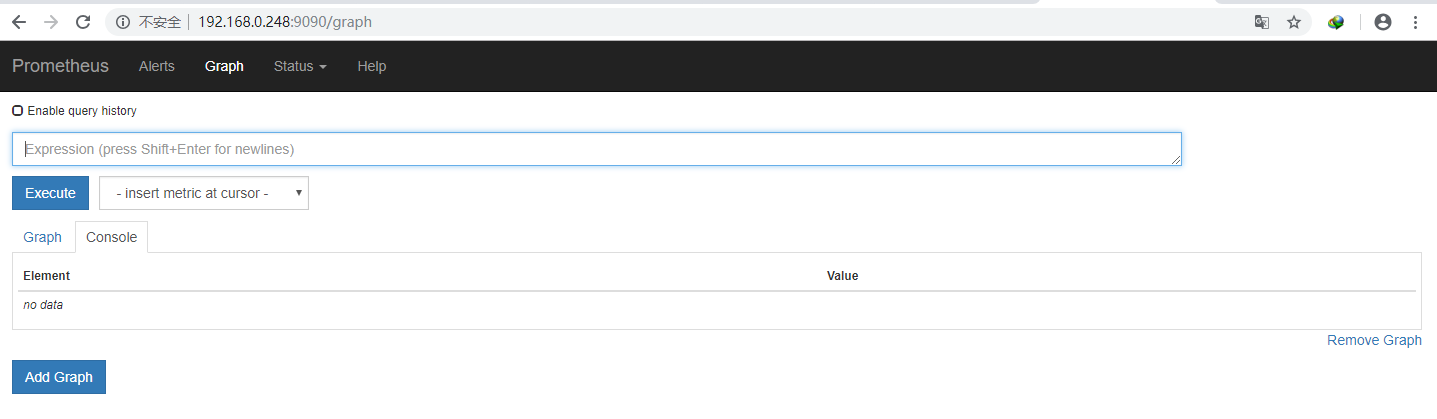
浏览器输入 http://192.168.0.248:9090 访问
prometheus.yml 文件参考:
https://prometheus.io/docs/prometheus/latest/configuration/configuration/
https://prometheus.io/docs/prometheus/latest/configuration/configuration/#<relabel_config>
https://prometheus.io/docs/prometheus/latest/configuration/configuration/#<file_sd_config>
安装 node_exporter 获取主机信息
# 解压 node_exporter

cd /data/software/

tar xf node_exporter-0.15.2.linux-amd64.tar.gz -C /usr/local

mv node_exporter-0.15.2.linux-amd64 node_exporter

nohup ./node_exporter &
安装 grafana
cd /iba/software

# 解压

tar xf grafana-4.6.3.linux-x64.tar.gz -C /iba/prometheus/

cd /iba/prometheus/

mv grafana-4.6.3 grafana

cd grafana/

# 测试

./bin/grafana-server

# 停止

ctrl+c

cat /usr/lib/systemd/system/grafana-server.service

[Unit]

Description=Grafana instance

Documentation=http://docs.grafana.org

Wants=network-online.target

After=network-online.target

[Service]

User=root

Group=root

Type=simple

Restart=on-failure

WorkingDirectory=/iba/prometheus/grafana

RuntimeDirectory=grafana

RuntimeDirectoryMode=0750

ExecStart=/iba/prometheus/grafana/bin/grafana-server

LimitNOFILE=10000

TimeoutStopSec=20

[Install]

WantedBy=multi-user.target

# 启动

systemctl start grafana-server

systemctl status grafana-server -l
访问 http://192.168.0.248:3000,默认用户和密码是 admin/admin

配置数据源


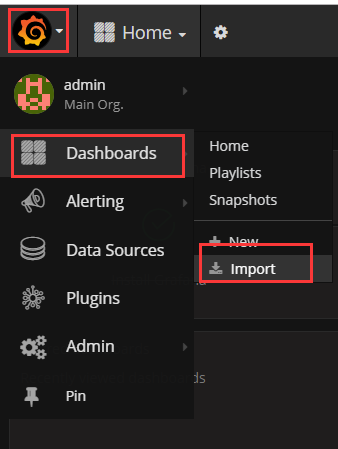
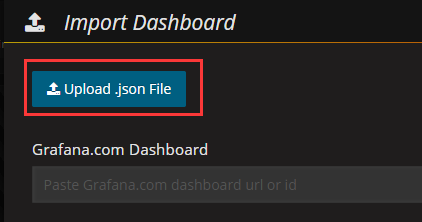
下载 grafana-dashboards-1.6.1.tar.gz,解压,使用浏览器导入 dashboard, 下载地址:https://github.com/percona/grafana-dashboards/archive/v1.6.1.tar.gz

在 192.168.0.237 安装 node_exporter 和 mysqld_exporter
cd /iba/software/

tar zxf node_exporter-0.15.2.linux-amd64.tar.gz -C /usr/local/

cd /usr/local/

mv node_exporter-0.15.2.linux-amd64 node_exporter

# 启动

cd node_exporter/

nohup ./node_exporter &
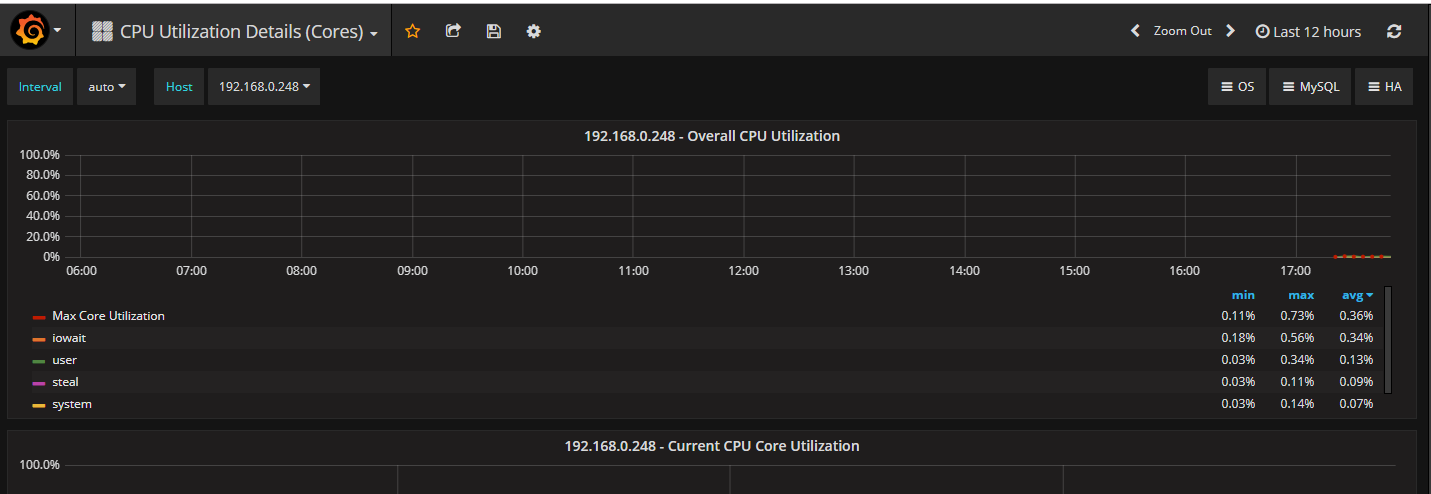
几分钟后 grafana 出现了新服务器的信息

在mysql上配置监控使用的用户
GRANT REPLICATION CLIENT, PROCESS, SELECT ON *.* TO 'mysql_monitor'@'%' IDENTIFIED BY 'mysql_monitor';

FLUSH PRIVILEGES;
cd /iba/software/

tar zxf mysqld_exporter-0.10.0.linux-amd64.tar.gz -C /usr/local/

cd /usr/local/

mv mysqld_exporter-0.10.0.linux-amd64/ mysqld_exporter

cd mysqld_exporter/

# 在 mysql 上创建一个专门用于监控的用户,

cat .my.cnf

[client]

user=mysql_monitor

password=mysql_monitor

# 启动

nohup /usr/local/mysqld_exporter/mysqld_exporter  -config.my-cnf="/usr/local/mysqld_exporter/.my.cnf" &
导入 dashboard: MySQL_Overview.json

Grafan+Prometheus 监控 MySQL的更多相关文章
- Grafana+Prometheus 监控 MySQL
转自:Grafana+Prometheus 监控 MySQL 架构图 环境 IP 环境 需装软件 192.168.0.237 mysql-5.7.20 node_exporter-0.15.2.lin ...
- Prometheus 监控Mysql服务器及Grafana可视化
Prometheus 监控Mysql服务器及Grafana可视化. mysql_exporter:用于收集MySQL性能信息. 使用版本 mysqld_exporter 0.11.0 官方地址 使用文 ...
- 使用 Docker 部署 Grafana + Prometheus 监控 MySQL 数据库
一.背景 在平时开发过程当中需要针对 MySQL 数据库进行监控,这里我们可以使用 Grafana 和 Prometheus 来实现监控功能.Grafana 是一款功能强大的仪表盘面板,支持多种数据源 ...
- 采用prometheus 监控mysql
1. prometheus 是什么 开源的系统监控和报警工具,监控项目的流量.内存量.负载量等实时数据. 它通过直接或短时jobs中介收集监控数据,在本地存储所有收集到的数据,并且通过定义好的rule ...
- Grafana+Prometheus监控mysql性能
#cmd /usr/local 今天讲一下如何监控服务器中的mysql数据库的性能 一.数据库操作 1.mysql启动 #service mysqld start #启动数据库 #service my ...
- Prometheus 监控MySQL
目录 0.简介 1.mysql_exporter部署 2.mysql报警规则 0.简介 文中主要监控MySQL/MySQL主从信息 版本:mysql-5.7,mysql_exporter-0.12.1 ...
- 手把手教你使用 Prometheus 监控 MySQL 与 MariaDB.md
概述 MySQL 是常用的关系型数据库,MariaDB 作为 MySQL 的分支版本,兼容 MySQL 协议,也越来越流行.在 Kubernetes 环境中如何使用 Prometheus 来对它们进行 ...
- prometheus监控mysql
创建一个用于mysqld_exporter连接到MySQL的用户并赋予所需的权限 mysql> GRANT REPLICATION CLIENT, PROCESS ON *.* TO '; my ...
- 使用Prometheus监控SpringBoot应用
通过之前的文章我们使用Prometheus监控了应用服务器node_exporter,数据库mysqld_exporter,今天我们来监控一下你的应用.(本文以SpringBoot 2.1.9.REL ...
随机推荐
- C++ Opencv split()通道分离函数 merge()通道合并函数 使用操作详解
一. split()通道分离函数 split()函数的C++版本有两个原型,他们分别是: C++: void split(const Mat& src, Mat*mvbegin);//& ...
- 第55节:Java当中的IO流-时间api(下)-上
Java当中的IO流(下)-上 日期和时间 日期类:java.util.Date 系统时间: long time = System.currentTimeMillis(); public class ...
- vim 行跳转和列跳转的方法
vim提供了丰富的快速跳转任意行.任意列的方法,方便高效地移动光标,定位文件位置. 一.Vim行跳转 使用vim查看文件时,使用以下命令可以快速跳转文件首.尾行,方便对整个文件有个全局把握. 1.1 ...
- 【shiro】(1)---了解权限管理
了解权限管理 一.概念 1.什么是权限管理 只要有用户参与的系统一般都要有权限管理,权限管理实现对用户访问系统的控制,按照安全规则或者安全策略控制用户可以访问而且只能访问自己被授权的资源. 权限管理包 ...
- Kubernetes 服务入口管理 Traefik Ingress Controller
前面部署了 kubernetes/ingress-nginx 作为 Ingress Controller,使用 Nginx 反向代理与负载,通过 Ingress Controller 不断的跟 Kub ...
- 07 训练Tensorflow识别手写数字
打开Python Shell,输入以下代码: import tensorflow as tf from tensorflow.examples.tutorials.mnist import input ...
- Spring基础系列-AOP源码分析
原创作品,可以转载,但是请标注出处地址:https://www.cnblogs.com/V1haoge/p/9560803.html 一.概述 Spring的两大特性:IOC和AOP. AOP是面向切 ...
- Ajax的初级使用
一.AJAX简介(本文的例子都使用的是原生的ajax) 老技术新用法二.异步和同步区别三.XMLHttpRequest对象(面试题) 属性: readyState: 0:未初始化 1:open方法已经 ...
- java实现带空格字符串的倒序输出
import org.junit.Test; public class StringtoChar { @Test public void main(){ String str ="hello ...
- AFNetworking封装-项目使用
本篇博客是接着上一篇AFNetworking源码解析的后续,如果想对AFNetworking源码有所了解. 请读一下https://www.cnblogs.com/guohai-stronger/p/ ...