
吴裕雄 python 机器学习-DMT(2)
import matplotlib.pyplot as plt

decisionNode = dict(boxstyle="sawtooth", fc="0.8")

leafNode = dict(boxstyle="round4", fc="0.8")

arrow_args = dict(arrowstyle="<-")

def getNumLeafs(myTree):

    numLeafs = 0

    for i in myTree.keys():

        firstStr = i

        break

    secondDict = myTree[firstStr]

    for key in secondDict.keys():

        if type(secondDict[key]).__name__=='dict':

            numLeafs += getNumLeafs(secondDict[key])

        else:   numLeafs +=1

    return numLeafs

def getTreeDepth(myTree):

    maxDepth = 0

    for i in myTree.keys():

        firstStr = i

        break

    secondDict = myTree[firstStr]

    for key in secondDict.keys():

        if type(secondDict[key]).__name__=='dict':

            thisDepth = 1 + getTreeDepth(secondDict[key])

        else:   thisDepth = 1

        if thisDepth > maxDepth: maxDepth = thisDepth

    return maxDepth

def plotNode(nodeTxt, centerPt, parentPt, nodeType):

    createPlot.ax1.annotate(nodeTxt, xy=parentPt,  xycoords='axes fraction',xytext=centerPt, textcoords='axes fraction',va="center", ha="center", bbox=nodeType, arrowprops=arrow_args )

def plotMidText(cntrPt, parentPt, txtString):

    xMid = (parentPt[0]-cntrPt[0])/2.0 + cntrPt[0]

    yMid = (parentPt[1]-cntrPt[1])/2.0 + cntrPt[1]

    createPlot.ax1.text(xMid, yMid, txtString, va="center", ha="center", rotation=30)

def plotTree(myTree, parentPt, nodeTxt):

    numLeafs = getNumLeafs(myTree)

    depth = getTreeDepth(myTree)

    for i in myTree.keys():

        firstStr = i

        break

    cntrPt = (plotTree.xOff + (1.0 + float(numLeafs))/2.0/plotTree.totalW, plotTree.yOff)

    plotMidText(cntrPt, parentPt, nodeTxt)

    plotNode(firstStr, cntrPt, parentPt, decisionNode)

    secondDict = myTree[firstStr]

    plotTree.yOff = plotTree.yOff - 1.0/plotTree.totalD

    for key in secondDict.keys():

        if type(secondDict[key]).__name__=='dict':

            plotTree(secondDict[key],cntrPt,str(key))

        else:

            plotTree.xOff = plotTree.xOff + 1.0/plotTree.totalW

            plotNode(secondDict[key], (plotTree.xOff, plotTree.yOff), cntrPt, leafNode)

            plotMidText((plotTree.xOff, plotTree.yOff), cntrPt, str(key))

    plotTree.yOff = plotTree.yOff + 1.0/plotTree.totalD

def createPlot(inTree):

    fig = plt.figure(1, facecolor='white')

    fig.clf()

    axprops = dict(xticks=[], yticks=[])

    createPlot.ax1 = plt.subplot(111, frameon=False, **axprops)

    #createPlot.ax1 = plt.subplot(111, frameon=False) #ticks for demo puropses

    plotTree.totalW = float(getNumLeafs(inTree))

    plotTree.totalD = float(getTreeDepth(inTree))

    plotTree.xOff = -0.5/plotTree.totalW; plotTree.yOff = 1.0;

    plotTree(inTree, (0.5,1.0), '')

    plt.show()

def retrieveTree(i):

    listOfTrees =[{'no surfacing': {0: 'no', 1: {'flippers': {0: 'no', 1: 'yes'}}}},

                  {'no surfacing': {0: 'no', 1: {'flippers': {0: {'head': {0: 'no', 1: 'yes'}}, 1: 'no'}}}}

                  ]

    return listOfTrees[i]

thisTree = retrieveTree(0)

createPlot(thisTree)

thisTree = retrieveTree(1)

createPlot(thisTree)

import numpy as np

import operator as op

from math import log

def calcShannonEnt(dataSet):

    labelCounts = {}

    for featVec in dataSet:

        currentLabel = featVec[-1]

        if(currentLabel not in labelCounts.keys()):

            labelCounts[currentLabel] = 0

        labelCounts[currentLabel] += 1

    shannonEnt = 0.0

    rowNum = len(dataSet)

    for key in labelCounts:

        prob = float(labelCounts[key])/rowNum

        shannonEnt -= prob * log(prob,2)

    return shannonEnt

def splitDataSet(dataSet, axis, value):

    retDataSet = []

    for featVec in dataSet:

        if(featVec[axis] == value):

            reducedFeatVec = featVec[:axis]

            reducedFeatVec.extend(featVec[axis+1:])

            retDataSet.append(reducedFeatVec)

    return retDataSet

def chooseBestFeatureToSplit(dataSet):

    numFeatures = np.shape(dataSet)[1]-1

    baseEntropy = calcShannonEnt(dataSet)

    bestInfoGain = 0.0

    bestFeature = -1

    for i in range(numFeatures):

        featList = [example[i] for example in dataSet]

        uniqueVals = set(featList)

        newEntropy = 0.0

        for value in uniqueVals:

            subDataSet = splitDataSet(dataSet, i, value)

            prob = len(subDataSet)/float(len(dataSet))

            newEntropy += prob * calcShannonEnt(subDataSet)

        infoGain = baseEntropy - newEntropy

        if (infoGain > bestInfoGain):

            bestInfoGain = infoGain

            bestFeature = i

    return bestFeature

def majorityCnt(classList):

    classCount={}

    for vote in classList:

        if(vote not in classCount.keys()):

            classCount[vote] = 0

        classCount[vote] += 1

    sortedClassCount = sorted(classCount.items(), key=op.itemgetter(1), reverse=True)

    return sortedClassCount[0][0]

def createTree(dataSet,labels):

    classList = [example[-1] for example in dataSet]

    if(classList.count(classList[0]) == len(classList)):

        return classList[0]

    if len(dataSet[0]) == 1:

        return majorityCnt(classList)

    bestFeat = chooseBestFeatureToSplit(dataSet)

    bestFeatLabel = labels[bestFeat]

    myTree = {bestFeatLabel:{}}

    del(labels[bestFeat])

    featValues = [example[bestFeat] for example in dataSet]

    uniqueVals = set(featValues)

    for value in uniqueVals:

        subLabels = labels[:]

        myTree[bestFeatLabel][value] = createTree(splitDataSet(dataSet, bestFeat, value),subLabels)

    return myTree

def classify(inputTree,featLabels,testVec):

    for i in inputTree.keys():

        firstStr = i

        break

    secondDict = inputTree[firstStr]

    featIndex = featLabels.index(firstStr)

    key = testVec[featIndex]

    valueOfFeat = secondDict[key]

    if isinstance(valueOfFeat, dict):

        classLabel = classify(valueOfFeat, featLabels, testVec)

    else:

        classLabel = valueOfFeat

    return classLabel

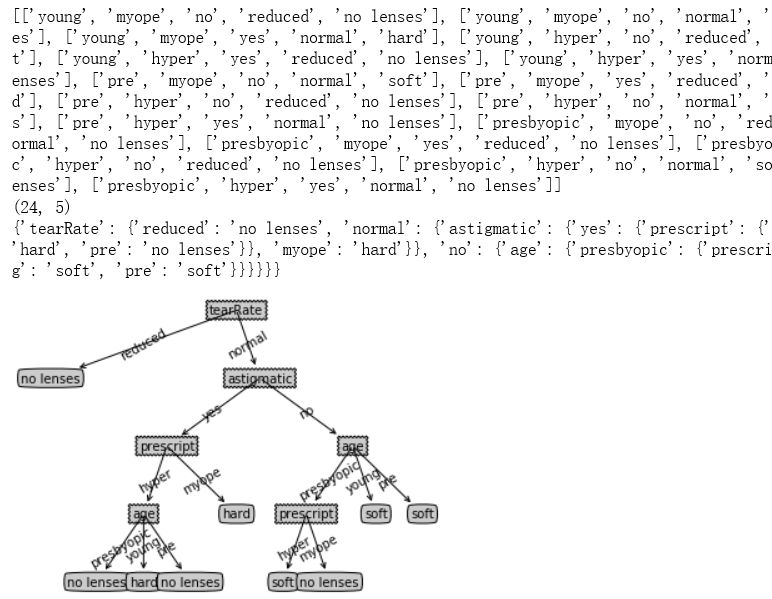
data = open("D:\\LearningResource\\machinelearninginaction\\Ch03\\lenses.txt")

dataSet = [inst.strip().split("\t") for inst in data.readlines()]

print(dataSet)

print(np.shape(dataSet))

labels = ["age","prescript","astigmatic","tearRate"]

tree = createTree(dataSet,labels)

print(tree)

import matplotlib.pyplot as plt

decisionNode = dict(boxstyle="sawtooth", fc="0.8")

leafNode = dict(boxstyle="round4", fc="0.8")

arrow_args = dict(arrowstyle="<-")

def getNumLeafs(myTree):

    numLeafs = 0

    for i in myTree.keys():

        firstStr = i

        break

    secondDict = myTree[firstStr]

    for key in secondDict.keys():

        if type(secondDict[key]).__name__=='dict':

            numLeafs += getNumLeafs(secondDict[key])

        else:   numLeafs +=1

    return numLeafs

def getTreeDepth(myTree):

    maxDepth = 0

    for i in myTree.keys():

        firstStr = i

        break

    secondDict = myTree[firstStr]

    for key in secondDict.keys():

        if type(secondDict[key]).__name__=='dict':

            thisDepth = 1 + getTreeDepth(secondDict[key])

        else:   thisDepth = 1

        if thisDepth > maxDepth: maxDepth = thisDepth

    return maxDepth

def plotNode(nodeTxt, centerPt, parentPt, nodeType):

    createPlot.ax1.annotate(nodeTxt, xy=parentPt,  xycoords='axes fraction',xytext=centerPt, textcoords='axes fraction',va="center", ha="center", bbox=nodeType, arrowprops=arrow_args )

def plotMidText(cntrPt, parentPt, txtString):

    xMid = (parentPt[0]-cntrPt[0])/2.0 + cntrPt[0]

    yMid = (parentPt[1]-cntrPt[1])/2.0 + cntrPt[1]

    createPlot.ax1.text(xMid, yMid, txtString, va="center", ha="center", rotation=30)

def plotTree(myTree, parentPt, nodeTxt):

    numLeafs = getNumLeafs(myTree)

    depth = getTreeDepth(myTree)

    for i in myTree.keys():

        firstStr = i

        break

    cntrPt = (plotTree.xOff + (1.0 + float(numLeafs))/2.0/plotTree.totalW, plotTree.yOff)

    plotMidText(cntrPt, parentPt, nodeTxt)

    plotNode(firstStr, cntrPt, parentPt, decisionNode)

    secondDict = myTree[firstStr]

    plotTree.yOff = plotTree.yOff - 1.0/plotTree.totalD

    for key in secondDict.keys():

        if type(secondDict[key]).__name__=='dict':

            plotTree(secondDict[key],cntrPt,str(key))

        else:

            plotTree.xOff = plotTree.xOff + 1.0/plotTree.totalW

            plotNode(secondDict[key], (plotTree.xOff, plotTree.yOff), cntrPt, leafNode)

            plotMidText((plotTree.xOff, plotTree.yOff), cntrPt, str(key))

    plotTree.yOff = plotTree.yOff + 1.0/plotTree.totalD

def createPlot(inTree):

    fig = plt.figure(1, facecolor='white')

    fig.clf()

    axprops = dict(xticks=[], yticks=[])

    createPlot.ax1 = plt.subplot(111, frameon=False, **axprops)

    #createPlot.ax1 = plt.subplot(111, frameon=False) #ticks for demo puropses

    plotTree.totalW = float(getNumLeafs(inTree))

    plotTree.totalD = float(getTreeDepth(inTree))

    plotTree.xOff = -0.5/plotTree.totalW; plotTree.yOff = 1.0;

    plotTree(inTree, (0.5,1.0), '')

    plt.show()

createPlot(tree)
吴裕雄 python 机器学习-DMT(2)的更多相关文章
- 吴裕雄 python 机器学习-DMT(1)
import numpy as np import operator as op from math import log def createDataSet(): dataSet = [[1, 1, ...
- 吴裕雄 python 机器学习——分类决策树模型
import numpy as np import matplotlib.pyplot as plt from sklearn import datasets from sklearn.model_s ...
- 吴裕雄 python 机器学习——回归决策树模型
import numpy as np import matplotlib.pyplot as plt from sklearn import datasets from sklearn.model_s ...
- 吴裕雄 python 机器学习——线性判断分析LinearDiscriminantAnalysis
import numpy as np import matplotlib.pyplot as plt from matplotlib import cm from mpl_toolkits.mplot ...
- 吴裕雄 python 机器学习——逻辑回归
import numpy as np import matplotlib.pyplot as plt from matplotlib import cm from mpl_toolkits.mplot ...
- 吴裕雄 python 机器学习——ElasticNet回归
import numpy as np import matplotlib.pyplot as plt from matplotlib import cm from mpl_toolkits.mplot ...
- 吴裕雄 python 机器学习——Lasso回归
import numpy as np import matplotlib.pyplot as plt from sklearn import datasets, linear_model from s ...
- 吴裕雄 python 机器学习——岭回归
import numpy as np import matplotlib.pyplot as plt from sklearn import datasets, linear_model from s ...
- 吴裕雄 python 机器学习——线性回归模型
import numpy as np from sklearn import datasets,linear_model from sklearn.model_selection import tra ...
随机推荐
- Centos7使用pxe安装KVM虚拟机
Centos7使用pxe安装KVM虚拟机 一.安装服务所需的软件 [root@localhost ~]yum install nginx dhcp vsftpd syslinux -y [root@l ...
- flask基础知识
关于flask框架的基础知识 相关基础知识:定义路由,定义参数,获取参数,重定向 简单易懂 ---hello.py # -*- coding: utf-8 -*- # Flask hello worl ...
- Linux RPS/RFS 实现原理浅析
本文快速解析一下RPS/RFS的基本原理. RPS-Receive Packet Steering 下面这个就是RPS的原理: 其实就是一个软件对CPU负载重分发的机制.其使能的作用点在CPU开始处 ...
- MySQL · 最佳实践 · 分区表基本类型
MySQL · 最佳实践 · 分区表基本类型 MySQL分区表概述 随着MySQL越来越流行,Mysql里面的保存的数据也越来越大.在日常的工作中,我们经常遇到一张表里面保存了上亿甚至过十亿的记录.这 ...
- JVM总结-异常处理
众所周知,异常处理的两大组成要素是抛出异常和捕获异常.这两大要素共同实现程序控制流的非正常转移. 抛出异常可分为显式和隐式两种.显式抛异常的主体是应用程序,它指的是在程序中使用“throw”关键字,手 ...
- 三种常见的Web安全问题
XSS漏洞 1.XSS简介 跨站脚本(cross site script)简称为XSS,是一种经常出现在web应用中的计算机安全漏洞,也是web中最主流的攻击方式. XSS是指恶意攻击者利用网站没有对 ...
- 微信小程序笔记<四>page.js —— 页面注册
小程序的每个页面都是独立的,每个页面都必须有 page.js 和 page.wxhl 文件,page.json 和 page.wxss 文件非必要文件,注意如果创建 page.json 则至少保证有一 ...
- 20165205 2017-2018-2 《Java程序设计》第七周学习总结
20165205 2017-2018-2 <Java程序设计>第七周学习总结 教材学习内容总结 下载XAMPP并完成配置 完成XAMPP与数据库的连接 学会创建一个数据库 学会用java语 ...
- 学习笔记:webpack
http://wiki.jikexueyuan.com/project/webpack-handbook/ Webpack 中文指南 http://www.itzjt.cc/2017/04/09/we ...
- Ubuntu系统安装
一:Ubuntu14.04 安装及使用:[1]制作安装U盘(选择USB-HDD+”并单击后, 一定要点“写入”,注意,“写入”是一个按钮) 以下是详细的连接步骤: https:// ...