可视化—AntV G6实现节点连线及展开收缩分组
AntV 是蚂蚁金服全新一代数据可视化解决方案,主要包含数据驱动的高交互可视化图形语法G2,专注解决流程与关系分析的图表库 G6、适于对性能、体积、扩展性要求严苛的场景。
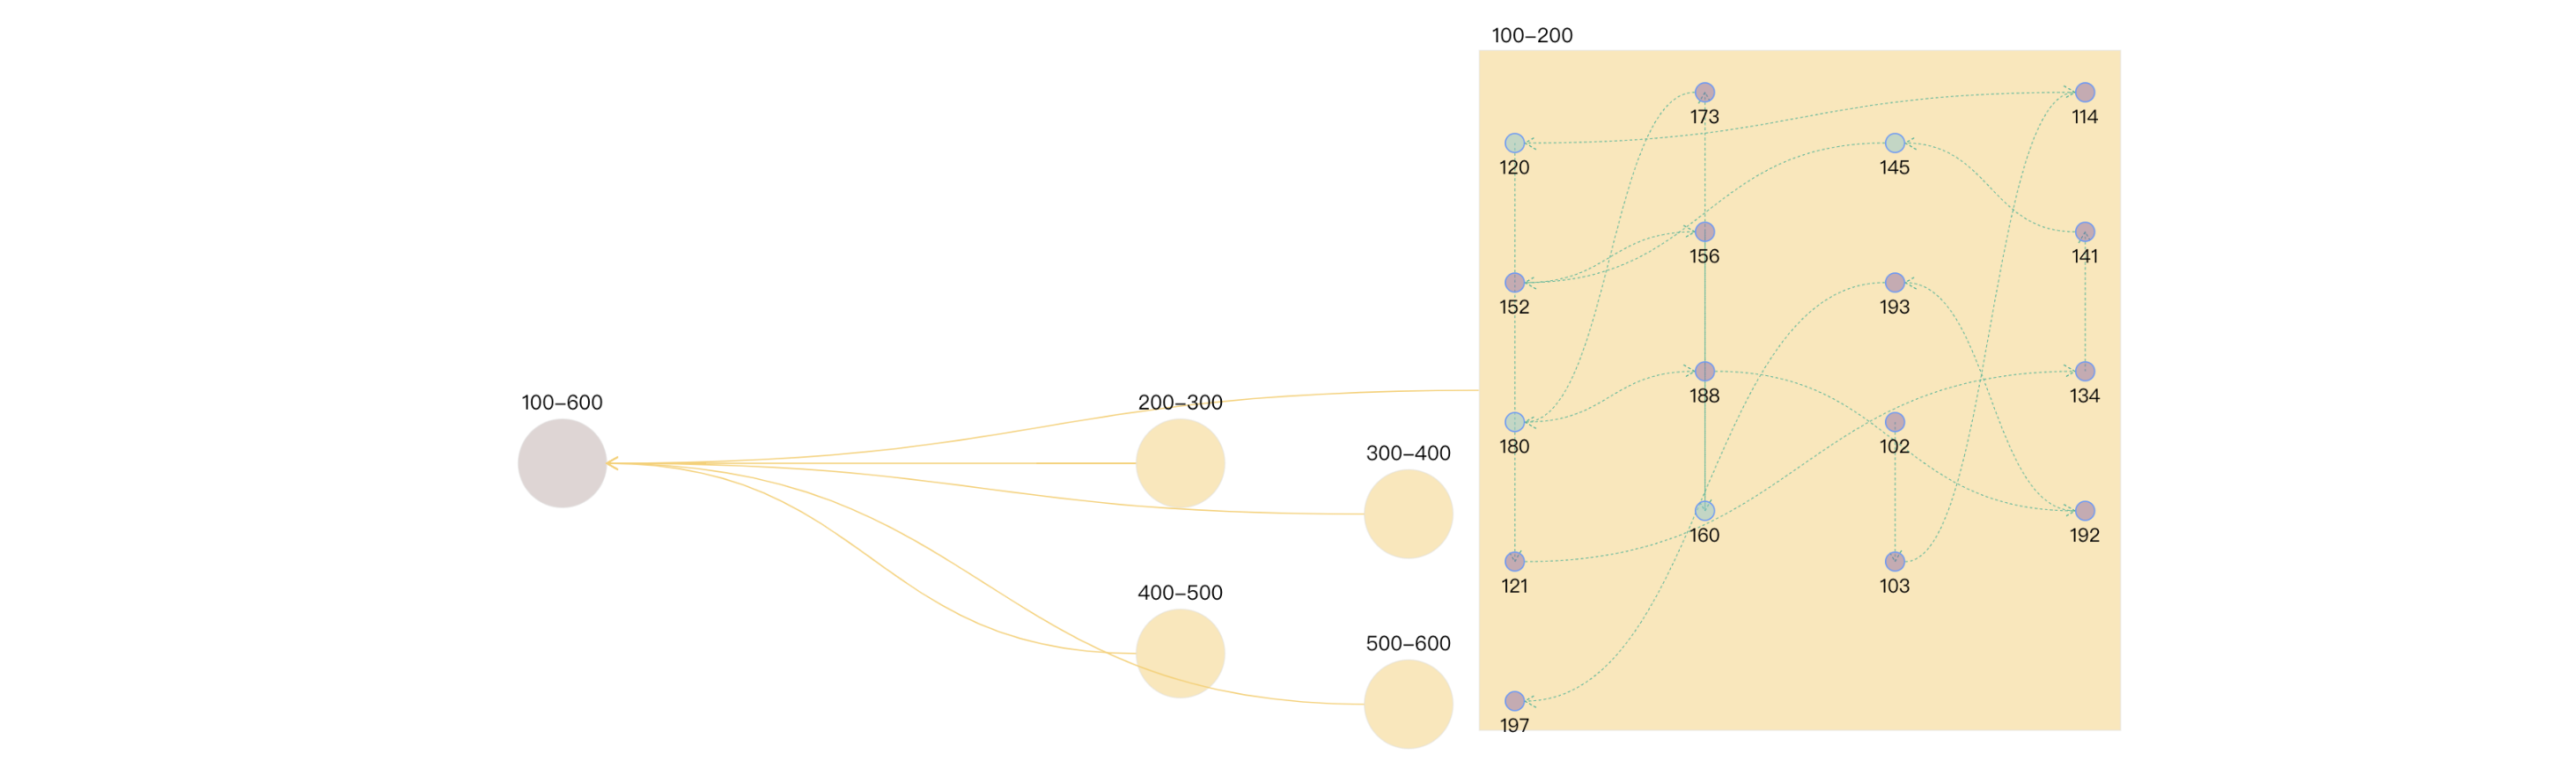
demo使用数字模拟真实的节点及分组数据。combo内的nodes亦是使用随机数生成,节点之前的连线edges由节点从小到大依次连接 ,大家在用的时候,可以注意一下连线对象的 source 和 target 两个属性即可
安装模块依赖 :npm install @antv/g6
main.js 中引入,并绑定Vue原型方法
import G6 from '@antv/g6';

import Vue from 'vue';

Vue.prototype.G6 = G6;
创建Graph.vue
<template>

  <div>

    <div id="drawGraph"></div>

  </div>

</template>

<script>

let graphG = null

export default {

  mounted() {

    this.initData();

  },

  methods: {

    initData() {

      let combos = [

        { id: '100-600', label: '100-600', type: 'root' },

        { id: '100-200', label: '100-200' },

        { id: '200-300', label: '200-300' },

        { id: '300-400', label: '300-400' },

        { id: '400-500', label: '400-500' },

        { id: '500-600', label: '500-600' },

      ]

      let edges = [

        { source: '100-200', target: '100-600' },

        { source: '200-300', target: '100-600' },

        { source: '300-400', target: '100-600' },

        { source: '400-500', target: '100-600' },

        { source: '500-600', target: '100-600' },

      ]

      let data = { combos, edges }

      this.makeRelationData(data);

    },

    // 分组 点 连线处理

    makeRelationData(data) {

      if (graphG) {

        graphG.destroy();

      }

      let drawGraph = document.getElementById("drawGraph");

      this.graphWidth = drawGraph.scrollWidth;

      this.graphHeight = drawGraph.scrollHeight || 1200;

      let origin = [this.graphWidth / 2, 100];

      let row = 150, clo = 180;

      let combos = data.combos

      let row_clo = Math.floor(Math.sqrt(combos.length));

      for (let i = 0; i < combos.length; i++) {

        let rowindex = Math.floor(i / row_clo) + 1;

        let cloindex = (i % row_clo) + 1;

        // 分组默认样式设置

        if (combos[i].type === 'root') {

          combos[i].x = this.graphWidth / 3

          combos[i].y = this.graphHeight / 3

          combos[i].style = {

            fill: "#B19693",

            opacity: 0.4,

            cursor: "pointer",

          };

        } else {

          // 分组定位

          combos[i].x = origin[0] + clo * cloindex;

          combos[i].y = origin[1] + row * rowindex;

          if (i % 2 === 1) {

            combos[i].y += 40;

          }

          combos[i].style = {

            fill: "#FAD069",

            opacity: 0.5,

            cursor: "pointer",

          }

        }

      }

      this.drawQfast(data)

    },

    drawQfast(data) {

      graphG = new this.G6.Graph({

        container: "drawGraph",

        width: this.graphWidth,

        height: this.graphHeight,

        groupByTypes: false,

        modes: {

          default: [

            { type: "zoom-canvas", enableOptimize: true, optimizeZoom: 0.2 },

            { type: "drag-canvas", enableOptimize: true },

            { type: "drag-node", enableOptimize: true, onlyChangeComboSize: true },

            { type: "drag-combo", enableOptimize: true, onlyChangeComboSize: true },

            { type: "brush-select", enableOptimize: true },

          ],

        },

        defaultEdge: {

          type: 'cubic-horizontal',

          lineWidth: 1,

          style: {

            endArrow: true,

            stroke: "#FAD069",

          },

        },

        edgeStateStyles: {

          hover: {

            lineWidth: 2,

          },

        },

        defaultNode: {

          type: "circle",

          size: 15,

          labelCfg: {

            position: "bottom",

            style: {

              fontSize: 15,

            },

          },

        },

        defaultCombo: {

          type: "circle",

          opacity: 0,

          lineWidth: 1,

          collapsed: true,

          labelCfg: {

            position: "top",

            refY: 5,

            style: {

              fontSize: 16,

            },

          },

        },

      });

      graphG.data(data);

      graphG.render(); // 渲染图

      graphG.zoom(0.8);  // 如果觉得节点大,可以缩放整个图

      graphG.on("edge:mouseenter", (e) => {

        graphG.setItemState(e.item, "hover", true);

      });

      graphG.on("edge:mouseleave", (e) => {

        graphG.setItemState(e.item, "hover", false);

      });

      graphG.on("combo:dblclick", (e) => {

        e.item._cfg.model.type = e.item._cfg.model.type === "rect" ? "circle" : "rect";  // 分组形状,方圆切换

        e.item._cfg.model.labelCfg.refY = e.item._cfg.model.type === "rect" ? -20 : 5;   // 切换形状,改变label定位

        const comboId = e.item._cfg.model.id

        graphG.collapseExpandCombo(comboId);

        // 分组收缩时,删除分组内的连线和节点

        if (e.item._cfg.model.collapsed) {   // 收缩

          let newedges = e.item.getEdges();

          let newNodes = e.item.getNodes();

          for (let j = 0; j < newedges.length; j++) {

            graphG.removeItem(newedges[j]);

          }

          for (let i = 0; i < newNodes.length; i++) {

            graphG.removeItem(newNodes[i]);

          }

          data.edges.forEach(edge => {

            graphG.addItem("edge", edge);

          });

        } else {   // 展开

          // 分组展开时, 添加节点和连线,并给分组内的节点 添加位置信息

          let origin = [e.item._cfg.model.x, e.item._cfg.model.y];  // 获取当前分组combs的坐标

          let row = 110, clo = 150;

          // 生成(10-20)随机数个 随机数 模拟展开分组内的节点

          let randomCount = Math.floor(Math.random() * 10) + 10;

          let row_clo = Math.floor(Math.sqrt(randomCount));

          let nodes = []

          for (let i = 0; i < randomCount; i++) {

            let min = comboId.split('-')[0] - 0

            let max = comboId.split('-')[1] - 0

            let randomNum = Math.floor(Math.random() * (max - min)) + min;

            if (nodes.indexOf(randomNum) > -1) {

              i--

              continue;

            }

            nodes.push(randomNum)

            let rowindex = Math.floor(i / row_clo);

            let cloindex = i % row_clo;

            let y = origin[1] + row * rowindex

            let node = {

              label: randomNum,

              id: randomNum.toString(),

              comboId: comboId,

              style: {

                fillOpacity: 0.5,

                cursor: "pointer",

                fill: randomNum % 5 == 0 ? "#81C7D4" : "#986DB2"

              },

              x: origin[0] + clo * cloindex,

              y: i % 2 == 0 ? y + 40 : y

            }

            graphG.addItem("node", node); // 将节点添加至分组

          }

          nodes.sort((a, b) => a - b)  // 将分组内的数字排序,从小到大依次连接,模拟真实数据

          for (let i = 0; i < nodes.length - 1; i++) {

            let edge = {

              source: nodes[i].toString(),

              target: nodes[i + 1].toString(),

              lineWidth: 1,

              style: {

                lineDash: [2, 2],

                lineWidth: 0.5,

                stroke: "#00AA90"

              }

            }

            graphG.addItem("edge", edge);  // 添加连线   将分组内的数字排序,从小到大依次连接

          }

        }

      });

    },

  }

};

</script>
收缩图:

展开图:
可视化—AntV G6实现节点连线及展开收缩分组的更多相关文章
- 可视化—AntV G6 紧凑树实现节点与边动态样式、超过X条展示更多等实用小功能
通过一段时间的使用和学习,对G6有了更一步的经验,这篇博文主要从以下几个小功能着手介绍,文章最后会给出完整的demo代码. 目录 1. 树图的基本布局和使用 2. 根据返回数据的属性不同,定制不一样的 ...
- 可视化—AntV G6 高亮相邻节点的两种方式
目录 内置的高亮节点 自定义高亮 自定义高亮时保持原始颜色 总结 案例完整代码 通过官方文档,可知高亮相邻节点分为两种方法,文档描述并不是很清楚,对刚接触这个库的小白并不是很友好,慢慢总结慢慢来吧 内 ...
- React使用AntV G6实现流程图
安装 npm install @antv/g6 --save 引用 import G6 from '@antv/g6' 自定义节点 /** * 方式一 */ G6.registerNode('rect ...
- antV G6流程图在Vue中的使用
最近我司项目中需要加入流程图制作功能,于是乎百度各种找可视化绘制拓扑图的轮子,大部分都是国外的,看文档太吃力,不过好在最终让我发现了AntV G6流程图图表库,最新版为2.0,不过编辑器在2.0版本还 ...
- vue结合antV/g6 实现网络拓扑图
最近很多业务场景都会需要用到拓扑图,翻找了很多资料,最后选择了antV/g6,主要原因有以下几点: 1.阿里出品,所以框架的成熟性有保障 2.业务场景契合(1.规则拓扑图:2.动画流向:每个节点会有流 ...
- React + umi +antd+antv/g6 实现力图
官方示例效果:http://antv.alipay.com/zh-cn/g6/2.x/demo/net/2017-link-data.html 改编效果: 实现步骤: 环境:nodejs.yarn/n ...
- dhtmlxtree 节点 展开收缩:新增了直接点 文本内容 也 实现了 展开收缩 功能(并记住了展开、收缩状态)
dhtmlxtree 节点 展开收缩通常情况我们按 +- 就实现了 展开收缩 功能,为了方便我们新增了直接点 文本内容 也 实现了 展开收缩 功能(并记住了展开.收缩状态) tree = new dh ...
- extjs4.0 treepanel节点的选中、展开! 数据的重新加载
1.extjs4.0API较3.0有非常大变化2.多级子父节点的选中和展开.3.数据的重新加载.tree.getStore().load4.节点的移除,从树中根据ID获取节点 tree.getStor ...
- AntV G6绘制流程图学习例子
下面代码可以直接贴到html文件中运行看效果. 代码说明 js中data是一个json变量,里面有两个关键对象"nodes.edges",分别来描述节点.节点间箭线. 更多&quo ...
- activiti 配置节点 连线信息获取
1.1.1. 前言 当使用eclipse插件进行流程设计的时候,部署流程之后,我们如何获取我们定义的所有的节点.连线.关口等配置信息呢?有的人看到这个需求,不免窃喜,这不很简单嘛,重新打来bmpn中定 ...
随机推荐
- Istio(十二):Istio问题排查
目录 一.模块概览 二.Envoy基础 2.1 Envoy 基础 三.Envoy示例 四.调试备忘录 4.1 配置 4.2 运行时 4.3 检查 Envoy 日志 4.4 配置 istiod 日志 一 ...
- Instsrv.exe 与 Srvany.exe 安装Windows服务
原理:Instsrv.exe可以给系统安装和删除服务 Srvany.exe可以让exe程序以服务的方式运行(Srvany只是exe注册程序的服务外壳,可以通过它让我们的程序以SYSTEM账户活动,随电 ...
- 【U8】bom全阶 点击展开按钮,无法获得叶子子阶
经查看 是因为 子件的失效日期与生效日期是相同一天,延后子件的失效日期就可以在点击展开按钮后,看到子阶bom了.
- 一个IDEA界面如何同时打开多个项目
第一步:先导入其中一个工程 第二步:点击File->Project Structure 第三步:导入模块 最后点击Apply即可完成一个IDEA界面同时打开多个项目的需求.
- 使用EntityFramework Core和Enums作为字符串的ASP.NET Core Razor页面——第三部分
目录 介绍 使用代码 添加项目和项目状态处理 下载源文件 - 989.1 KB 介绍 这是一篇由多部分组成的文章的第三部分,演示了通过EntityFramework Core 2.1(EF)将C#en ...
- 揭秘华为如此多成功项目的产品关键——Charter模板
很多推行IPD(集成产品开发)体系的公司在正式研发产品前,需要开发Charter,以确保产品研发方向的正确.Charter,即项目任务书或商业计划书.Charter的呈现标志着产品规划阶段的完成,能为 ...
- ES6 ES6变量的声明
// ES6语法 // 是对js影响最大的一个版本更新 // 在 ES6 语法中 退出了很多新的 语法结构 // 就相当于 js 语言, 换了一个新 ...
- Java编码规范-字符串与Integer的比较,BigDecimal非空参数
Java编码规范-字符串与Integer的比较,BigDecimal非空参数 package com.example.core.mydemo; import java.math.BigDecimal; ...
- uniapp 使用z-paging 分页组件 写在头部插槽内的单选按钮无法点击
这个问题是因为组件层级太低 <z-paging ref="paging" v-model="dataList" @query="queryLis ...
- ELKF(elasticsearch、logstash、kibana、filebeat)搭建及收集nginx日志
1.elasticsearch 1.1.根目录下新建data文件夹 1.2.修改elasticsearch.yml文件,添加以下内容 path.data: /home/wwq/elk/elastics ...