python 音频可视化
代码整理好放在 github 上了: https://github.com/darkchii/visualize
bilibili 演示视频:https://www.bilibili.com/video/av77372866 2020-03-23 13:23:01 还是给一个 pydub(需要自己配置好ffmpeg)正确使用姿势,因为 mp3 格式太常见:
import numpy as np

import pyaudio

from pydub import AudioSegment, effects

import matplotlib.pyplot as plt

from matplotlib.animation import FuncAnimation

p = pyaudio.PyAudio()

sound = AudioSegment.from_file(file='../xxx.mp3')

left = sound.split_to_mono()[0]

fs = left.frame_rate

size = len(left.get_array_of_samples())

channels = left.channels

stream = p.open(

    format=p.get_format_from_width(left.sample_width,),

    channels=channels,

    rate=fs,

    # input=True,

    output=True,

)

stream.start_stream()

fig = plt.figure()

ax1, ax2 = fig.subplots(2, 1)

ax1.set_ylim(0, 0.5)

ax2.set_ylim(-1.5, 1.5)

ax1.set_axis_off()

ax2.set_axis_off()

window = int(0.02*fs) # 20ms

f = np.linspace(20, 20*1000, window // 2)

t = np.linspace(0, 20, window)

lf1, = ax1.plot(f, np.zeros(window // 2), lw=1)

lf2, = ax2.plot(t, np.zeros(window), lw=1)

def update(frames):

    if stream.is_active():

        slice = left.get_sample_slice(frames, frames + window)

        data = slice.raw_data

        stream.write(data)

        y = np.array(slice.get_array_of_samples()) / 30000 # 归一化

        yft = np.abs(np.fft.fft(y)) / (window // 2)

        lf1.set_ydata(yft[:window // 2])

        lf2.set_ydata(y)

    return lf1, lf2,

ani = FuncAnimation(fig, update, frames=range(0, size, window), interval=0, blit=True)

plt.show()
截图:
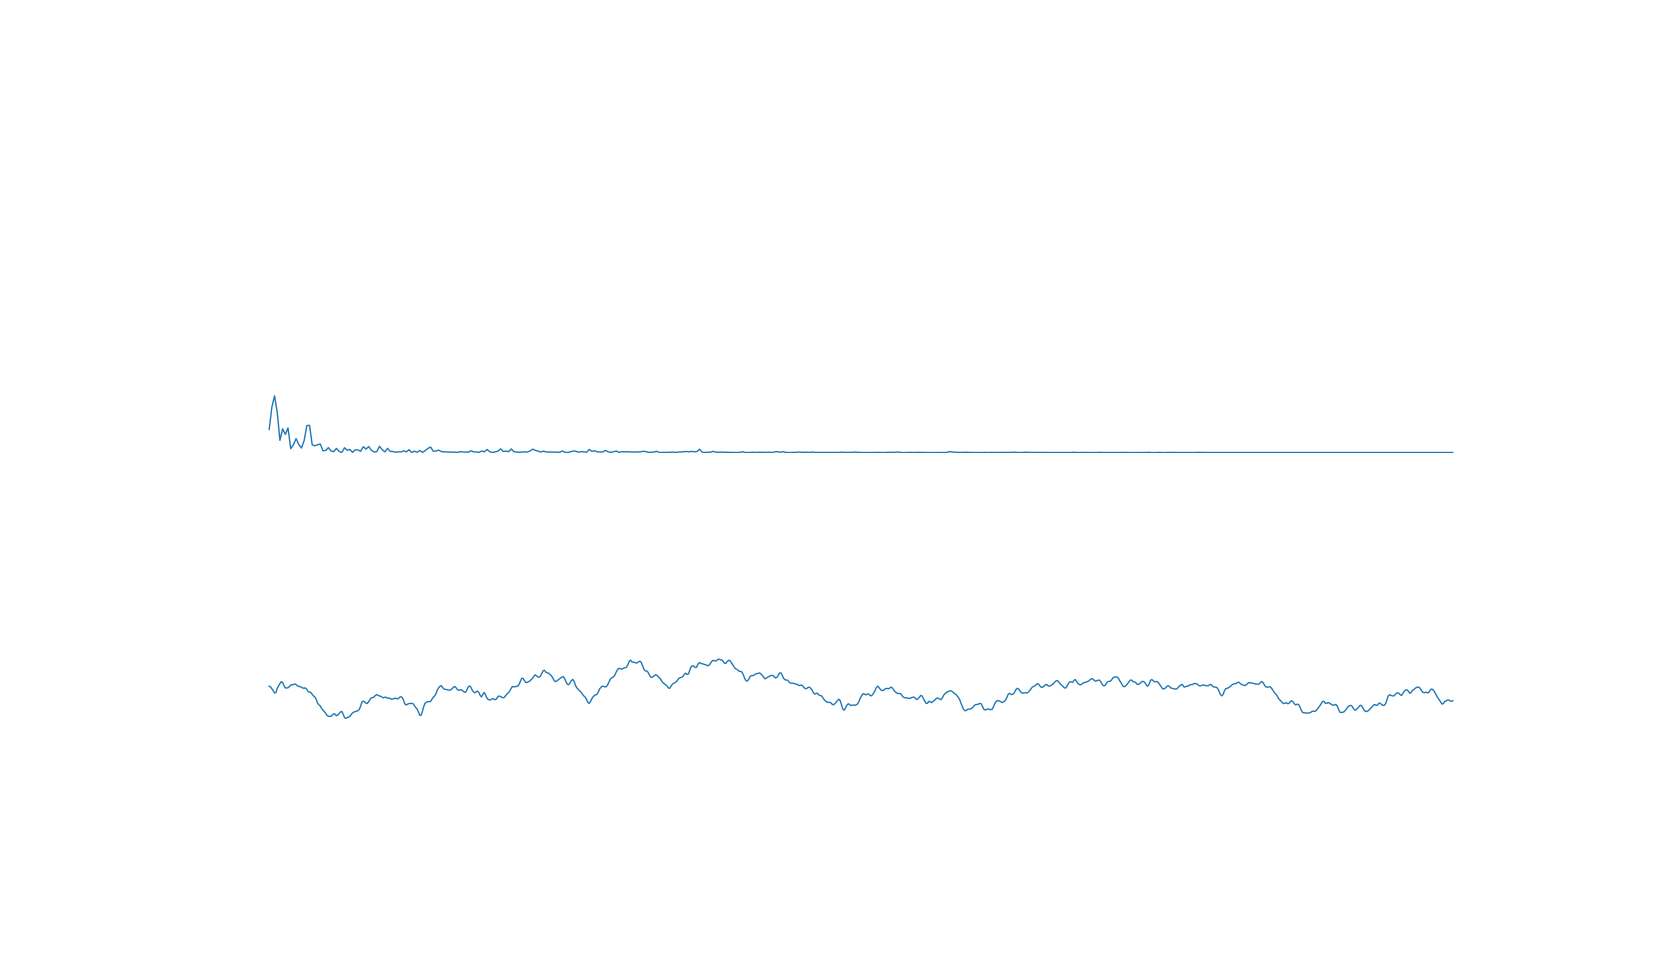
2020-02-25 14:50:27 Animation:
注:pyaudio open 调节参数 format 有惊喜(取值范围{1, 2, 4, 8, 16,...})
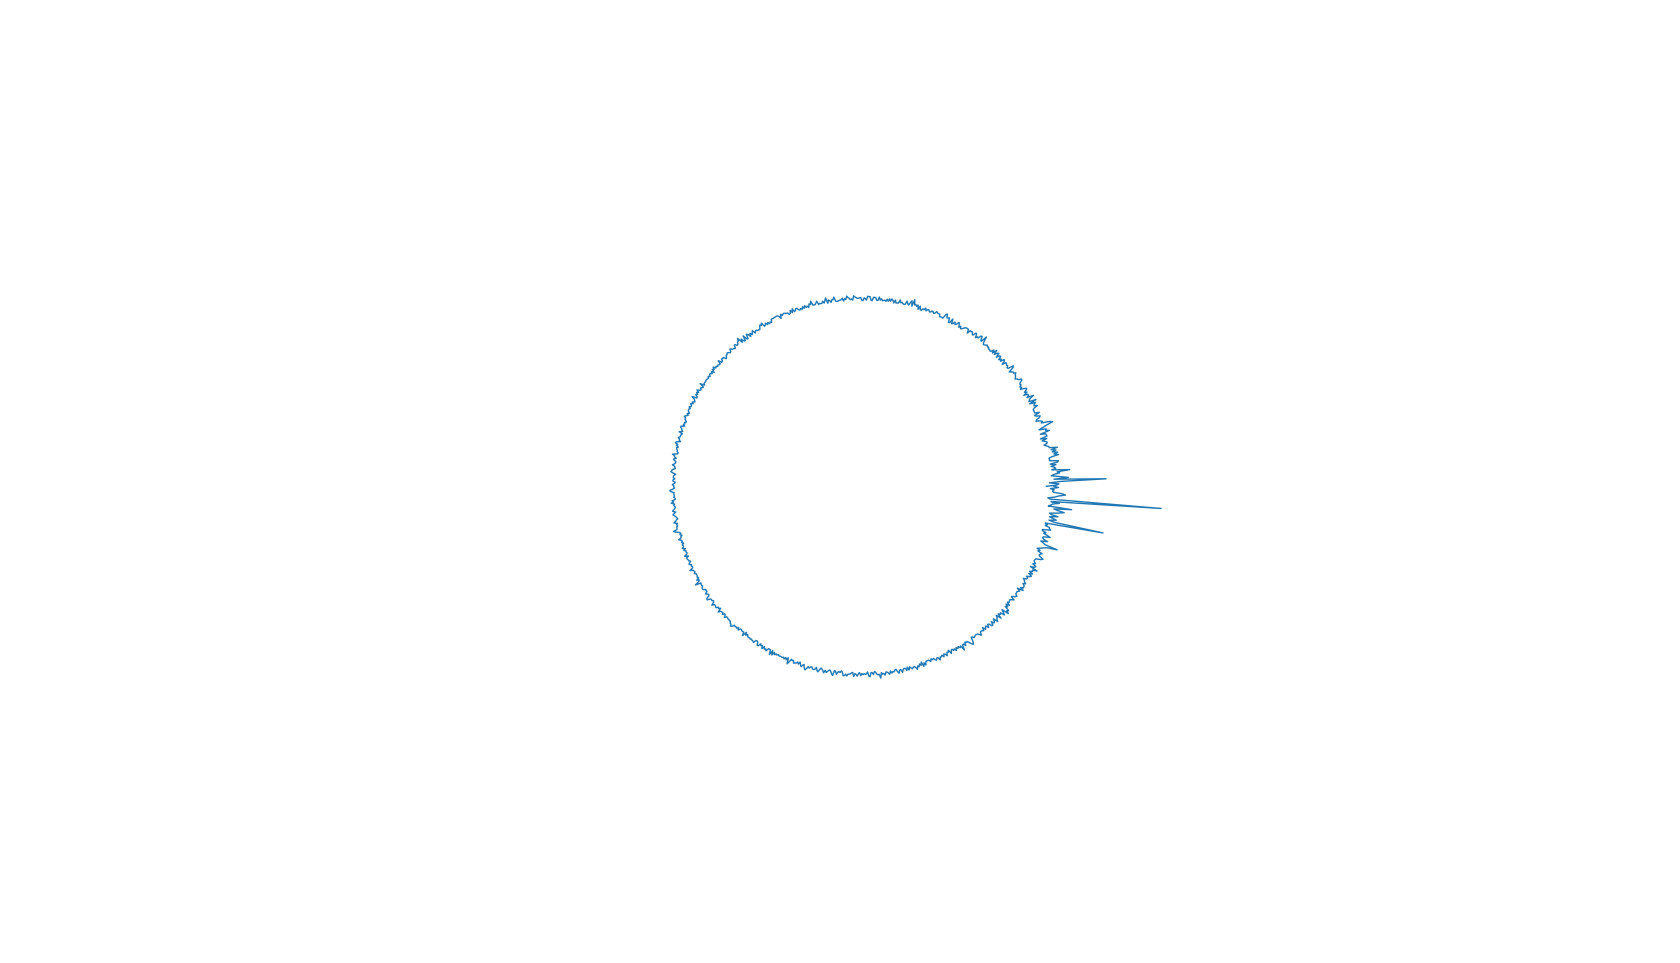
极坐标版:
import matplotlib.pyplot as plt

from scipy.signal import detrend

# from scipy.fftpack import fft

import numpy as np

import pyaudio

from _tkinter import TclError

import struct

import wave

# import librosa

from pydub import AudioSegment

from matplotlib.animation import FuncAnimation

chunk = 1024

p = pyaudio.PyAudio()

# sound = AudioSegment.from_file(file='../Music/xxx.mp3')

# rdata = sound.get_array_of_samples()

wf = wave.open('../Music/xxx.wav')

stream = p.open(

    format=8,

    channels=wf.getnchannels(),

    rate=wf.getframerate(),

    # input=True,

    output=True,

    # frames_per_buffer=chunk

)

fig = plt.figure()

ax = fig.gca(projection='polar')

# ax.set_ylim(0, 1)

ax.set_axis_off()

lf, = ax.plot(np.linspace(0, 2 * np.pi, chunk), np.zeros(chunk), lw=1)

def init():

    stream.start_stream()

    return lf,

def update(frame):

    if stream.is_active():

        data = wf.readframes(chunk)

        stream.write(data)

        data_int = struct.unpack(str(chunk * 4) + 'B', data)

        y_detrend = detrend(data_int)

        yft = np.abs(np.fft.fft(y_detrend))

        y_vals = yft[:chunk] / (chunk * chunk * 4)

        ind = np.where(y_vals > (np.max(y_vals) + np.min(y_vals)) / 2)

        y_vals[ind[0]] *= 2

        lf.set_ydata(y_vals)

    return lf,

ani = FuncAnimation(fig, update, frames=None,

                    init_func=init, interval=0, blit=True)

plt.show()
截图:
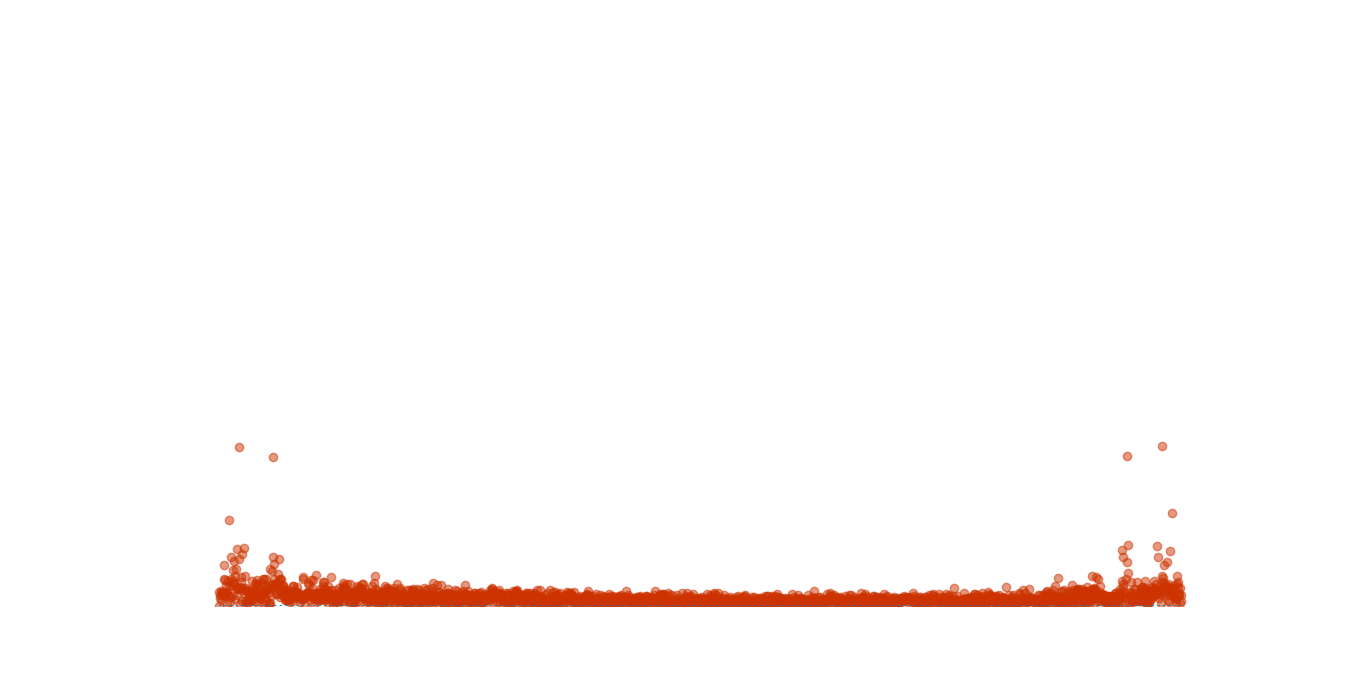
stem 版:
import matplotlib.pyplot as plt

from scipy.signal import detrend

# from scipy.fftpack import fft

import numpy as np

import pyaudio

from _tkinter import TclError

import struct

import wave

# import librosa

from pydub import AudioSegment

from matplotlib.animation import FuncAnimation

chunk = 1024

p = pyaudio.PyAudio()

# sound = AudioSegment.from_file(file='../Music/xxx.mp3')

# rdata = sound.get_array_of_samples()

wf = wave.open('../Music/xxx.wav')

stream = p.open(

    format=8,

    channels=wf.getnchannels(),

    rate=wf.getframerate(),

    # input=True,

    output=True,

    # frames_per_buffer=chunk

)

fig = plt.figure()

ax = fig.gca()

ax.set_ylim(0, 1)

ax.set_axis_off()

lf = ax.stem(np.linspace(20, 20000, chunk), np.zeros(chunk), basefmt=':', use_line_collection=True)

lf.markerline.set_color([0.8, 0.2, 0, 0.5])

def init():

    stream.start_stream()

    return lf

def update(frame):

    if stream.is_active():

        data = wf.readframes(chunk)

        stream.write(data)

        data_int = struct.unpack(str(chunk * 4) + 'B', data)

        y_detrend = detrend(data_int)

        yft = np.abs(np.fft.fft(y_detrend))

        y_vals = yft[:chunk] / (chunk * chunk)

        ind = np.where(y_vals > (np.max(y_vals) + np.min(y_vals)) / 2)

        y_vals[ind[0]] *= 4

        lf.markerline.set_ydata(y_vals)

    return lf

ani = FuncAnimation(fig, update, frames=None,

                    init_func=init, interval=0, blit=True)

plt.show()
semilogx 版:
import matplotlib.pyplot as plt

from scipy.signal import detrend

# from scipy.fftpack import fft

import numpy as np

import pyaudio

from _tkinter import TclError

import struct

import wave

# import librosa

from pydub import AudioSegment

from matplotlib.animation import FuncAnimation

chunk = 1024

p = pyaudio.PyAudio()

# sound = AudioSegment.from_file(file='../Music/xxx.mp3')

# rdata = sound.get_array_of_samples()

wf = wave.open('../Music/xxx.wav')

stream = p.open(

    format=8,

    channels=wf.getnchannels(),

    rate=wf.getframerate(),

    # input=True,

    output=True,

    # frames_per_buffer=chunk

)

fig = plt.figure()

ax = fig.gca()

ax.set_ylim(0, 1)

ax.set_axis_off()

lf, = ax.semilogx(np.linspace(20, 20000, chunk), np.zeros(chunk), lw=1, color='lightblue')

def init():

    stream.start_stream()

    return lf,

def update(frame):

    if stream.is_active():

        data = wf.readframes(chunk)

        stream.write(data)

        data_int = struct.unpack(str(chunk * 4) + 'B', data)

        y_detrend = detrend(data_int)

        yft = np.abs(np.fft.fft(y_detrend))

        y_vals = yft[:chunk] / (chunk * chunk)

        ind = np.where(y_vals > (np.max(y_vals) + np.min(y_vals)) / 2)

        y_vals[ind[0]] *= 4

        lf.set_ydata(y_vals)

    return lf,

ani = FuncAnimation(fig, update, frames=None,

                    init_func=init, interval=0, blit=True)

plt.show()
2020-02-25 12:18:49 更新一下:
这次更新是给一个很勉强的通过音频数据来播放音乐并展示 fft 效果的代码,实际上仅仅只是播放音乐很简单,wav 波形文件只需要 wave 即可,想要 mp3 或者其他支持较广类型的音频文件格式,使用 pydub 包更好.。(更新:使用 pydub 不需要解包,只需要通过 get_array_of_samples() 就可以获取数据,raw_data 是字节数组,用于加载到输出流)
但还是给个代码:
import matplotlib.pyplot as plt

from vispy.plot import Fig

from matplotlib.colors import LightSource

from matplotlib import cm

from scipy.signal import detrend

from scipy.fftpack import fftn

import numpy as np

import pyaudio

from _tkinter import TclError

import struct

import wave

# import librosa

import array

from pydub import AudioSegment

from pydub.utils import get_array_type

chunk = 1024

p = pyaudio.PyAudio()

# sound = AudioSegment.from_file(file='../Music/1563833285950.mp3')

# left = sound.split_to_mono()[1]

# bit_depth = left.sample_width * 8

# array_type = get_array_type(bit_depth)

# numeric_array = array.array(array_type, left.raw_data)

wf = wave.open('../Music/1563833285950.wav')

stream = p.open(

    format=p.get_format_from_width(wf.getsampwidth()),

    channels=wf.getnchannels(),

    rate=wf.getframerate(),

    # input=True,

    output=True,

    # frames_per_buffer=chunk

)

stream.start_stream()

freq = np.linspace(20, 20000, chunk)

yf = np.zeros(chunk)

fig = plt.figure()

ax = fig.gca()

lf, = ax.semilogx(freq, yf, lw=1, color='lightblue')

ax.set_ylim(0, 1)

ax.set_axis_off()

plt.show(block=False)

start = 0

while stream.is_active():

    data = wf.readframes(chunk)

    if len(data) < chunk:

        break

    stream.write(data)

    data_int = struct.unpack(str(chunk * 4) + 'B', data)

    y_detrend = detrend(data_int)

    yft = np.abs(fftn(y_detrend))

    y_vals = yft[:chunk] / (128 * chunk)

    lf.set_ydata(y_vals)

    try:

        ax.figure.canvas.draw()

        ax.figure.canvas.flush_events()

    except TclError:

        stream.stop_stream()

        stream.close()

        break
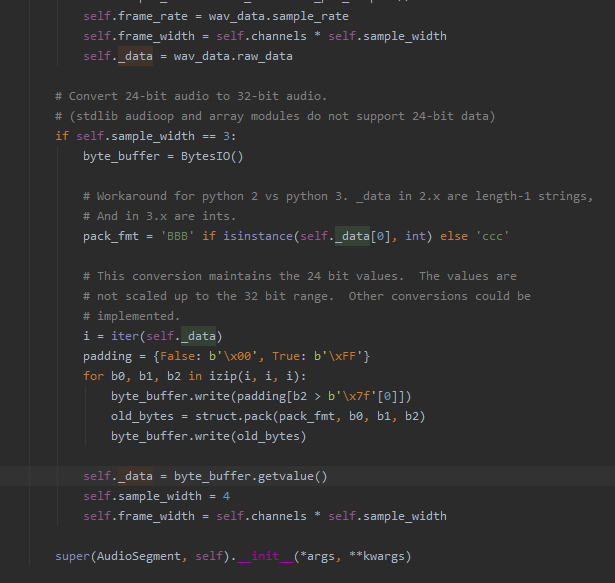
给个 pydub 将数据合成到包的源码截图:
2019-12-31 15:45:34 再来一个:
极坐标版:
import matplotlib.pyplot as plt

from matplotlib.colors import LightSource

from matplotlib import cm

from scipy.signal import detrend

import numpy as np

import pyaudio

from _tkinter import TclError

import struct

channels = 1

rate = 48000

chunk = 2048

p = pyaudio.PyAudio()

stream = p.open(

    format=pyaudio.paInt16,

    channels=channels,

    rate=rate,

    input=True,

    frames_per_buffer=chunk

)

stream.start_stream()

theta = np.linspace(0.0, rate, chunk)

radii = np.zeros(chunk)

fig = plt.figure()

ax = fig.gca(projection='polar')

lf = ax.stem(theta, radii, basefmt=':', use_line_collection=True)

lf.markerline.set_color([0.8, 0.2, 0, 0.5])

ax.set_rorigin(0)

ax.set_axis_off()

plt.show(block=False)

while stream.is_active():

    data = stream.read(chunk)

    data_int = struct.unpack(str(chunk * 2) + 'B', data)

    y_detrend = detrend(data_int)

    yft = np.abs(np.fft.fft(y_detrend))

    y_vals = yft[:chunk] / (128 * chunk)

    lf.markerline.set_ydata(y_vals)

    try:

        ax.figure.canvas.draw()

        ax.figure.canvas.flush_events()

    except TclError:

        stream.stop_stream()

        stream.close()

        break
笛卡尔直角坐标版:
import matplotlib.pyplot as plt

from matplotlib.colors import LightSource

from matplotlib import cm

from scipy.signal import detrend

import numpy as np

import pyaudio

from _tkinter import TclError

import struct

channels = 1

rate = 48000

chunk = 2048

p = pyaudio.PyAudio()

stream = p.open(

    format=pyaudio.paInt16,

    channels=channels,

    rate=rate,

    input=True,

    frames_per_buffer=chunk

)

stream.start_stream()

theta = np.linspace(0.0, rate, chunk)

radii = np.zeros(chunk)

fig = plt.figure()

ax = fig.gca()

lf = ax.stem(theta, radii, basefmt=':', use_line_collection=True)

lf.markerline.set_color([0.8, 0.2, 0, 0.5])

ax.set_ylim(0, 1)

ax.set_axis_off()

plt.show(block=False)

while stream.is_active():

    data = stream.read(chunk)

    data_int = struct.unpack(str(chunk * 2) + 'B', data)

    y_detrend = detrend(data_int)

    yft = np.abs(np.fft.fft(y_detrend))

    y_vals = yft[:chunk] / (128 * chunk)

    lf.markerline.set_ydata(y_vals)

    try:

        ax.figure.canvas.draw()

        ax.figure.canvas.flush_events()

    except TclError:

        stream.stop_stream()

        stream.close()

        break
运行截图:
2019-12-30 14:05:57 再来更新一个版本(可惜我的电脑跑起来非常卡):
from scipy.signal import detrend

import numpy as np

import pyaudio

from _tkinter import TclError

import struct

channels = 1

rate = 48000

chunk = 2048

p = pyaudio.PyAudio()

stream = p.open(

    format=pyaudio.paInt16,

    channels=channels,

    rate=rate,

    input=True,

    frames_per_buffer=chunk

)

stream.start_stream()

theta = np.linspace(0.0, 2. * np.pi, chunk, endpoint=False)

radii = np.zeros(chunk)

fig = plt.figure()

ax = fig.gca(projection='polar')

lf = ax.bar(x=theta, height=radii, width=0.02, bottom=-2.0, alpha=0.5)

ax.set_axis_off()

plt.show(block=False)

while stream.is_active():

    data = stream.read(chunk)

    data_int = struct.unpack(str(chunk * 2) + 'B', data)

    y_detrend = detrend(data_int)

    yft = np.abs(np.fft.fft(y_detrend))

    y_vals = yft[:chunk] / (128 * chunk)

    for rect, y_val, color in zip(lf.patches, y_vals, plt.cm.Spectral(y_vals * 8)):

        rect.set_height(y_val)

        rect.set_facecolor(color)

    try:

        ax.figure.canvas.draw()

        ax.figure.canvas.flush_events()

    except TclError:

        stream.stop_stream()

        stream.close()

        break
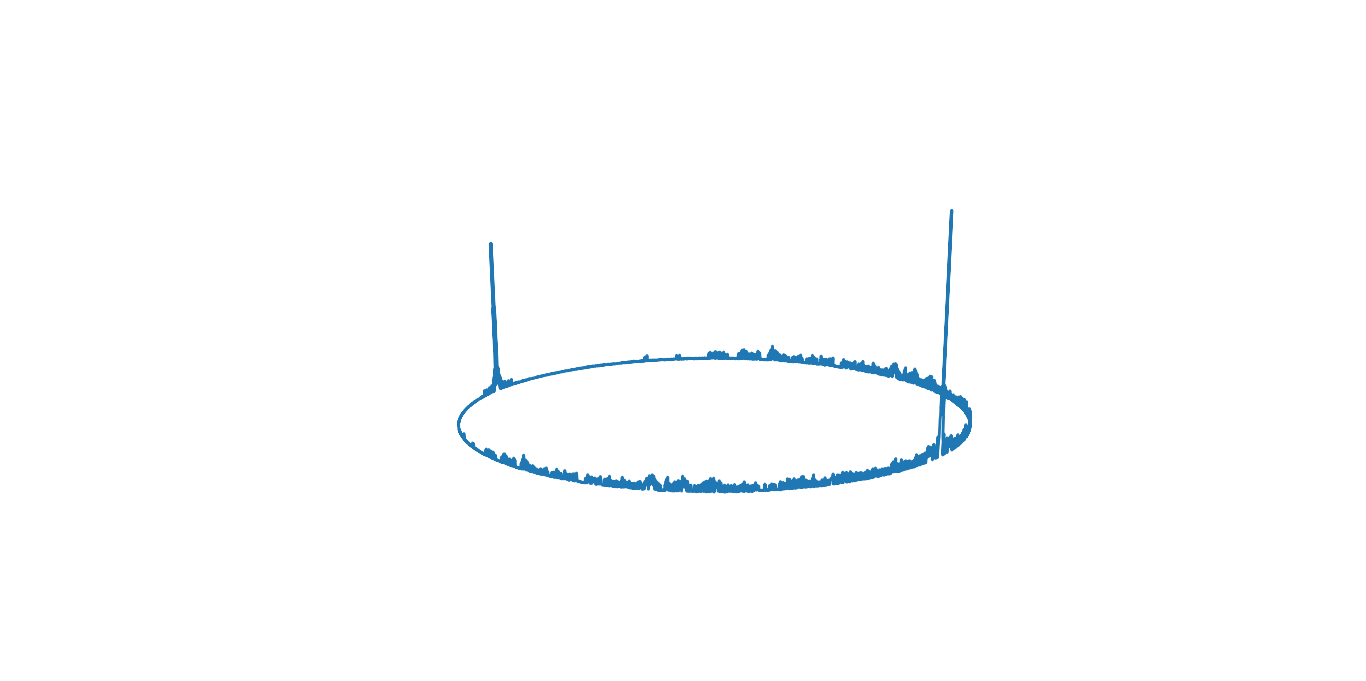
2019-11-28 20:58:07 更新,围绕在圆环上的2d 版(一开始sb了,直接加在 y 轴上 = =,幸好马上意识到需要做向量旋转):
from _tkinter import TclError

import pyaudio

import numpy as np

import matplotlib.pyplot as plt

import struct

from scipy.signal import savgol_filter, detrend, lfilter

channels = 1

rate = 48000

chunk = 1024 * 2

p = pyaudio.PyAudio()

stream = p.open(

    format=pyaudio.paInt16,

    channels=channels,

    rate=rate,

    input=True,

    # output=True,

    frames_per_buffer=chunk

)

stream.start_stream()

R = 2

t = np.linspace(0, 2*np.pi, chunk * 2)

xf = R*np.cos(t)

yf = R*np.sin(t)

fig, ax = plt.subplots(figsize=(7, 7))

lf, = ax.plot(xf, yf, lw=1)

ax.set_xlim(-3, 3)

ax.set_ylim(-3, 3)

ax.set_axis_off()

plt.show(block=False)

fwhm = 20

while stream.is_active():

    data = stream.read(chunk)

    data_int = struct.unpack(str(chunk * 2) + 'B', data)

    y_detrend = detrend(data_int)

    # z_smooth = savgol_filter(data_int, window_length=len(data_int) - 1, mode='valid')

    # box = np.ones(fwhm) / fwhm

    # z_smooth = np.convolve(y_detrend, box, mode='valid')

    yft = np.abs(np.fft.fft(y_detrend))

    y_vals = yft / (256 * chunk)

    ind = np.where(y_vals > np.mean(y_vals))

    y_vals[ind[0]] *= 4

    lf.set_xdata(xf + y_vals * np.cos(t))

    lf.set_ydata(yf + y_vals * np.sin(t))

    try:

        ax.figure.canvas.draw()

        ax.figure.canvas.flush_events()

    except TclError:

        stream.stop_stream()

        stream.close()

        break
运行截图:

2019-11-28 16:47:13 更新,3D 版:
from _tkinter import TclError

import pyaudio

import numpy as np

import matplotlib.pyplot as plt

import struct

from scipy.signal import savgol_filter, detrend, lfilter

channels = 1

rate = 48000

chunk = 1024 * 2

p = pyaudio.PyAudio()

stream = p.open(

    format=pyaudio.paInt16,

    channels=channels,

    rate=rate,

    input=True,

    # output=True,

    frames_per_buffer=chunk

)

stream.start_stream()

R = 20

t = np.linspace(0, 2*np.pi, chunk * 2)

xf = R*np.cos(t)

yf = R*np.sin(t)

# fig, ax = plt.subplots(figsize=(14, 5))

fig = plt.figure()

ax = fig.gca(projection='3d')

lf, = ax.plot(xf, yf, np.zeros(chunk * 2), lw=2)

# ax.set_xlim(20, rate / 2)

# ax.set_ylim(20, rate / 2)

ax.set_zlim(-0.2, 1.2)

ax.set_axis_off()

plt.show(block=False)

fwhm = 20

while stream.is_active():

    data = stream.read(chunk)

    data_int = struct.unpack(str(chunk * 2) + 'B', data)

    z_detrend = detrend(data_int)

    # z_smooth = savgol_filter(data_int, window_length=len(data_int) - 1, mode='valid')

    # box = np.ones(fwhm) / fwhm

    # z_smooth = np.convolve(z_detrend, box, mode='valid')

    zf = np.abs(np.fft.fft(z_detrend))

    z_vals = zf / (256 * chunk)

    ind = np.where(z_vals > np.mean(z_vals))

    z_vals[ind[0]] *= 4

    lf.set_xdata(xf)

    lf.set_ydata(yf)

    lf.set_3d_properties(z_vals)

    try:

        ax.figure.canvas.draw()

        ax.figure.canvas.flush_events()

    except TclError:

        stream.stop_stream()

        stream.close()

        break
运行截图:
23:27:12 更新,为了更加突出重要的频率,我又加了一些代码,就是把振幅大于平均值的那些振幅加倍,主要代码如下:
y_vals = yf[:chunk] / (256 * chunk)

ind = np.where(y_vals > np.mean(y_vals))

y_vals[ind[0]] *= 4

lf.set_ydata(y_vals)
22:17:15 更新,因为 python 3.8 和 scipy 暂时不兼容,所以用不了scipy 对信号做平滑处理,不过网上找了一段代码,效率不错,这是链接,或者直接把下面代码加到合适的地方。
width = 20

box = np.ones(width) / width

y_smooth = np.convolve(data_int, box, mode='same')

yf = np.fft.fft(y_smooth)

...
21:58:43 更新,测试了一下对原始信号做平滑处理,发现效率十分低,完全没法看效果,不过目前用的是自己实现的高斯滤波算法。。。
以下为原文
这里的简单原理就是获取输入输出设备中的数据(注意驱动什么的没有问题,能用麦克风),然后 matplotlib 绘制出来,想要看到音乐的节奏振动就再 fft 一下。至于如何不断更新波形,matplotlib 有一个 animation 方法可以用(见下面第二种方法),但实际上我用了之后发现显示效果不如第一种(可能是姿势不对)。之前用 matlab 做的,也很不错。
第一种方法(波形显示更流畅,代码参考这个视频):
from _tkinter import TclError

import pyaudio

import numpy as np

import matplotlib.pyplot as plt

import struct

channels = 1

rate = 44100

chunk = 1024 * 2

p = pyaudio.PyAudio()

stream = p.open(

    format=pyaudio.paInt16,

    channels=channels,

    rate=rate,

    input=True,

    output=True,

    frames_per_buffer=chunk

)

stream.start_stream()

xf = np.linspace(0, rate, chunk)

fig, ax = plt.subplots()

lf, = ax.semilogx(xf, np.zeros(chunk), '-', lw=1)

ax.set_xlim(20, rate / 2)

ax.set_ylim(0, 1)

plt.show(block=False)

while stream.is_active():

    data = stream.read(chunk)

    data_int = struct.unpack(str(chunk * 2) + 'B', data)

    yf = np.fft.fft(data_int)

    lf.set_ydata(np.abs(yf[:chunk]) / (128 * chunk))

    try:

        ax.figure.canvas.draw()

        ax.figure.canvas.flush_events()

    except TclError:

        stream.stop_stream()

        stream.close()

        break
第二种方法:
import pyaudio

import numpy as np

# from scipy.fftpack import fft

import matplotlib.pyplot as plt

import struct

from matplotlib.animation import FuncAnimation

channels = 1

rate = 44100

chunk = 1024 * 2

p = pyaudio.PyAudio()

stream = p.open(

    format=pyaudio.paInt16,

    channels=channels,

    rate=rate,

    input=True,

    output=True,

)

stream.start_stream()

x = np.arange(0, 2*chunk, 2)

xf = np.linspace(0, rate, chunk)

fig, (ax1, ax2) = plt.subplots(2)

l, = ax1.plot(x, np.zeros(chunk), '-', lw=1)

lf, = ax2.semilogx(xf, np.zeros(chunk), '-', lw=1)

ax1.set_xlim(0, 2*chunk)

ax1.set_ylim(0, 255)

ax2.set_xlim(20, rate / 2)

ax2.set_ylim(0, 1)

plt.setp(ax1, xticks=[0, chunk, 2 * chunk], yticks=[0, 128, 255])

def gen():

    while stream.is_active():

        data = stream.read(chunk)

        data_int = struct.unpack(str(chunk*2) + 'B', data)

        data_np = np.array(data_int, dtype='b')[::2] + 128

        yf = np.fft.fft(data_int)

        yield data_np, yf

def init():

    lf.set_ydata(np.random.rand(chunk))

    return lf,

def update(data):

    ax1.figure.canvas.draw()

    ax2.figure.canvas.draw()

    l.set_ydata(data[0])

    lf.set_ydata(np.abs(data[1][:chunk]) / (128 * chunk))

    return lf,

animate = FuncAnimation(fig, update, gen, blit=True, interval=0, repeat=False, init_func=init)

plt.show()

stream.stop_stream()

stream.close()
python 音频可视化的更多相关文章
- Python数据可视化编程实战——导入数据
1.从csv文件导入数据 原理:with语句打开文件并绑定到对象f.不必担心在操作完资源后去关闭数据文件,with的上下文管理器会帮助处理.然后,csv.reader()方法返回reader对象,通过 ...
- Python数据可视化——使用Matplotlib创建散点图
Python数据可视化——使用Matplotlib创建散点图 2017-12-27 作者:淡水化合物 Matplotlib简述: Matplotlib是一个用于创建出高质量图表的桌面绘图包(主要是2D ...
- 【转】Python——plot可视化数据,作业8
Python——plot可视化数据,作业8(python programming) subject1k和subject1v的形状相同 # -*- coding: utf-8 -*- import sc ...
- Python数据可视化-seaborn库之countplot
在Python数据可视化中,seaborn较好的提供了图形的一些可视化功效. seaborn官方文档见链接:http://seaborn.pydata.org/api.html countplot是s ...
- Python数据可视化编程实战pdf
Python数据可视化编程实战(高清版)PDF 百度网盘 链接:https://pan.baidu.com/s/1vAvKwCry4P4QeofW-RqZ_A 提取码:9pcd 复制这段内容后打开百度 ...
- [Python] Python 学习 - 可视化数据操作(一)
Python 学习 - 可视化数据操作(一) GitHub:https://github.com/liqingwen2015/my_data_view 目录 折线图 散点图 随机漫步 骰子点数概率 文 ...
- 【数据科学】Python数据可视化概述
注:很早之前就打算专门写一篇与Python数据可视化相关的博客,对一些基本概念和常用技巧做一个小结.今天终于有时间来完成这个计划了! 0. Python中常用的可视化工具 Python在数据科学中的地 ...
- Python数据可视化的四种简易方法
摘要: 本文讲述了热图.二维密度图.蜘蛛图.树形图这四种Python数据可视化方法. 数据可视化是任何数据科学或机器学习项目的一个重要组成部分.人们常常会从探索数据分析(EDA)开始,来深入了解数据, ...
- python --数据可视化(一)
python --数据可视化 一.python -- pyecharts库的使用 pyecharts--> 生成Echarts图标的类库 1.安装: pip install pyecharts ...
随机推荐
- Qt编写的项目作品3-输入法V2018
一.功能特点 未采用Qt系统层输入法框架,独创输入切换机制. 纯QWidget编写,支持任何目标平台(亲测windows.linux.嵌入式linux等),支持任意Qt版本(亲测Qt4.6.0到Qt5 ...
- JS高阶编程技巧--柯理化函数
首先看一段代码: let obj = { x: 100 }; function fn(y) { this.x += y; console.log(this); } 现在有一个需求:在1秒后,执行函数f ...
- tomcat - 解决 org.bouncycastle.asn1.ASN1Boolean 非法循环依赖的错误
背景 记录遇到一次奇怪的错误,在发布war包到Tomcat的时候,出现了org.bouncycastle.asn1.ASN1Boolean非法循环依赖的错误. INFO: Deploying web ...
- BundlePhobia
1.BundlePhobia用于分析npm package的依赖.bundle后的大小.下载速度预估等等,帮助你在引用一个package之前了解引入该package的代价. 2.也可以将项目的pack ...
- Python数值运算
算术运算 a=10 b=2 + 加-两个对象相加 a+b输出结果12 - 减-得到负数或是一个数减去另一个数 a - b输出结果8 * 乘-两个数相乘或是返回一个被重复若干次的字符串 a * b输出结 ...
- pyjsonrpc的使用
pyjsonrpc的使用 客户端 JsonRpcClient.py #!usr/bin/env python2.7 # -*- coding: utf-8 -*- import ssl import ...
- thinkphp5.0 insert添加数据
首先引入文件:use think\Db; public function zhuce(){ $username = input("username");//手机号 $passwor ...
- Tomcat目录详解
最近在项目部署时,有时通过使用公司提供的Jdoc容器引擎部署上线项目,有时使用Jenkins自动化部署,甚至有的项目直接打war包上传到弹性云的tomcat中进行部署.虽然部署方式略有不同,但是归根结 ...
- youhua
- Spring学习-依赖注入
Spring是基于IOC与AOP的框架,而其中的IOC(Inversion of Control)即反转控制是Spring的基础. 在以前学过的知识中,一个新的对象全部为自己手动new出来的,而在Sp ...