Python数据可视化——使用Matplotlib创建散点图
Python数据可视化——使用Matplotlib创建散点图
2017-12-27
作者:淡水化合物
| 飞行里程数 | 游戏耗时百分比 | 冰淇淋公升数 | 分类结果 |
| 40920 | 8.326976 | 0.953952 | 3 |
| 14488 | 7.153469 | 1.673904 | 2 |
| 26052 | 1.441871 | 0.805124 | 1 |
| ...... | ...... | ...... | ...... |
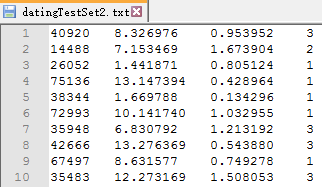
数据在datingTestSet2.txt文件中的格式如下所示:
from numpy import *

def file2matrix(filename):

    fr = open(filename)

    numberOfLines = len(fr.readlines()) # get the number of lines in the file

    returnMat = zeros((numberOfLines, 3)) # prepare matrix to return

    classLabelVector = []  # prepare labels return

    fr = open(filename)

    index = 0

    for line in fr.readlines():

        line = line.strip()

        listFromLine = line.split('\t')

        returnMat[index, :] = listFromLine[0:3]

        classLabelVector.append(int(listFromLine[-1]))

        index += 1

    return returnMat, classLabelVector
使用file2matrix读取文件数据,必须确保待解析文件存储在当前的工作目录中。导入数据之后,简单检查一下数据格式:
>>>import kNN

>>>datingDataMat,datingLabels = kNN.file2matrix('datingTestSet2.txt')

>>>datingDataMat[0:6]

array([[  4.09200000e+04,   8.32697600e+00,   9.53952000e-01],

       [  1.44880000e+04,   7.15346900e+00,   1.67390400e+00],

       [  2.60520000e+04,   1.44187100e+00,   8.05124000e-01],

       [  7.51360000e+04,   1.31473940e+01,   4.28964000e-01],

       [  3.83440000e+04,   1.66978800e+00,   1.34296000e-01],

       [  7.29930000e+04,   1.01417400e+01,   1.03295500e+00]])

>>> datingLabels[0:6]

[3, 2, 1, 1, 1, 1]
分析数据:使用Matplotlib创建散点图
>>> import matplotlib
>>> import matplotlib.pyplot as plt
>>> fig = plt.figure()
>>> ax = fig.add_subplot(111)
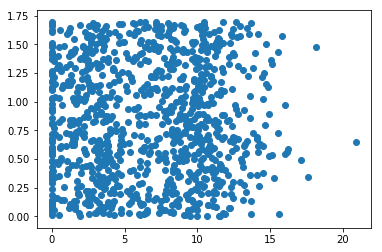
>>> ax.scatter(datingDataMat[:,1],datingDataMat[:,2])
<matplotlib.collections.PathCollection object at 0x0000019E14C9A470>
>>> plt.show()
>>>
生成的散点图如下:
import matplotlib

import numpy as np

from numpy import *

from matplotlib import pyplot as plt

def file2matrix(filename):

    fr = open(filename)

    numberOfLines = len(fr.readlines())  # get the number of lines in the file

    returnMat = zeros((numberOfLines, 3))  # prepare matrix to return

    classLabelVector = []  # prepare labels return

    fr = open(filename)

    index = 0

    for line in fr.readlines():

        line = line.strip()

        listFromLine = line.split('\t')

        returnMat[index, :] = listFromLine[0:3]

        classLabelVector.append(int(listFromLine[-1]))

        index += 1

    return returnMat, classLabelVector

datingDataMat,datingLabels = file2matrix('datingTestSet2.txt')

fig = plt.figure()

ax = plt.subplot(111)

ax.scatter(datingDataMat[:,1],datingDataMat[:,2])

plt.show()
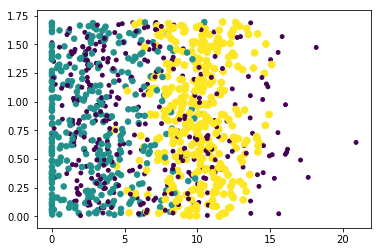
上图由于没有使用样本分类的特征值,很难看到任何有用的数据模式信息。为了更好理解数据信息,Matplotlib库提供的scatter函数支持个性化标记散点图上的点。调用scatter函数使用下列参数:
ax.scatter(datingDataMat[:,1],datingDataMat[:,2],15.0*array(datingLabels),15.0*array(datingLabels))
生成的散点图如下:
import matplotlib
import numpy as np
from numpy import *
from matplotlib import pyplot as plt
from matplotlib.font_manager import FontProperties def file2matrix(filename):
fr = open(filename)
numberOfLines = len(fr.readlines()) # get the number of lines in the file
returnMat = zeros((numberOfLines, 3)) # prepare matrix to return
classLabelVector = [] # prepare labels return
fr = open(filename)
index = 0
for line in fr.readlines():
line = line.strip()
listFromLine = line.split('\t')
returnMat[index, :] = listFromLine[0:3]
classLabelVector.append(int(listFromLine[-1]))
index += 1
return returnMat, classLabelVector
zhfont = FontProperties(fname='C:/Windows/Fonts/simsun.ttc',size=12) datingDataMat,datingLabels = file2matrix('datingTestSet2.txt')
fig = plt.figure() plt.figure(figsize=(8, 5), dpi=80)
ax = plt.subplot(111) datingLabels = np.array(datingLabels)
idx_1 = np.where(datingLabels==1)
p1 = ax.scatter(datingDataMat[idx_1,0],datingDataMat[idx_1,1],marker = '*',color = 'r',label='',s=10)
idx_2 = np.where(datingLabels==2)
p2 = ax.scatter(datingDataMat[idx_2,0],datingDataMat[idx_2,1],marker = 'o',color ='g',label='',s=20)
idx_3 = np.where(datingLabels==3)
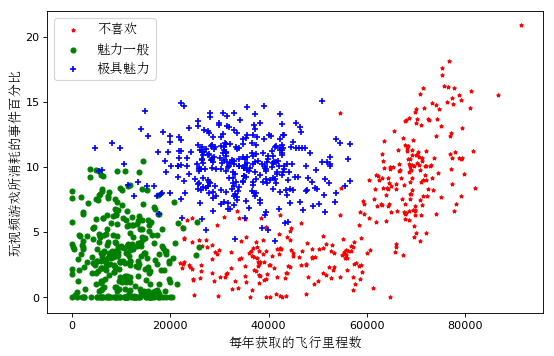
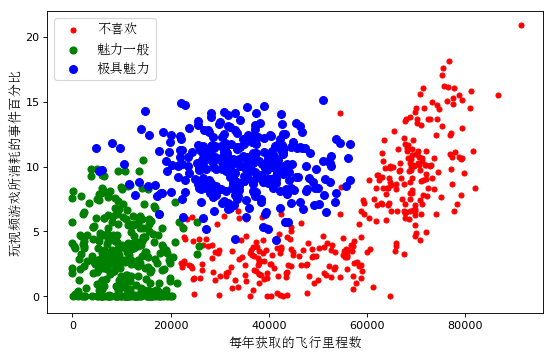
p3 = ax.scatter(datingDataMat[idx_3,0],datingDataMat[idx_3,1],marker = '+',color ='b',label='',s=30) plt.xlabel(u'每年获取的飞行里程数', fontproperties=zhfont)
plt.ylabel(u'玩视频游戏所消耗的事件百分比', fontproperties=zhfont)
ax.legend((p1, p2, p3), (u'不喜欢', u'魅力一般', u'极具魅力'), loc=2, prop=zhfont)
plt.show()
生成的散点图如下:
第二种方法:
import matplotlib

from matplotlib import pyplot as plt

from matplotlib import font_manager

def file2matrix(filename):

    fr = open(filename)

    numberOfLines = len(fr.readlines())  # get the number of lines in the file

    returnMat = zeros((numberOfLines, 3))  # prepare matrix to return

    classLabelVector = []  # prepare labels return

    fr = open(filename)

    index = 0

    for line in fr.readlines():

        line = line.strip()

        listFromLine = line.split('\t')

        returnMat[index, :] = listFromLine[0:3]

        classLabelVector.append(int(listFromLine[-1]))

        index += 1

    return returnMat, classLabelVector

matrix, labels = file2matrix('datingTestSet2.txt')

zhfont = matplotlib.font_manager.FontProperties(fname='C:/Windows/Fonts/simsun.ttc',size=12)

plt.figure(figsize=(8, 5), dpi=80)

axes = plt.subplot(111)

# 将三类数据分别取出来

# x轴代表飞行的里程数

# y轴代表玩视频游戏的百分比

type1_x = []

type1_y = []

type2_x = []

type2_y = []

type3_x = []

type3_y = []

for i in range(len(labels)):

    if labels[i] == 1:  # 不喜欢

        type1_x.append(matrix[i][0])

        type1_y.append(matrix[i][1])

    if labels[i] == 2:  # 魅力一般

        type2_x.append(matrix[i][0])

        type2_y.append(matrix[i][1])

    if labels[i] == 3:  # 极具魅力

        #print (i, ':', labels[i], ':', type(labels[i]))

        type3_x.append(matrix[i][0])

        type3_y.append(matrix[i][1])

type1 = axes.scatter(type1_x, type1_y, s=20, c='red')

type2 = axes.scatter(type2_x, type2_y, s=40, c='green')

type3 = axes.scatter(type3_x, type3_y, s=50, c='blue')

plt.xlabel(u'每年获取的飞行里程数', fontproperties=zhfont)

plt.ylabel(u'玩视频游戏所消耗的事件百分比', fontproperties=zhfont)

axes.legend((type1, type2, type3), (u'不喜欢', u'魅力一般', u'极具魅力'), loc=2, prop=zhfont)

plt.show()
生成的散点图如下:
# -*- coding: utf-8 -*-

import matplotlib.pyplot as plt

import matplotlib

zhfont1 = matplotlib.font_manager.FontProperties(fname='C:/Windows/Fonts/simsun.ttc')

plt.xlabel(u"横坐标xlabel",fontproperties=zhfont1)
到C:\Windows\Fonts\中找到新宋体对应的字体文件simsun.ttf(Window 8和Windows10系统是simsun.ttc,也可以使用其他字体)
Python数据可视化——使用Matplotlib创建散点图的更多相关文章
- python 数据可视化(matplotlib)
matpotlib 官网 :https://matplotlib.org/index.html matplotlib 可视化示例:https://matplotlib.org/gallery/inde ...
- Python数据可视化库-Matplotlib(一)
今天我们来学习一下python的数据可视化库,Matplotlib,是一个Python的2D绘图库 通过这个库,开发者可以仅需要几行代码,便可以生成绘图,直方图,功率图,条形图,错误图,散点图等等 废 ...
- Python数据可视化之Matplotlib实现各种图表
数据分析就是将数据以各种图表的形式展现给领导,供领导做决策用,因此熟练掌握饼图.柱状图.线图等图表制作是一个数据分析师必备的技能.Python有两个比较出色的图表制作框架,分别是Matplotlib和 ...
- Python数据可视化利器Matplotlib,绘图入门篇,Pyplot介绍
Pyplot matplotlib.pyplot是一个命令型函数集合,它可以让我们像使用MATLAB一样使用matplotlib.pyplot中的每一个函数都会对画布图像作出相应的改变,如创建画布.在 ...
- Python数据可视化之matplotlib
常用模块导入 import numpy as np import matplotlib import matplotlib.mlab as mlab import matplotlib.pyplot ...
- 《机器学习实战》2.2.2分析数据:使用matplotlib创建散点图
#输出散点图 def f(): datingDataMat,datingLabels = file2matrix("datingTestSet3.txt") fig = plt.f ...
- Python数据可视化库-Matplotlib(二)
我们接着上次的继续讲解,先讲一个概念,叫子图的概念. 我们先看一下这段代码 import matplotlib.pyplot as plt fig = plt.figure() ax1 = fig.a ...
- python数据可视化(matplotlib)
- Python的可视化包 – Matplotlib 2D图表(点图和线图,.柱状或饼状类型的图),3D图表(曲面图,散点图和柱状图)
Python的可视化包 – Matplotlib Matplotlib是Python中最常用的可视化工具之一,可以非常方便地创建海量类型地2D图表和一些基本的3D图表.Matplotlib最早是为了可 ...
随机推荐
- oracle一些基本命令
Oracle安装配置 设置四个账户及对应的密码 No. 用户名 口令 1 sys change_on_install 2 system manager 3 scott tiget 4 sh sh 上面 ...
- 基于Spring开发的一个BIO-RPC框架(对新人很友好)
PART1:先来整体看下项目的构成 其中bio-rpc-core就是所谓的rpc框架 bio-rpc-example-client即所谓的服务调用方(你的项目中想要调用服务的地方) bio-rpc-e ...
- TQ2440在Ubuntu16.04上如何搭建DNW烧写环境
八月份国赛比完,原计划开始的嵌入式Linux学习一直拖到了现在:由于之前所有的开发全在Windows下进行的,对各种底层完全不清楚,刚好这段时间开始学习Linux,我就在想能不能把开发环境给迁移到Li ...
- JQuery使用笔记
1.选择器 id选择器: $('#btnShow') class选择器: $('.banner') tag选择器: $('input') 2.常用方法 取 / 设value: $('#btnShow' ...
- Swarm 如何实现 Failover?- 每天5分钟玩转 Docker 容器技术(98)
故障是在所难免的,容器可能崩溃,Docker Host 可能宕机,不过幸运的是,Swarm 已经内置了 failover 策略. 创建 service 的时候,我们没有告诉 swarm 发生故障时该如 ...
- php将html转为图片
在服务器端解析将编译好的html转换为图片. 由于html一般由客户端浏览器解析,服务器端不能直接解析html代码.所以我们需要借助php类库及扩展完成这一需求. 文件转换过程为 html -> ...
- HTML5开发必备的工具
现在除了移动APP开发之外,比较火的就是html5开发了,现阶段的HTML5被看做是Web开发者创建流行web应用的利器,增加了对视频和Canvas2D的支持,它的优点就是可以跨平台使用,比如你是开发 ...
- 常用接口简析2---IComparable和IComparer接口的简析
常用接口的解析(链接) 1.IEnumerable深入解析 2.IEnumerable.IEnumerator接口解析 3.IList.IList接口解析 默认情况下,对象的Equals(object ...
- Less的!important关键字
Less的!important关键字 在调用 mixin 时,如果在后面追加 !important 关键字,就可以将 mixin 里面的所有属性都标记为 !important.如,以下Less代码: ...
- ABAP中的AMDP(ABAP-Managed Database Procedures )
ABAP管理下的数据库存储过程(ABAP-Managed Database Procedure,以下简称AMDP)是在APAP on SAP HANA开发中的一种优化模式.AMDP使用数据库语言书写, ...