sklearn线性回归实现房价预测模型
题目要求
建立房价预测模型:利用ex1data1.txt(单特征)和ex1data2.txt(多特征)中的数据,进行线性回归和预测。
作散点图可知,数据大致符合线性关系,故暂不研究其他形式的回归。
两份数据放在最后。
单特征线性回归
ex1data1.txt中的数据是单特征,作一个简单的线性回归即可:\(y=ax+b\)。
根据是否分割数据,产生两种方案:方案一,所有样本都用来训练和预测;方案二,一部分样本用来训练,一部分用来检验模型。
方案一
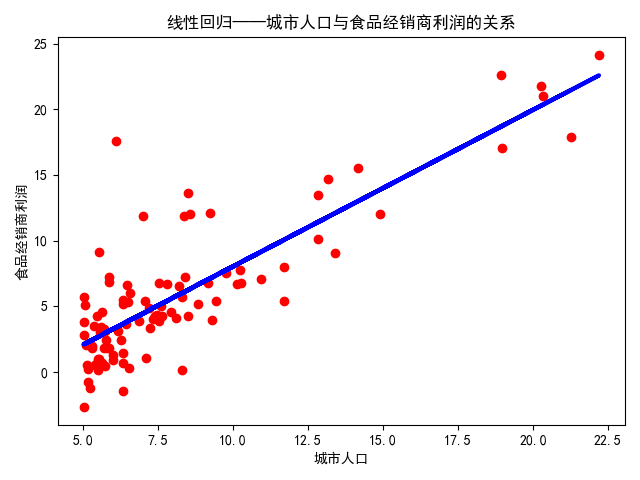
对ex1data1.txt中的数据进行线性回归,所有样本都用来训练和预测。
代码实现如下:
"""

    对ex1data1.txt中的数据进行线性回归,所有样本都用来训练和预测

"""

import numpy as np

import matplotlib.pyplot as plt

from sklearn.linear_model import LinearRegression

from sklearn.metrics import mean_squared_error, r2_score

plt.rcParams['font.sans-serif'] = ['SimHei']  # 用来正常显示中文标签

plt.rcParams['axes.unicode_minus'] = False  # 用来正常显示负号

# 数据格式:城市人口,食品经销商利润

# 读取数据

data = np.loadtxt('ex1data1.txt', delimiter=',')

data_X = data[:, 0]

data_y = data[:, 1]

# 训练模型

model = LinearRegression()

model.fit(data_X.reshape([-1, 1]), data_y)

# 利用模型进行预测

y_predict = model.predict(data_X.reshape([-1, 1]))

# 结果可视化

plt.scatter(data_X, data_y, color='red')

plt.plot(data_X, y_predict, color='blue', linewidth=3)

plt.xlabel('城市人口')

plt.ylabel('食品经销商利润')

plt.title('线性回归——城市人口与食品经销商利润的关系')

plt.show()

# 模型参数

print(model.coef_)

print(model.intercept_)

# MSE

print(mean_squared_error(data_y, y_predict))

# R^2

print(r2_score(data_y, y_predict))
结果如下:
由下可知函数形式以及\(R^2\)为0.70
[1.19303364]

-3.89578087831185

8.953942751950358

0.7020315537841397
方案二
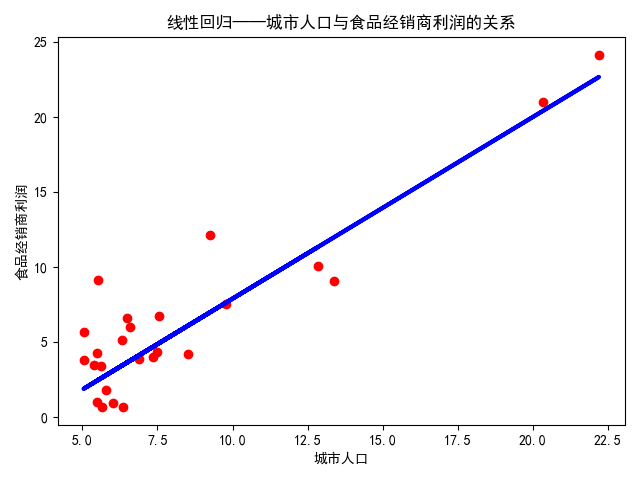
对ex1data1.txt中的数据进行线性回归,部分样本用来训练,部分样本用来预测。
实现如下:
"""

    对ex1data1.txt中的数据进行线性回归,部分样本用来训练,部分样本用来预测

"""

import numpy as np

import matplotlib.pyplot as plt

from sklearn.linear_model import LinearRegression

from sklearn.model_selection import train_test_split

from sklearn.metrics import mean_squared_error, r2_score

plt.rcParams['font.sans-serif'] = ['SimHei']  # 用来正常显示中文标签

plt.rcParams['axes.unicode_minus'] = False  # 用来正常显示负号

# 数据格式:城市人口,食品经销商利润

# 读取数据

data = np.loadtxt('ex1data1.txt', delimiter=',')

data_X = data[:, 0]

data_y = data[:, 1]

# 数据分割

X_train, X_test, y_train, y_test = train_test_split(data_X, data_y)

# 训练模型

model = LinearRegression()

model.fit(X_train.reshape([-1, 1]), y_train)

# 利用模型进行预测

y_predict = model.predict(X_test.reshape([-1, 1]))

# 结果可视化

plt.scatter(X_test, y_test, color='red')  # 测试样本

plt.plot(X_test, y_predict, color='blue', linewidth=3)

plt.xlabel('城市人口')

plt.ylabel('食品经销商利润')

plt.title('线性回归——城市人口与食品经销商利润的关系')

plt.show()

# 模型参数

print(model.coef_)

print(model.intercept_)

# MSE

print(mean_squared_error(y_test, y_predict))

# R^2

print(r2_score(y_test, y_predict))
结果如下:
由下可知函数形式以及\(R^2\)为0.80
[1.21063939]

-4.195481965945055

5.994362667047617

0.8095125123727652
多特征线性回归
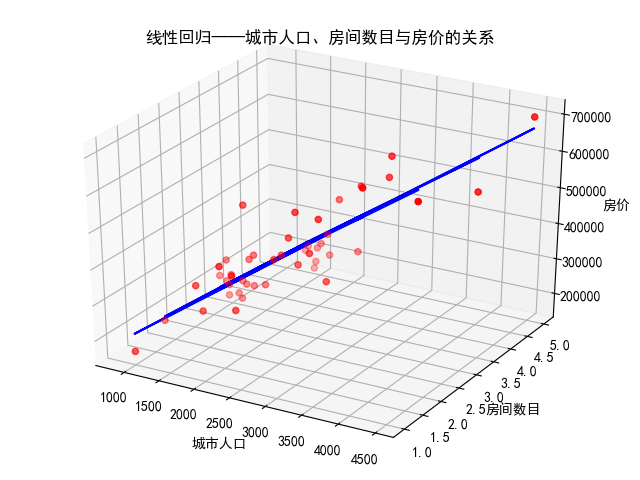
ex1data2.txt中的数据是二个特征,作一个最简单的多元(在此为二元)线性回归即可:\(y=a_1x_1+a_2x_2+b\)。
对ex1data2.txt中的数据进行线性回归,所有样本都用来训练和预测。
代码实现如下:
"""

    对ex1data2.txt中的数据进行线性回归,所有样本都用来训练和预测

"""

import numpy as np

import matplotlib.pyplot as plt

from sklearn.linear_model import LinearRegression

from mpl_toolkits.mplot3d import Axes3D  # 不要去掉这个import

from sklearn.metrics import mean_squared_error, r2_score

plt.rcParams['font.sans-serif'] = ['SimHei']  # 用来正常显示中文标签

plt.rcParams['axes.unicode_minus'] = False  # 用来正常显示负号

# 数据格式:城市人口,房间数目,房价

# 读取数据

data = np.loadtxt('ex1data2.txt', delimiter=',')

data_X = data[:, 0:2]

data_y = data[:, 2]

# 训练模型

model = LinearRegression()

model.fit(data_X, data_y)

# 利用模型进行预测

y_predict = model.predict(data_X)

# 结果可视化

fig = plt.figure()

ax = fig.gca(projection='3d')

ax.scatter(data_X[:, 0], data_X[:, 1], data_y, color='red')

ax.plot(data_X[:, 0], data_X[:, 1], y_predict, color='blue')

ax.set_xlabel('城市人口')

ax.set_ylabel('房间数目')

ax.set_zlabel('房价')

plt.title('线性回归——城市人口、房间数目与房价的关系')

plt.show()

# 模型参数

print(model.coef_)

print(model.intercept_)

# MSE

print(mean_squared_error(data_y, y_predict))

# R^2

print(r2_score(data_y, y_predict))
结果如下:
由下可知函数形式以及\(R^2\)为0.73
[  139.21067402 -8738.01911233]

89597.90954279748

4086560101.205658

0.7329450180289141
两份数据
ex1data1.txt
6.1101,17.592

5.5277,9.1302

8.5186,13.662

7.0032,11.854

5.8598,6.8233

8.3829,11.886

7.4764,4.3483

8.5781,12

6.4862,6.5987

5.0546,3.8166

5.7107,3.2522

14.164,15.505

5.734,3.1551

8.4084,7.2258

5.6407,0.71618

5.3794,3.5129

6.3654,5.3048

5.1301,0.56077

6.4296,3.6518

7.0708,5.3893

6.1891,3.1386

20.27,21.767

5.4901,4.263

6.3261,5.1875

5.5649,3.0825

18.945,22.638

12.828,13.501

10.957,7.0467

13.176,14.692

22.203,24.147

5.2524,-1.22

6.5894,5.9966

9.2482,12.134

5.8918,1.8495

8.2111,6.5426

7.9334,4.5623

8.0959,4.1164

5.6063,3.3928

12.836,10.117

6.3534,5.4974

5.4069,0.55657

6.8825,3.9115

11.708,5.3854

5.7737,2.4406

7.8247,6.7318

7.0931,1.0463

5.0702,5.1337

5.8014,1.844

11.7,8.0043

5.5416,1.0179

7.5402,6.7504

5.3077,1.8396

7.4239,4.2885

7.6031,4.9981

6.3328,1.4233

6.3589,-1.4211

6.2742,2.4756

5.6397,4.6042

9.3102,3.9624

9.4536,5.4141

8.8254,5.1694

5.1793,-0.74279

21.279,17.929

14.908,12.054

18.959,17.054

7.2182,4.8852

8.2951,5.7442

10.236,7.7754

5.4994,1.0173

20.341,20.992

10.136,6.6799

7.3345,4.0259

6.0062,1.2784

7.2259,3.3411

5.0269,-2.6807

6.5479,0.29678

7.5386,3.8845

5.0365,5.7014

10.274,6.7526

5.1077,2.0576

5.7292,0.47953

5.1884,0.20421

6.3557,0.67861

9.7687,7.5435

6.5159,5.3436

8.5172,4.2415

9.1802,6.7981

6.002,0.92695

5.5204,0.152

5.0594,2.8214

5.7077,1.8451

7.6366,4.2959

5.8707,7.2029

5.3054,1.9869

8.2934,0.14454

13.394,9.0551

5.4369,0.61705
ex1data2.txt
2104,3,399900

1600,3,329900

2400,3,369000

1416,2,232000

3000,4,539900

1985,4,299900

1534,3,314900

1427,3,198999

1380,3,212000

1494,3,242500

1940,4,239999

2000,3,347000

1890,3,329999

4478,5,699900

1268,3,259900

2300,4,449900

1320,2,299900

1236,3,199900

2609,4,499998

3031,4,599000

1767,3,252900

1888,2,255000

1604,3,242900

1962,4,259900

3890,3,573900

1100,3,249900

1458,3,464500

2526,3,469000

2200,3,475000

2637,3,299900

1839,2,349900

1000,1,169900

2040,4,314900

3137,3,579900

1811,4,285900

1437,3,249900

1239,3,229900

2132,4,345000

4215,4,549000

2162,4,287000

1664,2,368500

2238,3,329900

2567,4,314000

1200,3,299000

852,2,179900

1852,4,299900

1203,3,239500
作者:@臭咸鱼
转载请注明出处:https://www.cnblogs.com/chouxianyu/
欢迎讨论和交流!
sklearn线性回归实现房价预测模型的更多相关文章
- 使用sklearn进行数据挖掘-房价预测(5)—训练模型
使用sklearn进行数据挖掘系列文章: 1.使用sklearn进行数据挖掘-房价预测(1) 2.使用sklearn进行数据挖掘-房价预测(2)-划分测试集 3.使用sklearn进行数据挖掘-房价预 ...
- 02-11 RANSAC算法线性回归(波斯顿房价预测)
目录 RANSAC算法线性回归(波斯顿房价预测) 一.RANSAC算法流程 二.导入模块 三.获取数据 四.训练模型 五.可视化 更新.更全的<机器学习>的更新网站,更有python.go ...
- 使用sklearn进行数据挖掘-房价预测(4)—数据预处理
在使用机器算法之前,我们先把数据做下预处理,先把特征和标签拆分出来 housing = strat_train_set.drop("median_house_value",axis ...
- 使用sklearn进行数据挖掘-房价预测(6)—模型调优
通过上一节的探索,我们会得到几个相对比较满意的模型,本节我们就对模型进行调优 网格搜索 列举出参数组合,直到找到比较满意的参数组合,这是一种调优方法,当然如果手动选择并一一进行实验这是一个十分繁琐的工 ...
- 使用sklearn进行数据挖掘-房价预测(1)
使用sklearn进行数据挖掘系列文章: 1.使用sklearn进行数据挖掘-房价预测(1) 2.使用sklearn进行数据挖掘-房价预测(2)-划分测试集 3.使用sklearn进行数据挖掘-房价预 ...
- 使用sklearn进行数据挖掘-房价预测(2)—划分测试集
使用sklearn进行数据挖掘系列文章: 1.使用sklearn进行数据挖掘-房价预测(1) 2.使用sklearn进行数据挖掘-房价预测(2)-划分测试集 3.使用sklearn进行数据挖掘-房价预 ...
- 使用sklearn进行数据挖掘-房价预测(3)—绘制数据的分布
使用sklearn进行数据挖掘系列文章: 1.使用sklearn进行数据挖掘-房价预测(1) 2.使用sklearn进行数据挖掘-房价预测(2)-划分测试集 3.使用sklearn进行数据挖掘-房价预 ...
- Sklearn线性回归
Sklearn线性回归 原理 线性回归是最为简单而经典的回归模型,用了最小二乘法的思想,用一个n-1维的超平面拟合n维数据 数学形式 \[y(w,x)=w_0+w_1x_1+w_2x_2+-+w_nx ...
- 基于sklearn的波士顿房价预测_线性回归学习笔记
> 以下内容是我在学习https://blog.csdn.net/mingxiaod/article/details/85938251 教程时遇到不懂的问题自己查询并理解的笔记,由于sklear ...
随机推荐
- [IDS]CentOS6.6下搭建基于snort+barnyard2+base的入侵检测系统,超详细!!!
最详细的CentOS6.6下搭建基于snort+barnyard2+base的入侵检测系统免责声明一.如果因为使用本文档照成损失(系统崩溃.数据丢失等),作者不承担任何责任.二.本文档只是个人使用本文 ...
- SQL 删除数据库
SQL DROP DATABASE 语句 是一条DDL SQL语句.DROP DATABASE语句用于删除数据库.删除数据库将删除其中的所有数据库对象(表,视图,过程等).用户应具有删除数据库的管理员 ...
- 微信H5支付开发全过程(除内置微信以外的浏览器)
前言:网上都是~ 呵呵 自己搞 只要花时间 多问客服总会有的 只说程序不说准备工作 自己ID 或者秘钥都准备好了 写的有点儿乱 可以把所有的方法 放在一个文件中调用 public function ...
- redis的发布与订阅机制
Redis 发布/订阅机制原理分析 Redis 通过 PUBLISH. SUBSCRIBE 和 PSUBSCRIBE 等命令实现发布和订阅功能. 这些命令被广泛用于构建即时通信应用,比如网络聊天室(c ...
- [学习笔记] Blender 模型编辑-挤出
按TAB键进入模型编辑模式,再次按TAB键退出编辑模式. 或者在菜单按 Modeling 也会进入编辑模式. 进入编辑模式之后,会显示如下额外的工具栏: 下面分别对应点.线.面三种选择方式:选择了两个 ...
- opencv轮廓外接矩形
1.寻找轮廓 api void cv::findContours( InputOutputArray image, OutputArrayOfArrays contours, OutputArray ...
- 批量添加删除Windows server DNS服务 恶意域名 * A记录 指向 127.0.0.1(2019年6月5日更新)
下载链接:https://pan.baidu.com/s/1OUHyvnIfXYF0PdiT-VRyHw 密码:7gjj 注意!本解决方案在本地的Windows server服务器上把恶意域名指向1 ...
- Jmeter做HTTP接口测试
接口测试概述:https://www.cnblogs.com/mawenqiangios/p/7886115.html Jmeter接口测试教程:https://www.cnblogs.com/hou ...
- HTTP最常见的请求头
HTTP最常见的请求头如下: l Accept:浏览器可接受的MIME类型: l Accept-Charset:浏览器可接受的字符集: l Accept ...
- Word 查找替换高级玩法系列之 -- 替换手机号中间几位数字
1.打开"查找和替换"对话框.切换到"开始"选项卡,在"编辑"组中选择"替换".或者按下快捷键"Ctrl+H& ...