
matlab(6) Regularized logistic regression : plot data(画样本图)
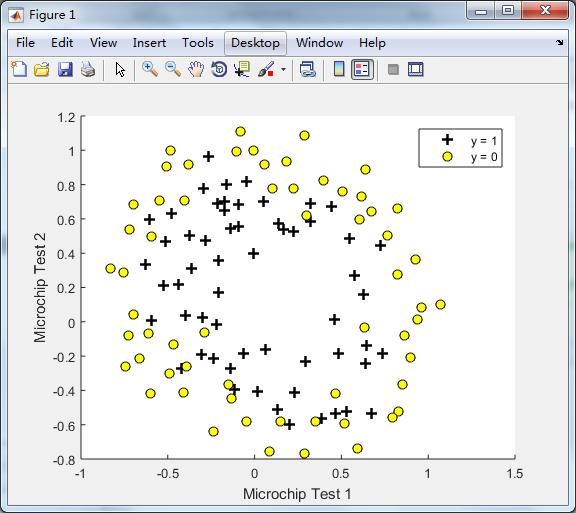
Regularized logistic regression : plot data(画样本图)
ex2data2.txt
0.051267,0.69956,1
-0.092742,0.68494,1
-0.21371,0.69225,1
-0.375,0.50219,1
-0.51325,0.46564,1
-0.52477,0.2098,1
-0.39804,0.034357,1
-0.30588,-0.19225,1
0.016705,-0.40424,1
0.13191,-0.51389,1
0.38537,-0.56506,1
...........................
ex2_reg.m
%% Machine Learning Online Class - Exercise 2: Logistic Regression
%
% Instructions
% ------------
%
% This file contains code that helps you get started on the second part
% of the exercise which covers regularization with logistic regression.
%
% You will need to complete the following functions in this exericse:
%
% sigmoid.m
% costFunction.m
% predict.m
% costFunctionReg.m
%
% For this exercise, you will not need to change any code in this file,
% or any other files other than those mentioned above.
%
%% Initialization
clear ; close all; clc (clear: Clear variables and functions from memory; close: close figure; clc: Clear command window.)
%% Load Data
% The first two columns contains the X values and the third column
% contains the label (y).
data = load('ex2data2.txt');
X = data(:, [1, 2]); y = data(:, 3);
plotData(X, y); %调用下面的plotData.m里面的函数plotData(X,y)
% Put some labels
hold on;
% Labels and Legend
xlabel('Microchip Test 1')
ylabel('Microchip Test 2')
% Specified in plot order
legend('y = 1', 'y = 0')
hold off;
plotData.m文件
function plotData(X, y) (在文件的开头应写上新定义的function,文件的名称(plotData.m)中的plotData应与function的名称一至)
%PLOTDATA Plots the data points X and y into a new figure
% PLOTDATA(x,y) plots the data points with + for the positive examples
% and o for the negative examples. X is assumed to be a Mx2 matrix.
% Create New Figure
figure; hold on; (figure:创建一个figure 窗口)
% ====================== YOUR CODE HERE ======================
% Instructions: Plot the positive and negative examples on a
% 2D plot, using the option 'k+' for the positive
% examples and 'ko' for the negative examples.
%
% Find indices of positive and negative example
pos = find(y==1); neg = find(y==0); (返回所有y==1的点的线性序列(linear indices (如上述data则返回(1,2,3,4,5,6...)))
%plot example
plot(X(pos,1), X(pos,2), 'k+', 'LineWidth', 2, 'MarkerSize', 7); (将相应序列对应的X矩阵的元素画出(如第4行的第一列的值做为x轴的值,第4行的第二列的值做为y轴的值); k+表示线的颜色为黑色,形状为+; MarkerSize 表示+形状的大小 )
plot(X(neg,1), X(neg,2), 'ko', 'MarkerFaceColor', 'y', 'MarkerSize', 7); (MarkerFaceColor: 表示填充在o里面的颜色为黄色)
% =========================================================================
hold off;
end (表示plotData(X, y)函数的结束)
matlab(6) Regularized logistic regression : plot data(画样本图)的更多相关文章
- matlab(7) Regularized logistic regression : mapFeature(将feature增多) and costFunctionReg
Regularized logistic regression : mapFeature(将feature增多) and costFunctionReg ex2_reg.m文件中的部分内容 %% == ...
- matlab(8) Regularized logistic regression : 不同的λ(0,1,10,100)值对regularization的影响,对应不同的decision boundary\ 预测新的值和计算模型的精度predict.m
不同的λ(0,1,10,100)值对regularization的影响\ 预测新的值和计算模型的精度 %% ============= Part 2: Regularization and Accur ...
- machine learning(15) --Regularization:Regularized logistic regression
Regularization:Regularized logistic regression without regularization 当features很多时会出现overfitting现象,图 ...
- Regularized logistic regression
要解决的问题是,给出了具有2个特征的一堆训练数据集,从该数据的分布可以看出它们并不是非常线性可分的,因此很有必要用更高阶的特征来模拟.例如本程序中个就用到了特征值的6次方来求解. Data To be ...
- 编程作业2.2:Regularized Logistic regression
题目 在本部分的练习中,您将使用正则化的Logistic回归模型来预测一个制造工厂的微芯片是否通过质量保证(QA),在QA过程中,每个芯片都会经过各种测试来保证它可以正常运行.假设你是这个工厂的产品经 ...
- 吴恩达机器学习笔记22-正则化逻辑回归模型(Regularized Logistic Regression)
针对逻辑回归问题,我们在之前的课程已经学习过两种优化算法:我们首先学习了使用梯度下降法来优化代价函数
- Andrew Ng机器学习编程作业:Logistic Regression
编程作业文件: machine-learning-ex2 1. Logistic Regression (逻辑回归) 有之前学生的数据,建立逻辑回归模型预测,根据两次考试结果预测一个学生是否有资格被大 ...
- Machine Learning - 第3周(Logistic Regression、Regularization)
Logistic regression is a method for classifying data into discrete outcomes. For example, we might u ...
- week3编程作业: Logistic Regression中一些难点的解读
%% ============ Part : Compute Cost and Gradient ============ % In this part of the exercise, you wi ...
随机推荐
- 《ucore lab1》实验报告
资源 ucore在线实验指导书 我的ucore实验代码 练习1:理解通过make生成执行文件的过程 详见<ucore lab1 exercise1>实验报告 练习2:使用qemu执行并调试 ...
- 024 Android 自定义样式对话框(AlertDialog)
1.AlertDialog介绍 AlertDialog并不需要到布局文件中创建,而是在代码中通过构造器(AlertDialog.Builder)来构造标题.图标和按钮等内容的. 常规使用步骤(具体参见 ...
- 迅雷下载敏感资源 迅雷应版权方要求无法下载 μTorrent使用方法(六种方法,值得你看)(22)
1. 解决方案1 1.1 声明 此方法只适用于迅雷极速版,迅雷X不管用. 修改后下载有些磁力链接或种子,依然无反应.不是说该方法无效,而是有些种子资源不佳,很难下载,需要等半天才能连接上开始下载.如果 ...
- golang之方法
golang中的方法是作用在指定的数据类型上的(即:和指定 数据类型绑定),因此自定义类型,都可以有方法,而不仅仅是在struct. 方法的使用: type Person struct { Num i ...
- 转换器1:ThinkPhp模板转Flask模板
Template Converter 网上的PHP资源很多,项目要用Python,所以想起做一个模板转换器,从ThinkPhp转成Flask的Jinja模板. 直接指定两个目录,将目录下的模板文件转换 ...
- stm32f103的低功耗开启和关闭
stm32f103低功耗分为WFI等待中断和WFE等待事件,我只用到等待中断,这里没有细究. 待机模式最低功耗2uA,只有备份寄存器和待机电路供电,PLL,HSI,HSE断开,寄存器和SRAM复位,除 ...
- 全栈项目|小书架|服务器开发-NodeJS 项目分包
唠嗑 参考的是慕课网七月老师的课程,七月的课质量真的挺高的,推荐一波.这次的小书架项目源码不会全部公开,因为用了七月老师课程的绝大部分代码.虽然代码不全,但是只要思路看得懂,代码实现就很简单了. 小书 ...
- .net core使用CSRedisCore连接哨兵集群,并用作redis使用分布式缓存。
CSRedisCore是国内大佬出品的一个Redis-Cli-SDK. Github地址:https://github.com/2881099/csredis 使用此插件作为分布式缓存也十分简单. 一 ...
- 本地安装SQL Server 2017 Express和Microsoft SQL Server Management Studio 18.1
sqlserver下载链接:https://www.microsoft.com/zh-cn/sql-server/sql-server-downloads 这个安装的是免费版的Express,当然也可 ...
- css 层叠 比较特殊性
css 层叠: 多个相同的css声明(属性),应用到同一个元素上.当一个标签声明冲突时,浏览器会自动出发层叠机制 1:比较优先级 2:比较特殊性 3:比较源次序 依次经过上面的1,2,3的比较后,最终 ...