
prometheus-监控docker服务器
1. prometheus-监控docker服务器
prometheus-监控docker服务器
cAdvisor(Container Advisor):用于收集正在运行的容器资源使用和性能信息。
docker部署cAdvisor示例:
docker run -d \

--volume=/:/rootfs:ro \

--volume=/var/run:/var/run:ro \

--volume=/sys:/sys:ro \

--volume=/var/lib/docker/:/var/lib/docker:ro \

--volume=/dev/disk/:/dev/disk:ro \

--publish=8080:8080 \

--detach=true \

--name=cadvisor \

google/cadvisor:latest
案例: 监控docker服务器
监控执行命令
docker run -d \

--volume=/:/rootfs:ro \

--volume=/var/run:/var/run:ro \

--volume=/sys:/sys:ro \

--volume=/var/lib/docker/:/var/lib/docker:ro \

--volume=/dev/disk/:/dev/disk:ro \

--publish=8080:8080 \

--detach=true \

--name=cadvisor \

google/cadvisor:latest
执行创建监控docker服务
[root@VM-0-17-centos ~]# docker run -d \

> --volume=/:/rootfs:ro \

> --volume=/var/run:/var/run:ro \

> --volume=/sys:/sys:ro \

> --volume=/var/lib/docker/:/var/lib/docker:ro \

> --volume=/dev/disk/:/dev/disk:ro \

> --publish=8080:8080 \

> --detach=true \

> --name=cadvisor \

> google/cadvisor:latest

Unable to find image 'google/cadvisor:latest' locally

latest: Pulling from google/cadvisor

ff3a5c916c92: Pull complete

44a45bb65cdf: Pull complete

0bbe1a2fe2a6: Pull complete

Digest: sha256:815386ebbe9a3490f38785ab11bda34ec8dacf4634af77b8912832d4f85dca04

Status: Downloaded newer image for google/cadvisor:latest

78d6d7db3b715f5800346cd592575a4b7be5e644e198dbf95160e64c3545fa53
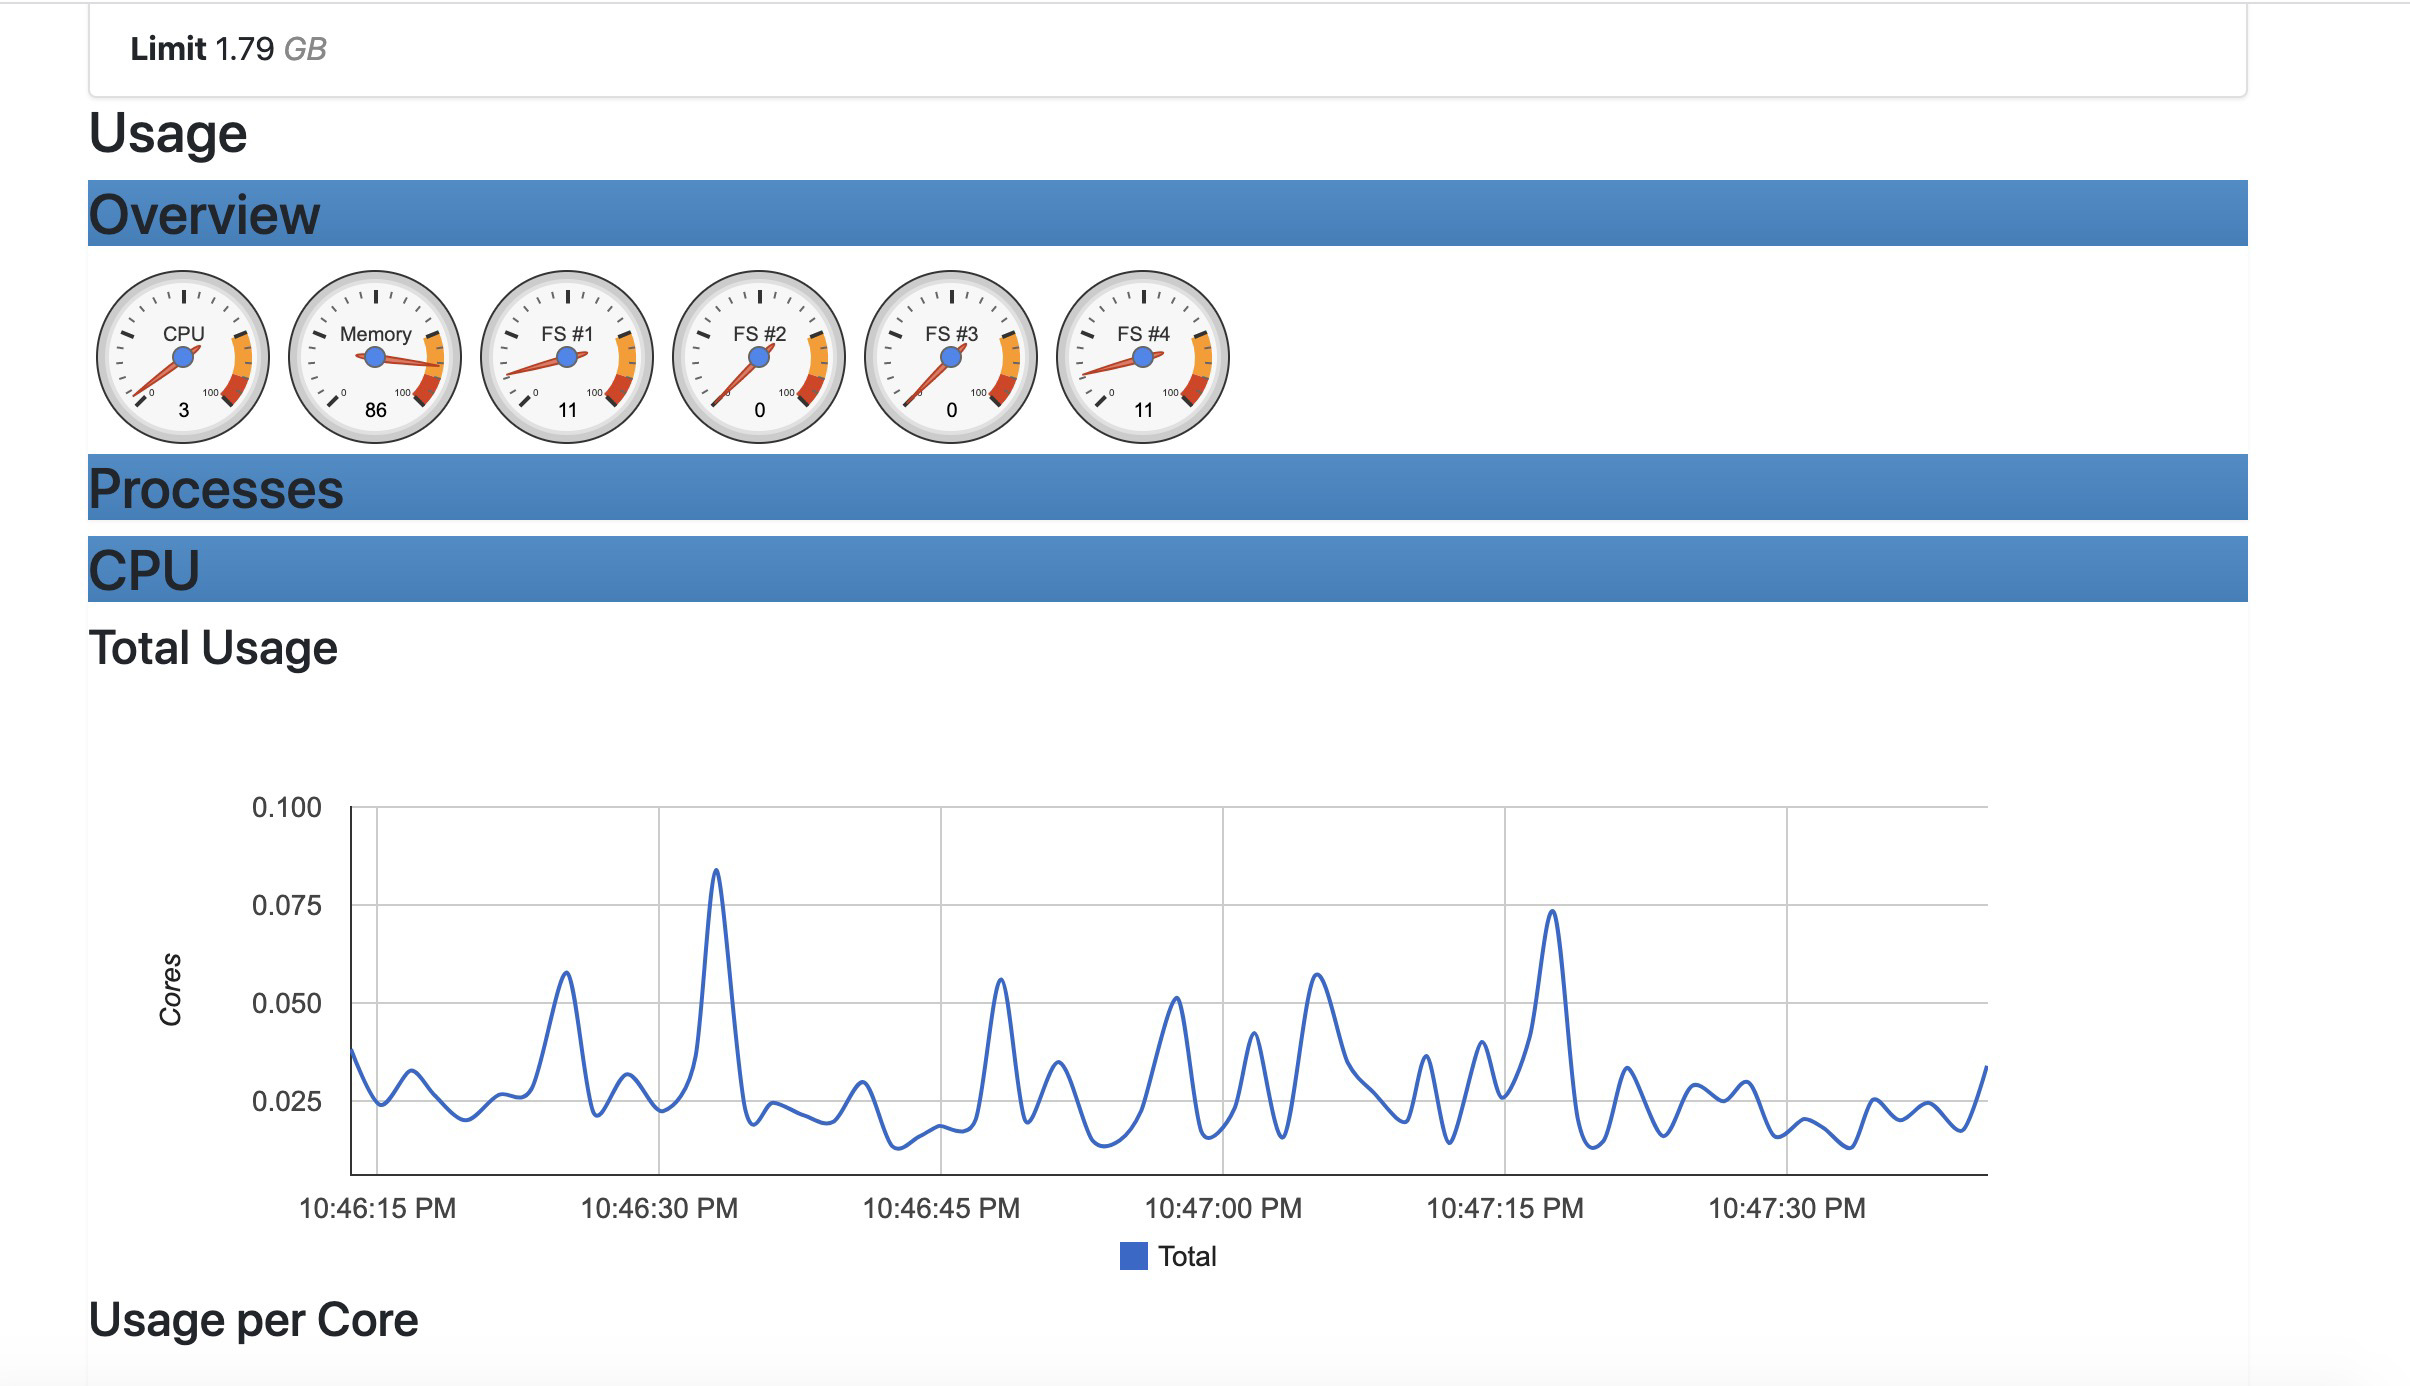
进行数据访问http://ip:8080
配置prometheus添加服务
[root@prometheus ~]# cd /opt/monitor/

[root@prometheus monitor]# ll

total 23072

drwxr-xr-x 2 3434 3434       93 Jun  7 14:39 alertmanager

-rw-r--r-- 1 root root 23624308 May 11 04:11 alertmanager-0.22.0-rc.1.linux-amd64.tar.gz

drwxr-xr-x 8 root root      157 Jun  6 17:18 grafana

drwxr-xr-x 5 3434 3434      145 Jun  7 17:07 prometheus

[root@prometheus monitor]# cd prometheus/

[root@prometheus prometheus]# ll

total 167980

drwxr-xr-x 2 3434 3434       38 Mar 17 04:20 console_libraries

drwxr-xr-x 2 3434 3434      173 Mar 17 04:20 consoles

-rw-r--r-- 1 3434 3434    11357 Mar 17 04:20 LICENSE

-rw-r--r-- 1 3434 3434     3420 Mar 17 04:20 NOTICE

-rwxr-xr-x 1 3434 3434 91044140 Mar 17 02:10 prometheus

-rw-r--r-- 1 3434 3434     1043 Jun  7 17:07 prometheus.yml

-rwxr-xr-x 1 3434 3434 80944687 Mar 17 02:12 promtool

drwxr-xr-x 2 root root       22 Jun  7 14:43 rules

[root@prometheus prometheus]# vim prometheus.yml

[root@prometheus prometheus]# cat prometheus.yml

# my global config

global:

  scrape_interval:     15s # Set the scrape interval to every 15 seconds. Default is every 1 minute.

  evaluation_interval: 15s # Evaluate rules every 15 seconds. The default is every 1 minute.

  # scrape_timeout is set to the global default (10s).

# Alertmanager configuration

alerting:

  alertmanagers:

  - static_configs:

    - targets:

       - 127.0.0.1:9093

# Load rules once and periodically evaluate them according to the global 'evaluation_interval'.

rule_files:

  - "rules/*.yml"

  # - "second_rules.yml"

# A scrape configuration containing exactly one endpoint to scrape:

# Here it's Prometheus itself.

scrape_configs:

  # The job name is added as a label `job=<job_name>` to any timeseries scraped from this config.

  - job_name: 'prometheus'

    # metrics_path defaults to '/metrics'

    # scheme defaults to 'http'.

    static_configs:

    - targets: ['127.0.0.1:9090']

  - job_name: 'linux server'

    static_configs:

      - targets: ['121.4.78.187:9100']

        labels:

          prod: 'web1'

  - job_name: 'docker server'

    static_configs:

      - targets: ['121.4.63.211:8080']

        labels:

          prod: 'web2'
重新加载prometheus服务
[root@prometheus prometheus]# /bin/systemctl restart prometheus

[root@prometheus prometheus]# /bin/systemctl status prometheus

● prometheus.service - prometheus

   Loaded: loaded (/usr/lib/systemd/system/prometheus.service; enabled; vendor preset: disabled)

   Active: active (running) since Mon 2021-06-07 22:53:36 CST; 4s ago

 Main PID: 14647 (prometheus)

   CGroup: /system.slice/prometheus.service

           └─14647 /opt/monitor/prometheus/prometheus --config.file=/opt/monitor/prometheus/prometheus.yml

Jun 07 22:53:36 prometheus prometheus[14647]: level=info ts=2021-06-07T14:53:36.914Z caller=head.go:740 component=tsdb msg="WAL segment loaded" segment=1...egment=19

Jun 07 22:53:36 prometheus prometheus[14647]: level=info ts=2021-06-07T14:53:36.958Z caller=head.go:740 component=tsdb msg="WAL segment loaded" segment=1...egment=19

Jun 07 22:53:36 prometheus prometheus[14647]: level=info ts=2021-06-07T14:53:36.990Z caller=head.go:740 component=tsdb msg="WAL segment loaded" segment=1...egment=19

Jun 07 22:53:36 prometheus prometheus[14647]: level=info ts=2021-06-07T14:53:36.990Z caller=head.go:740 component=tsdb msg="WAL segment loaded" segment=1...egment=19

Jun 07 22:53:36 prometheus prometheus[14647]: level=info ts=2021-06-07T14:53:36.990Z caller=head.go:745 component=tsdb msg="WAL replay completed" checkpo....353439ms

Jun 07 22:53:36 prometheus prometheus[14647]: level=info ts=2021-06-07T14:53:36.993Z caller=main.go:799 fs_type=XFS_SUPER_MAGIC

Jun 07 22:53:36 prometheus prometheus[14647]: level=info ts=2021-06-07T14:53:36.993Z caller=main.go:802 msg="TSDB started"

Jun 07 22:53:36 prometheus prometheus[14647]: level=info ts=2021-06-07T14:53:36.993Z caller=main.go:928 msg="Loading configuration file" filename=/opt/mo...theus.yml

Jun 07 22:53:36 prometheus prometheus[14647]: level=info ts=2021-06-07T14:53:36.996Z caller=main.go:959 msg="Completed loading of configuration file" filename=/op…µs

Jun 07 22:53:36 prometheus prometheus[14647]: level=info ts=2021-06-07T14:53:36.996Z caller=main.go:751 msg="Server is ready to receive web requests."

Hint: Some lines were ellipsized, use -l to show in full.
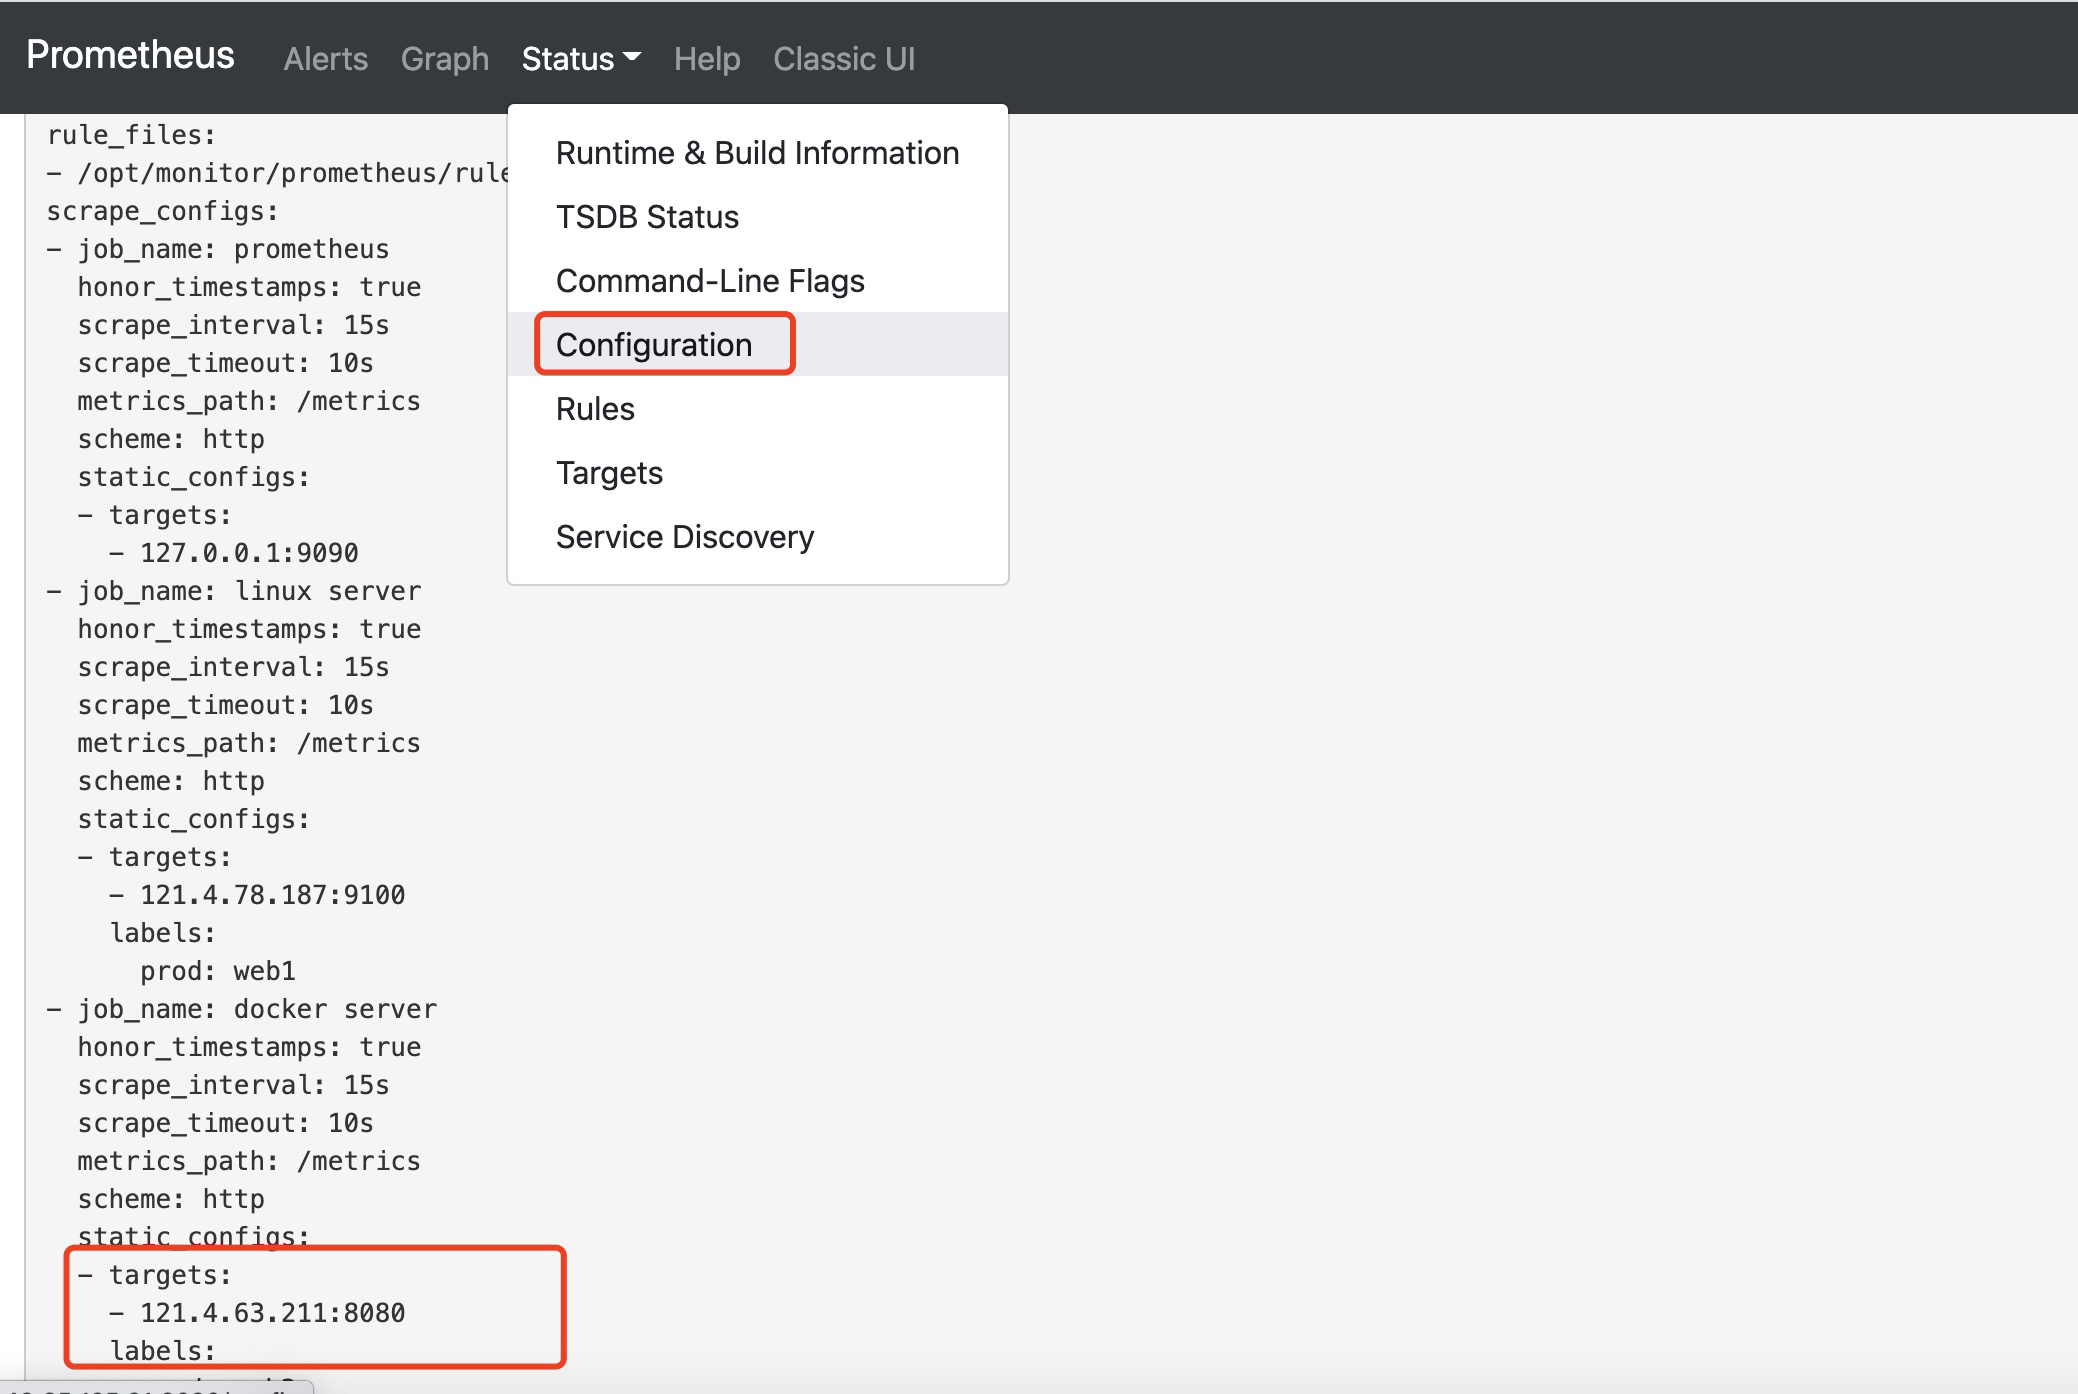
浏览器验证prometheus配置文件是否生成
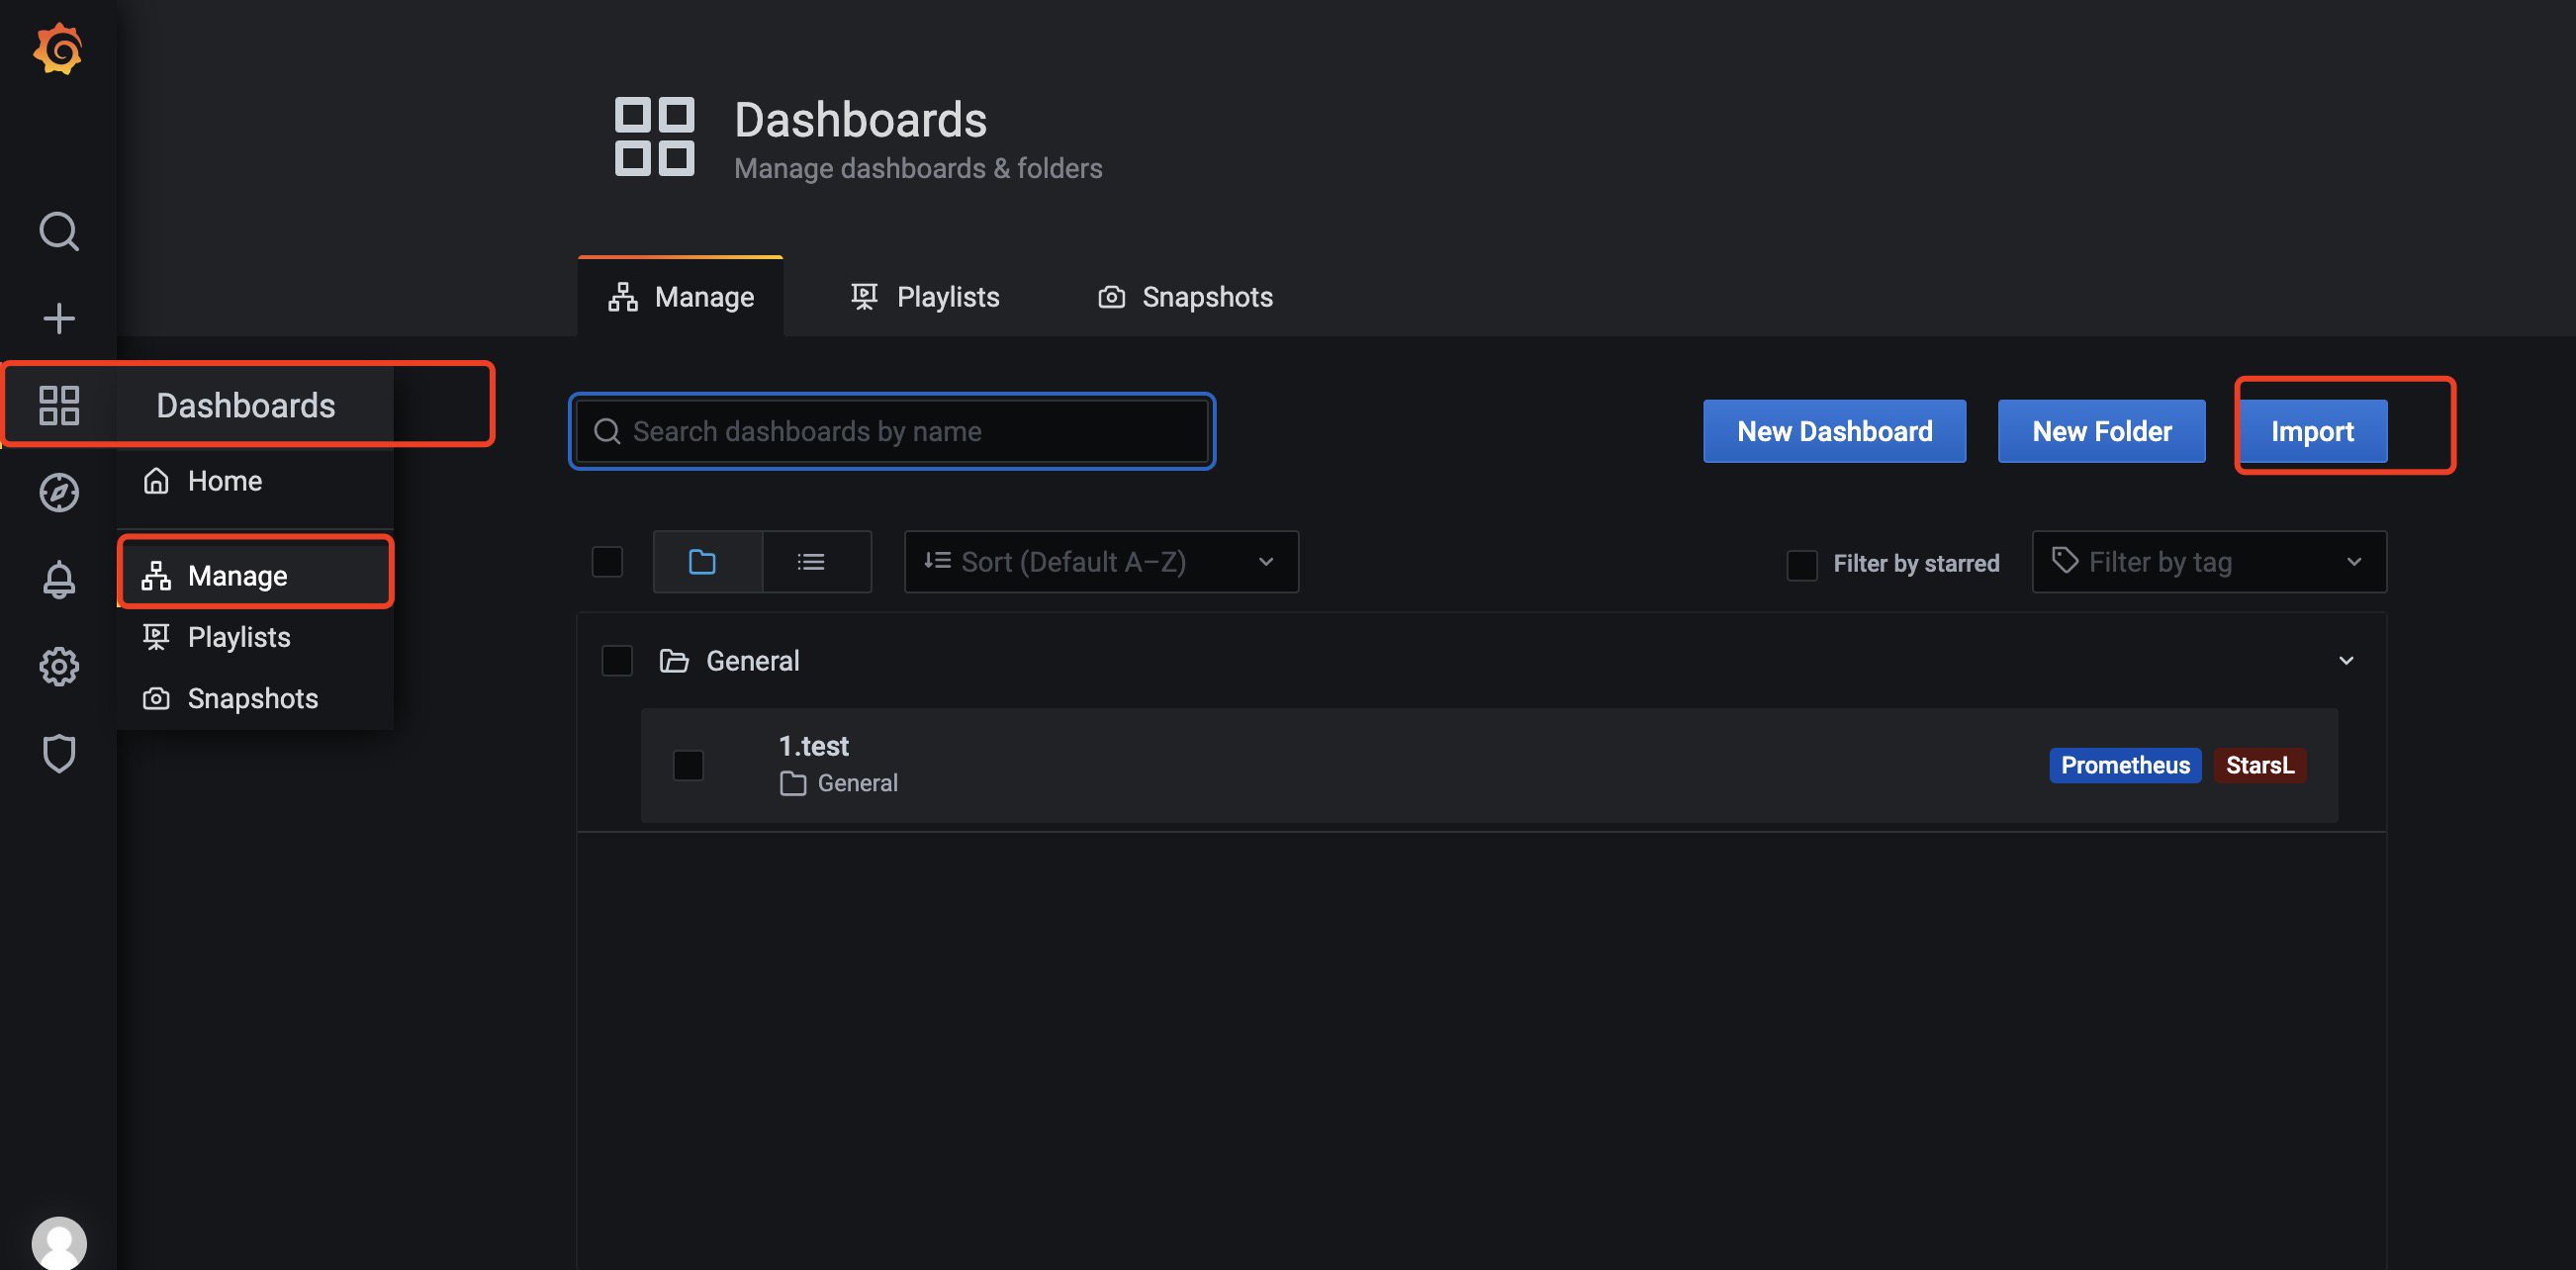
使用grafana进行监控docker服务数据展示
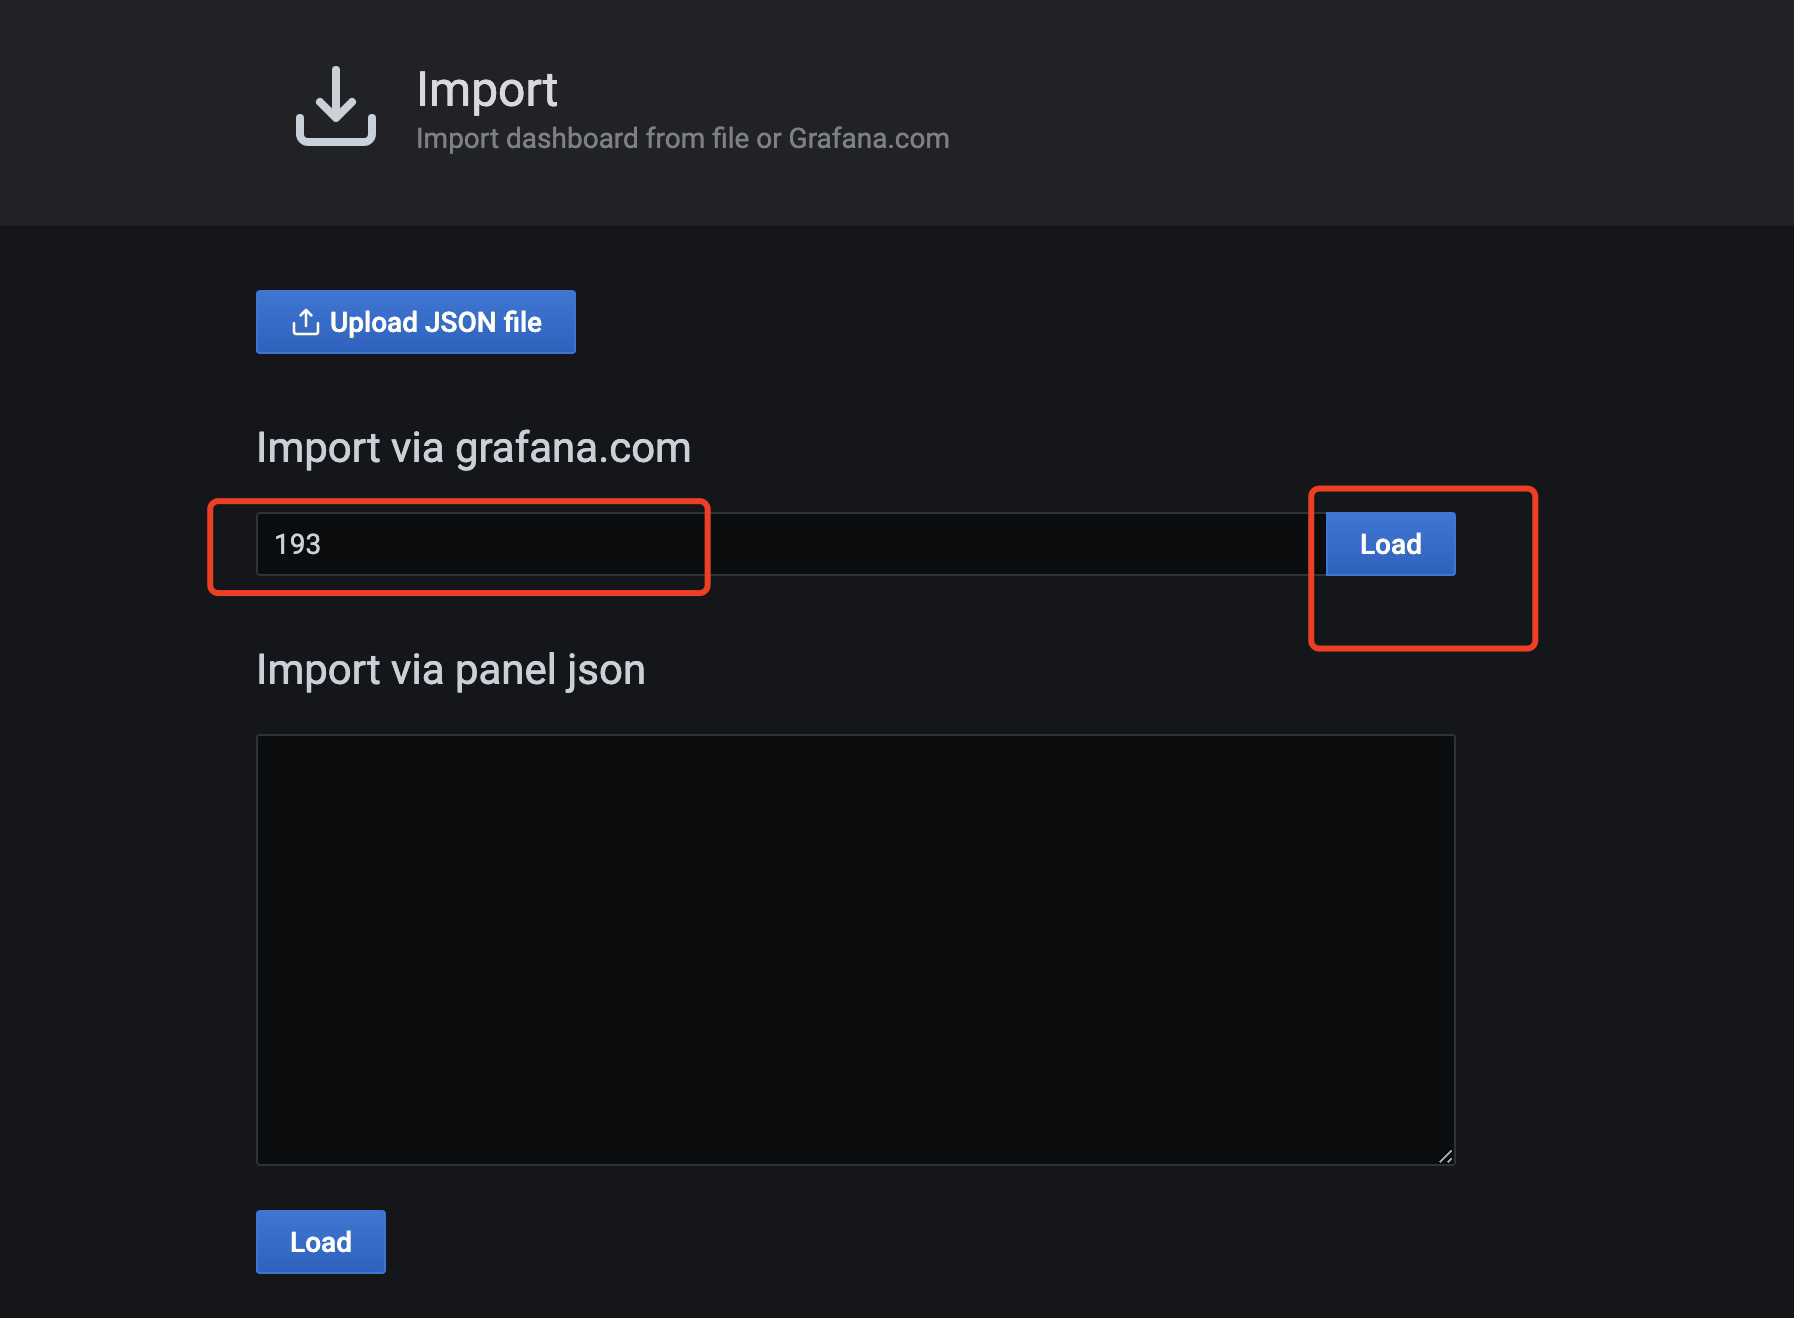
导入监控docker的仪表盘,ID为193
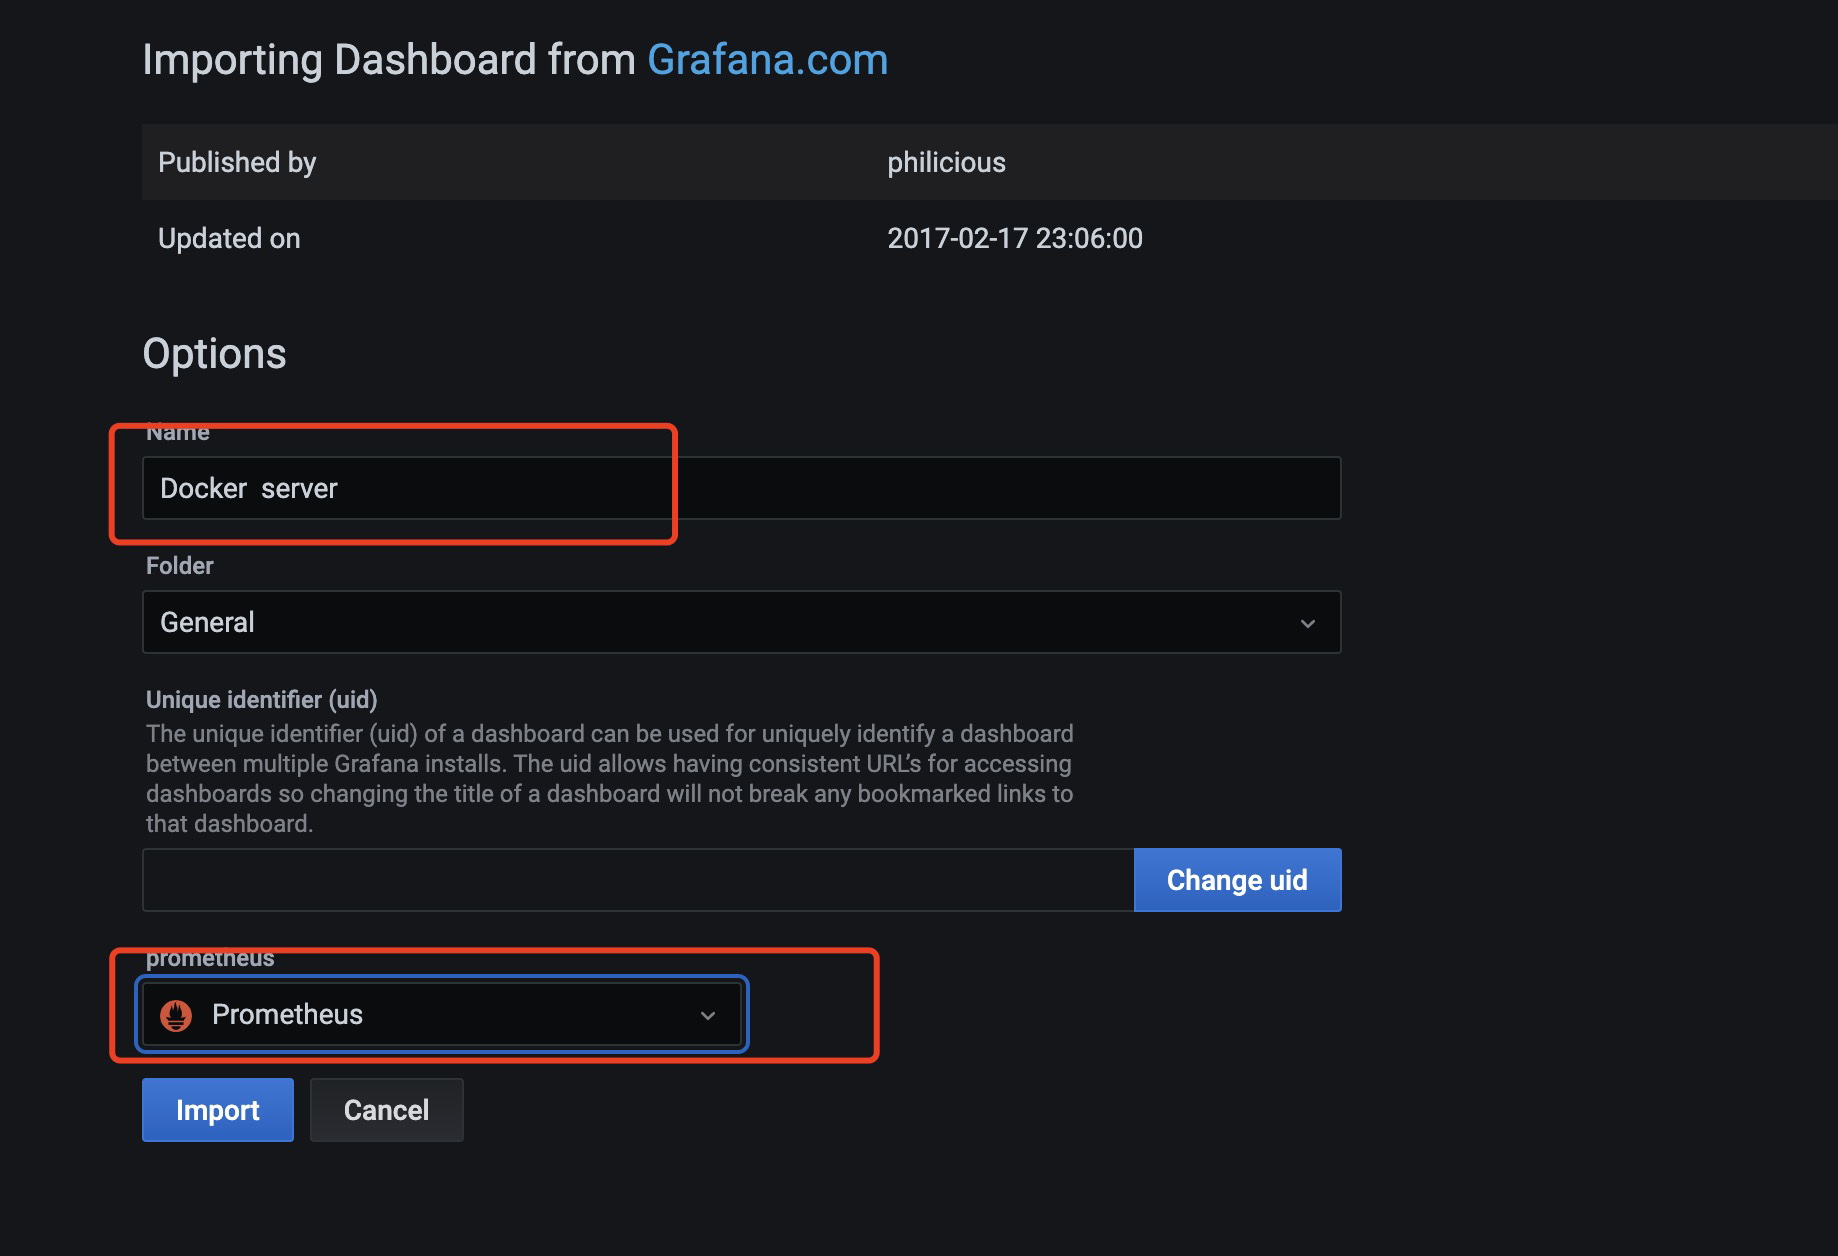
填写名称,选择数据源
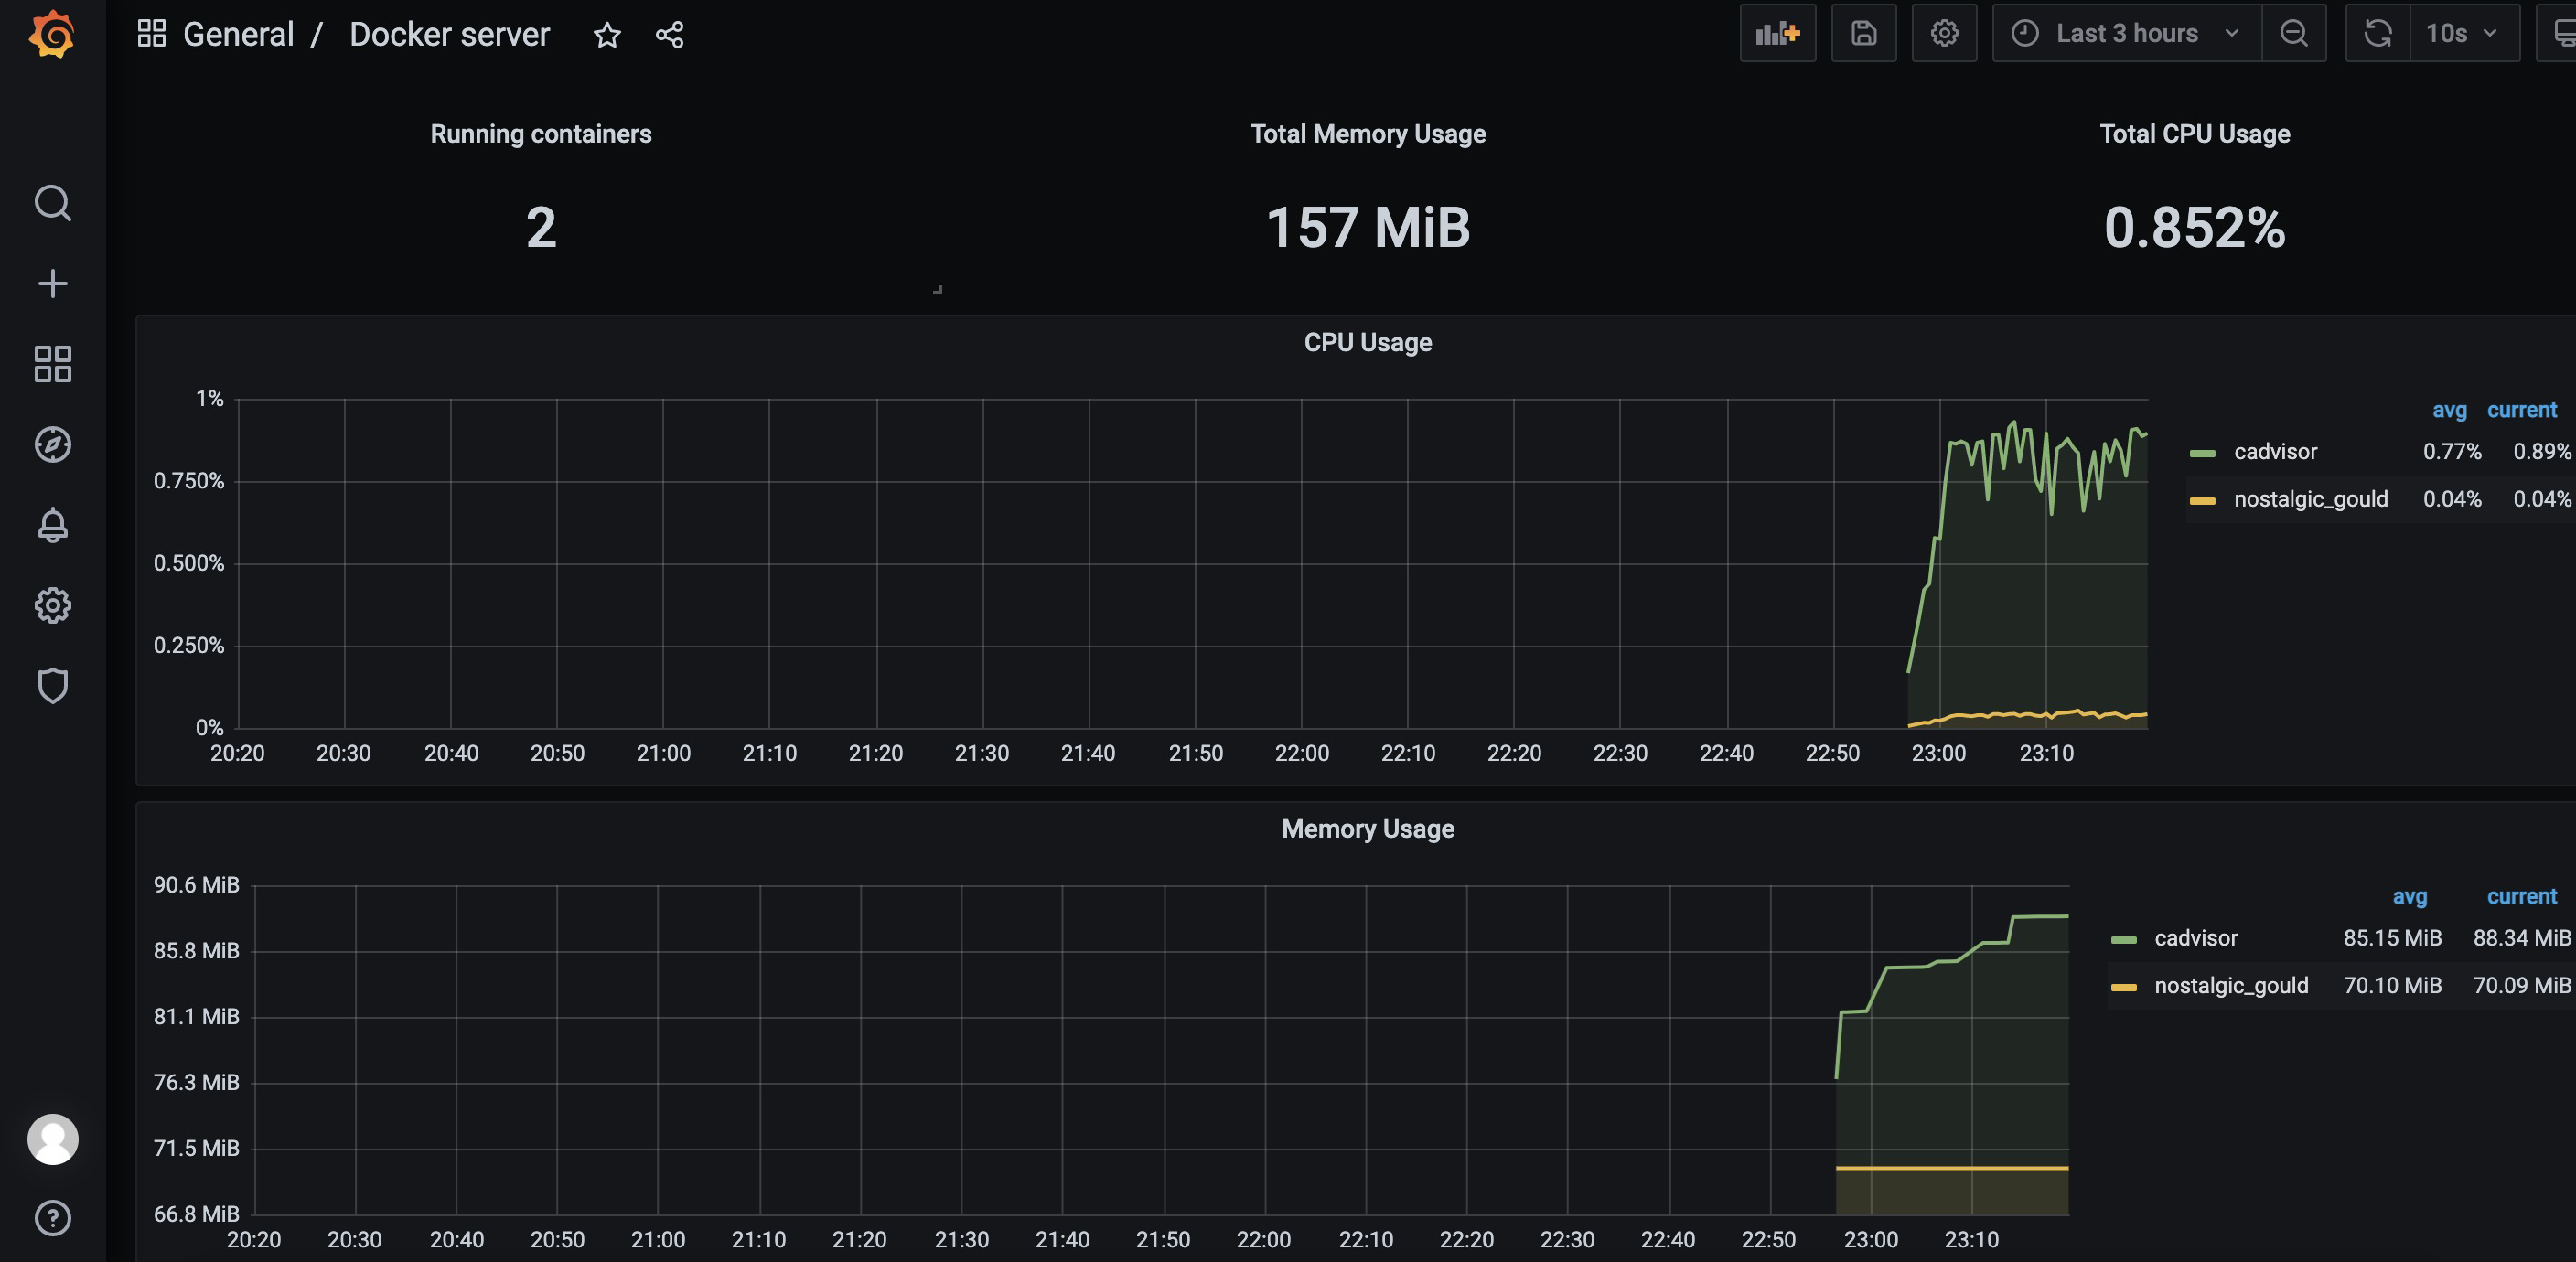
发现已有监控数据了
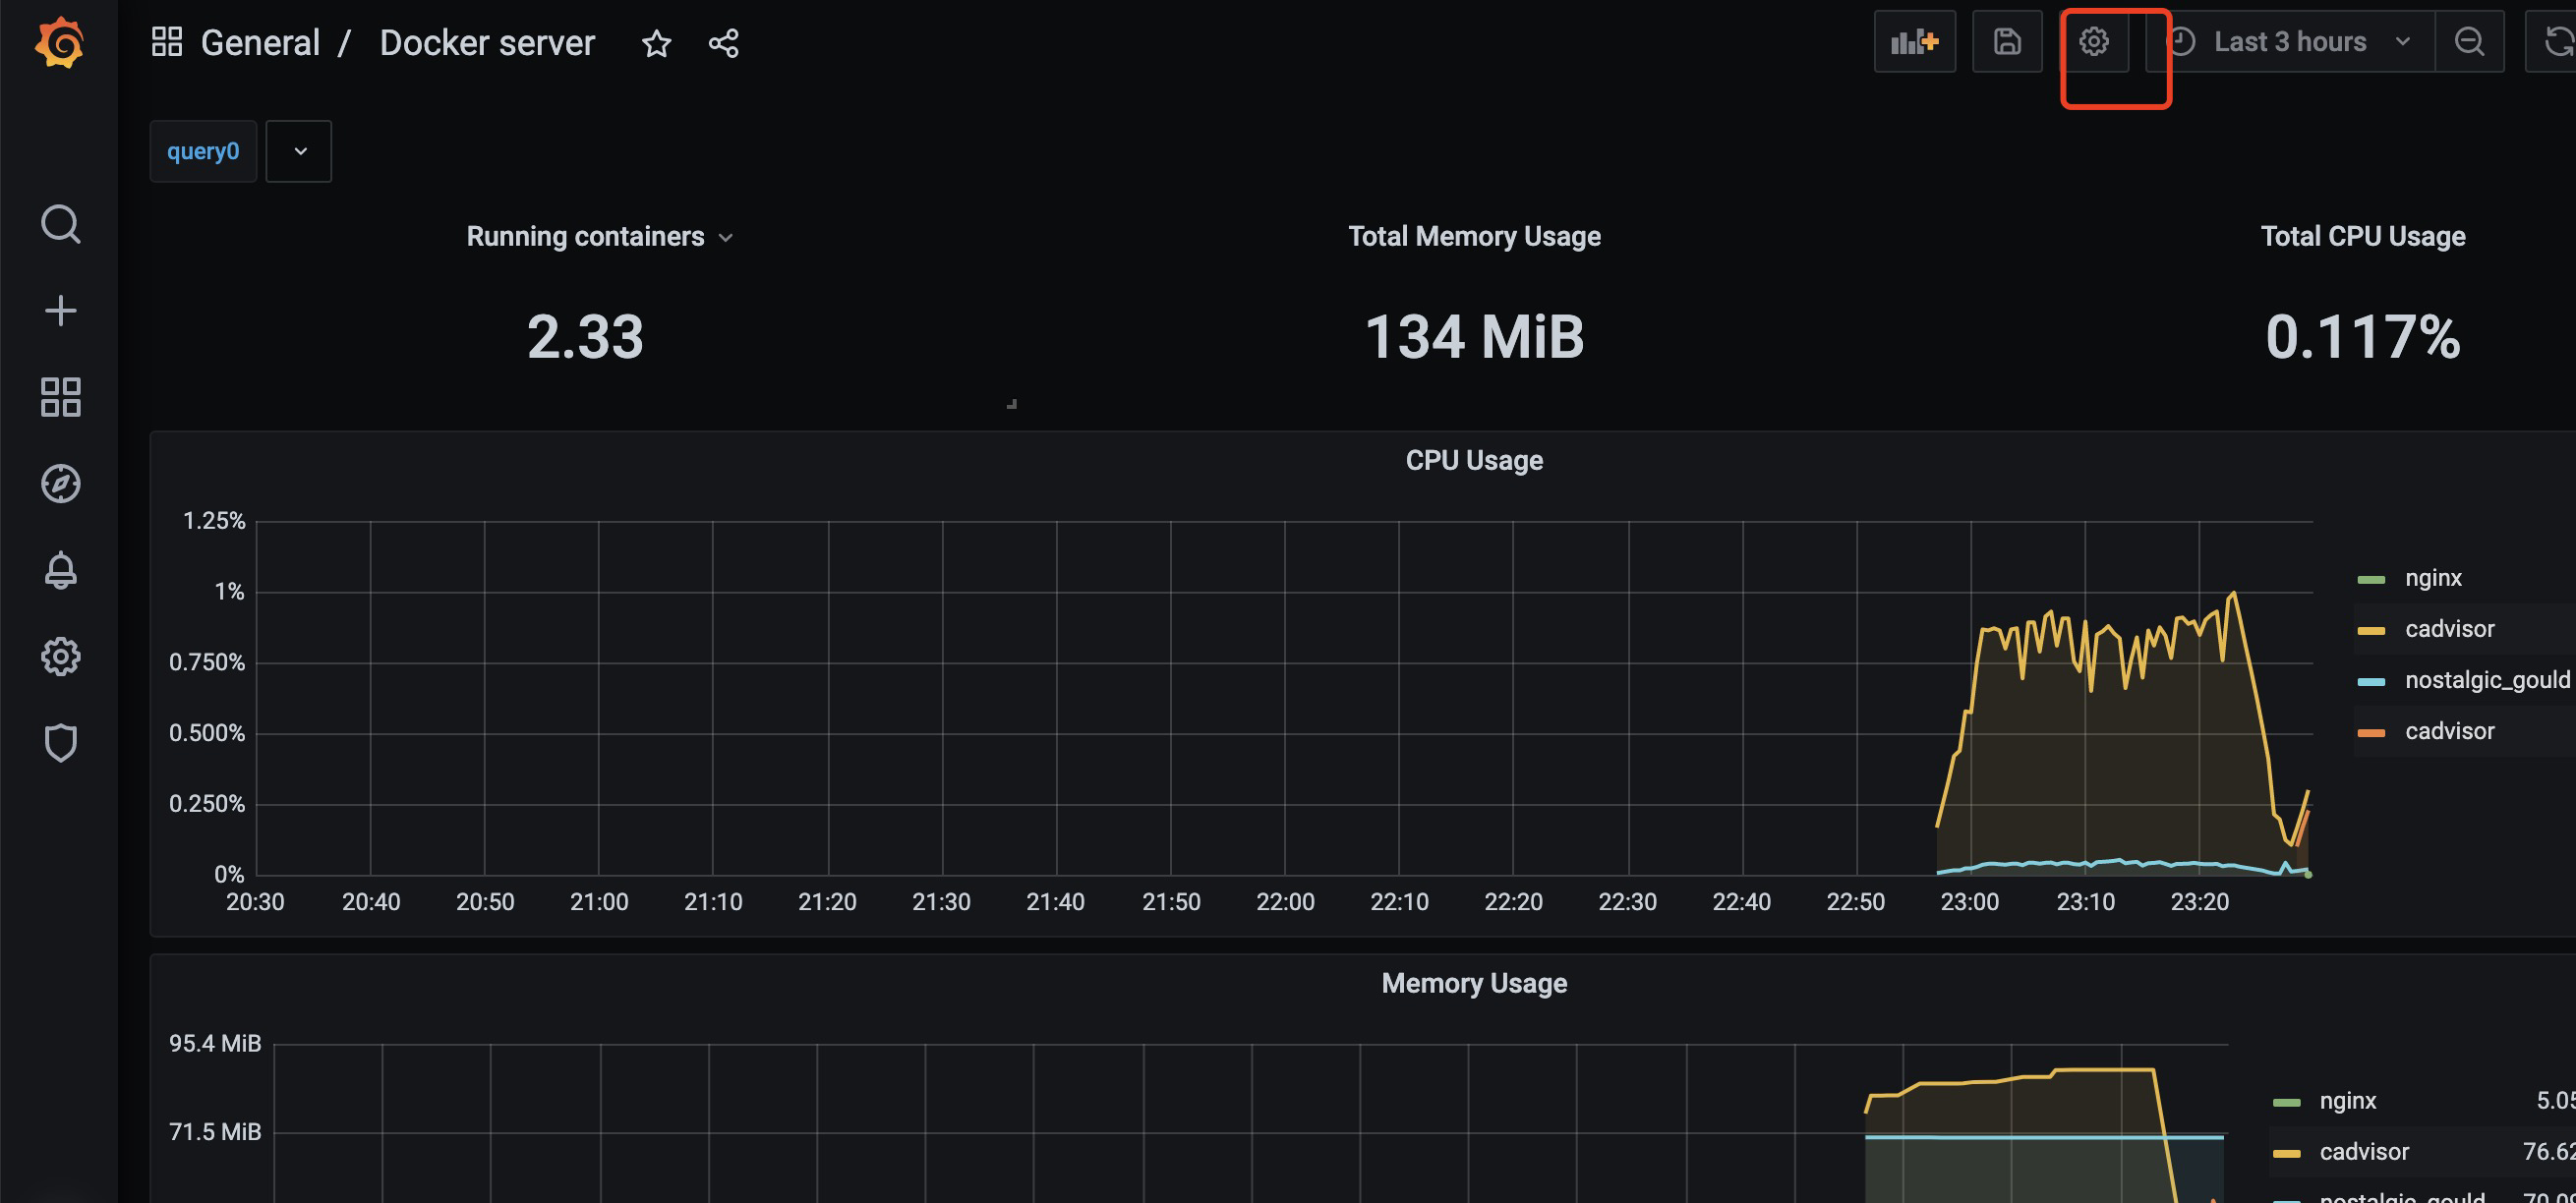
监控docker服务添加一个导航栏
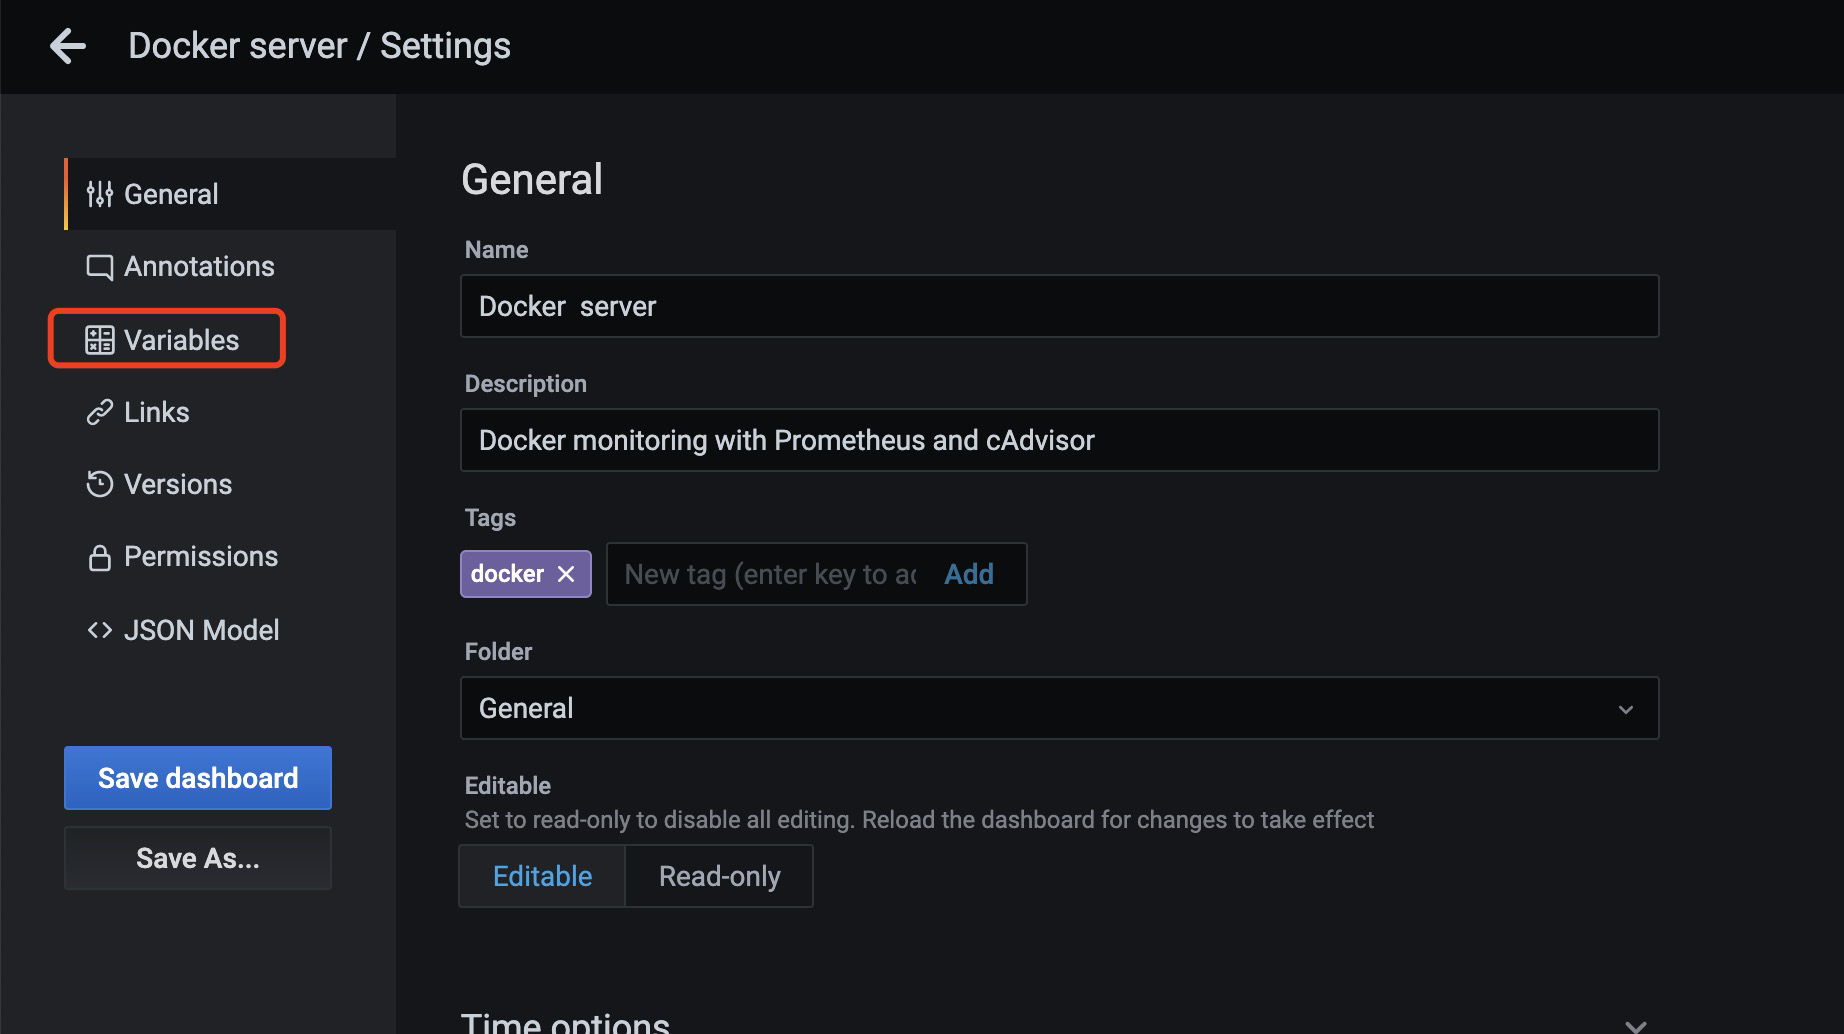
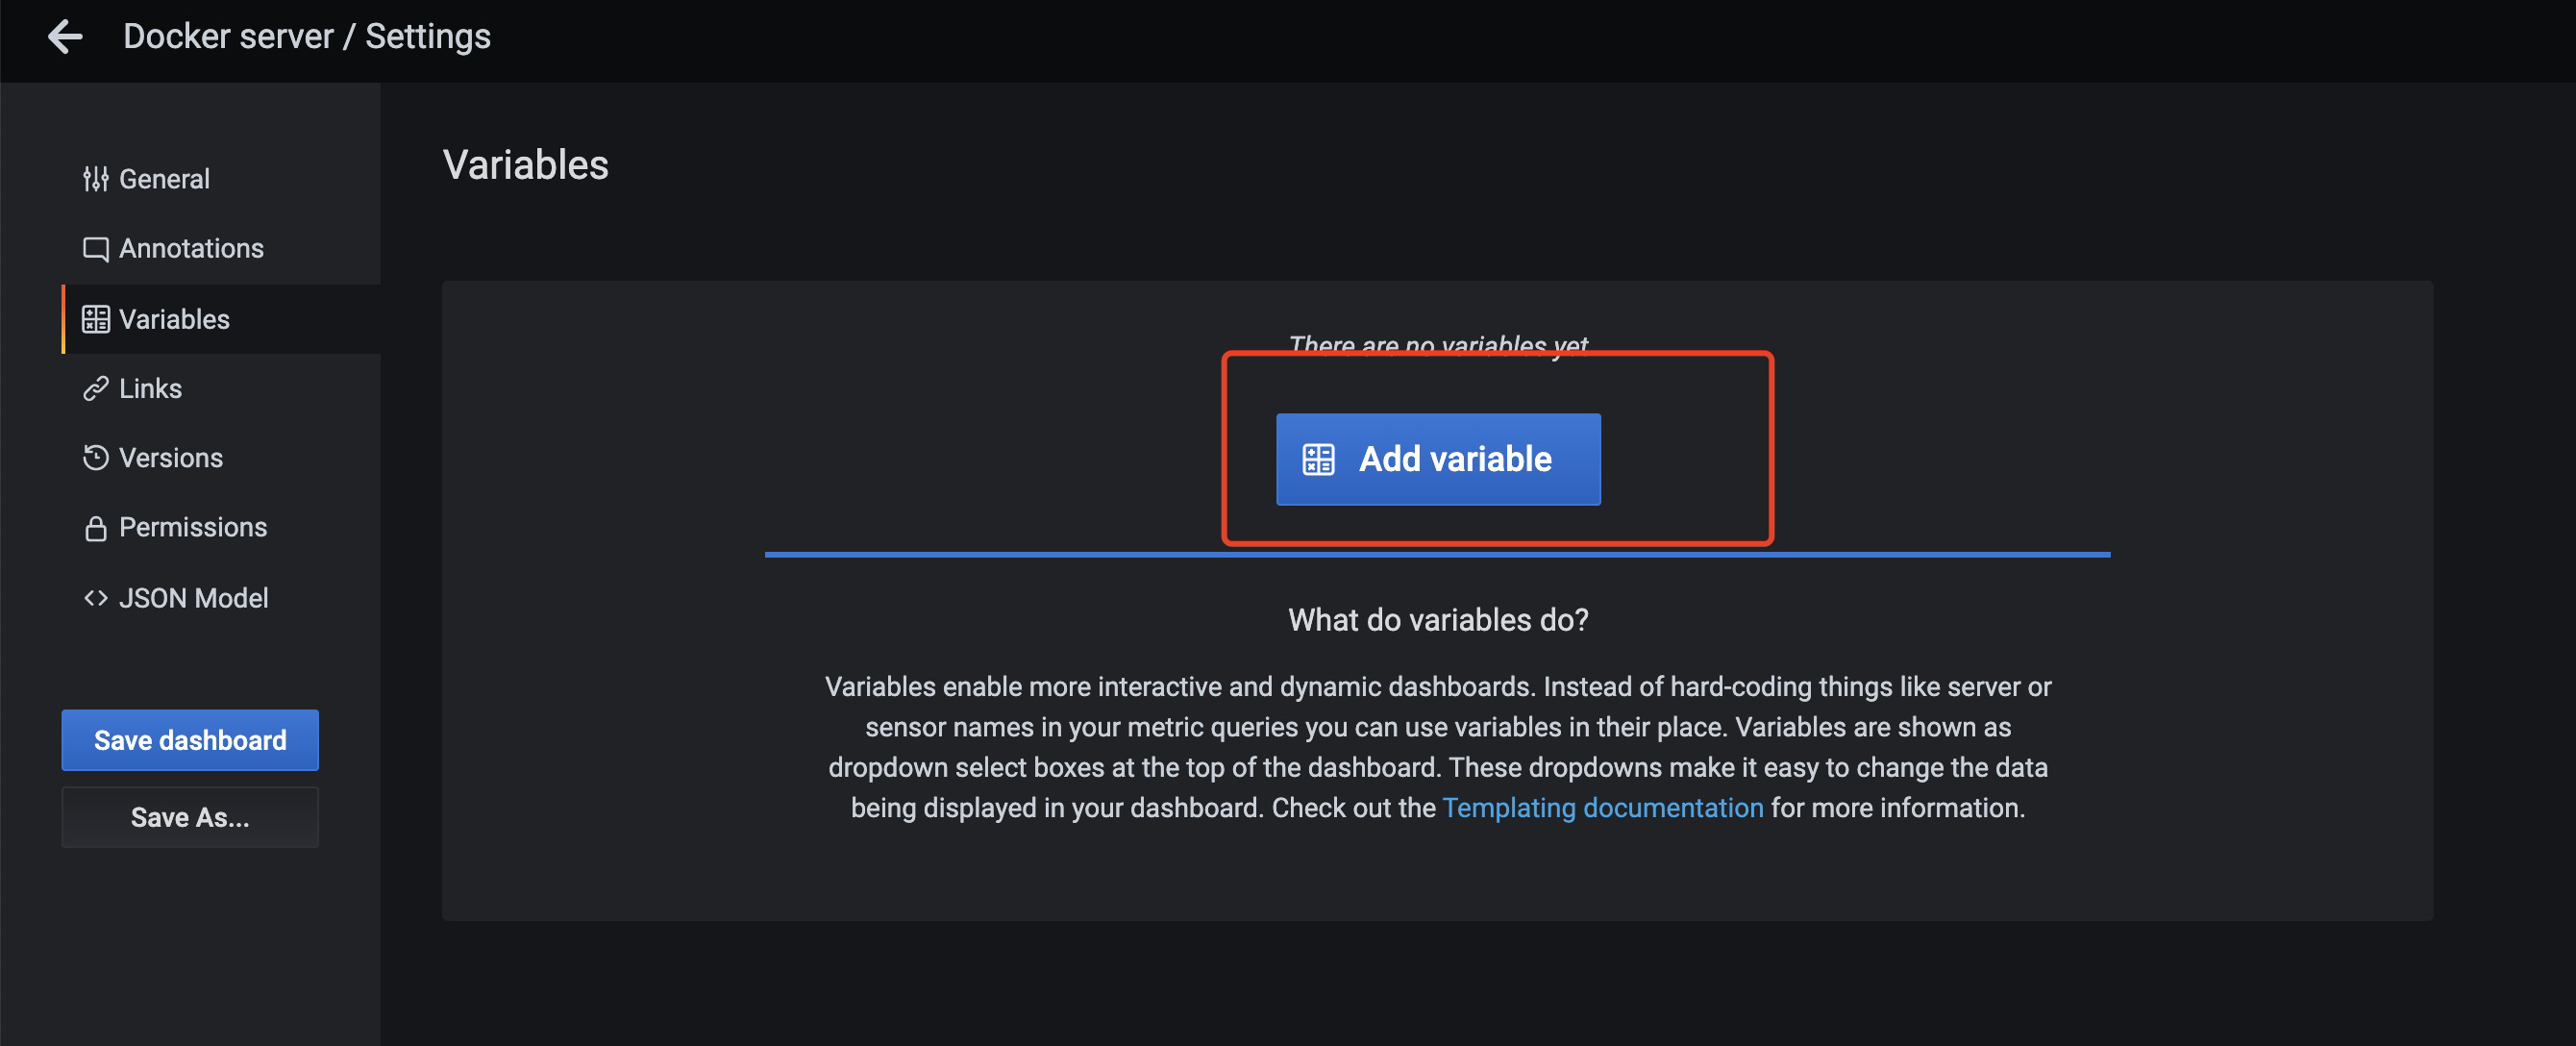
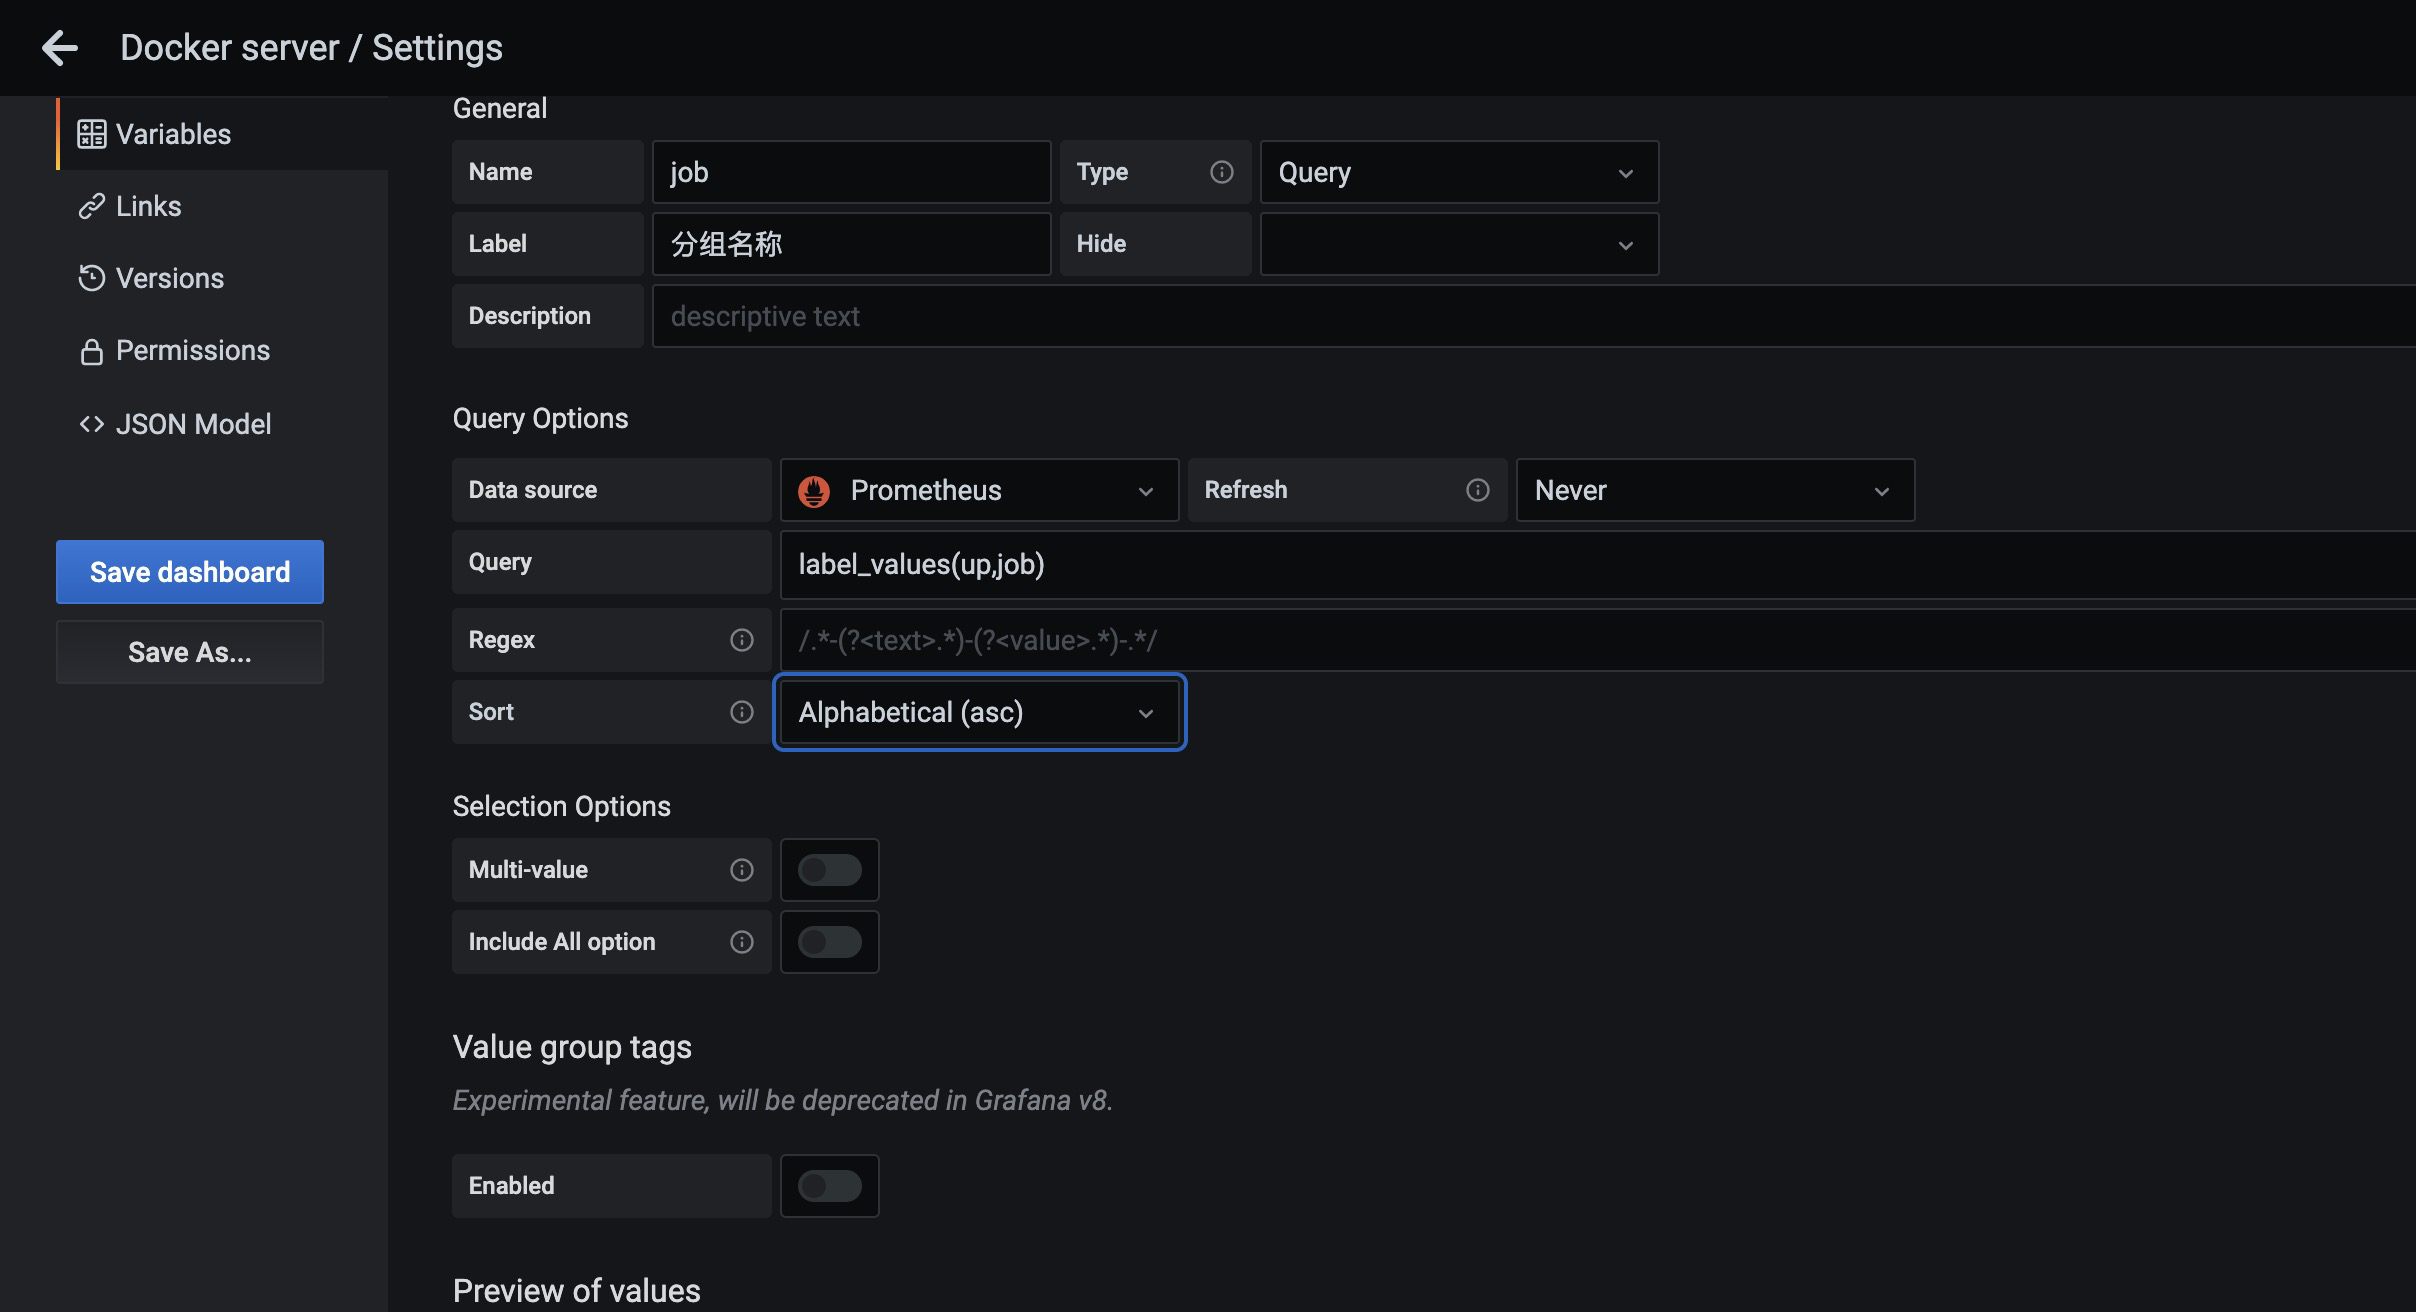
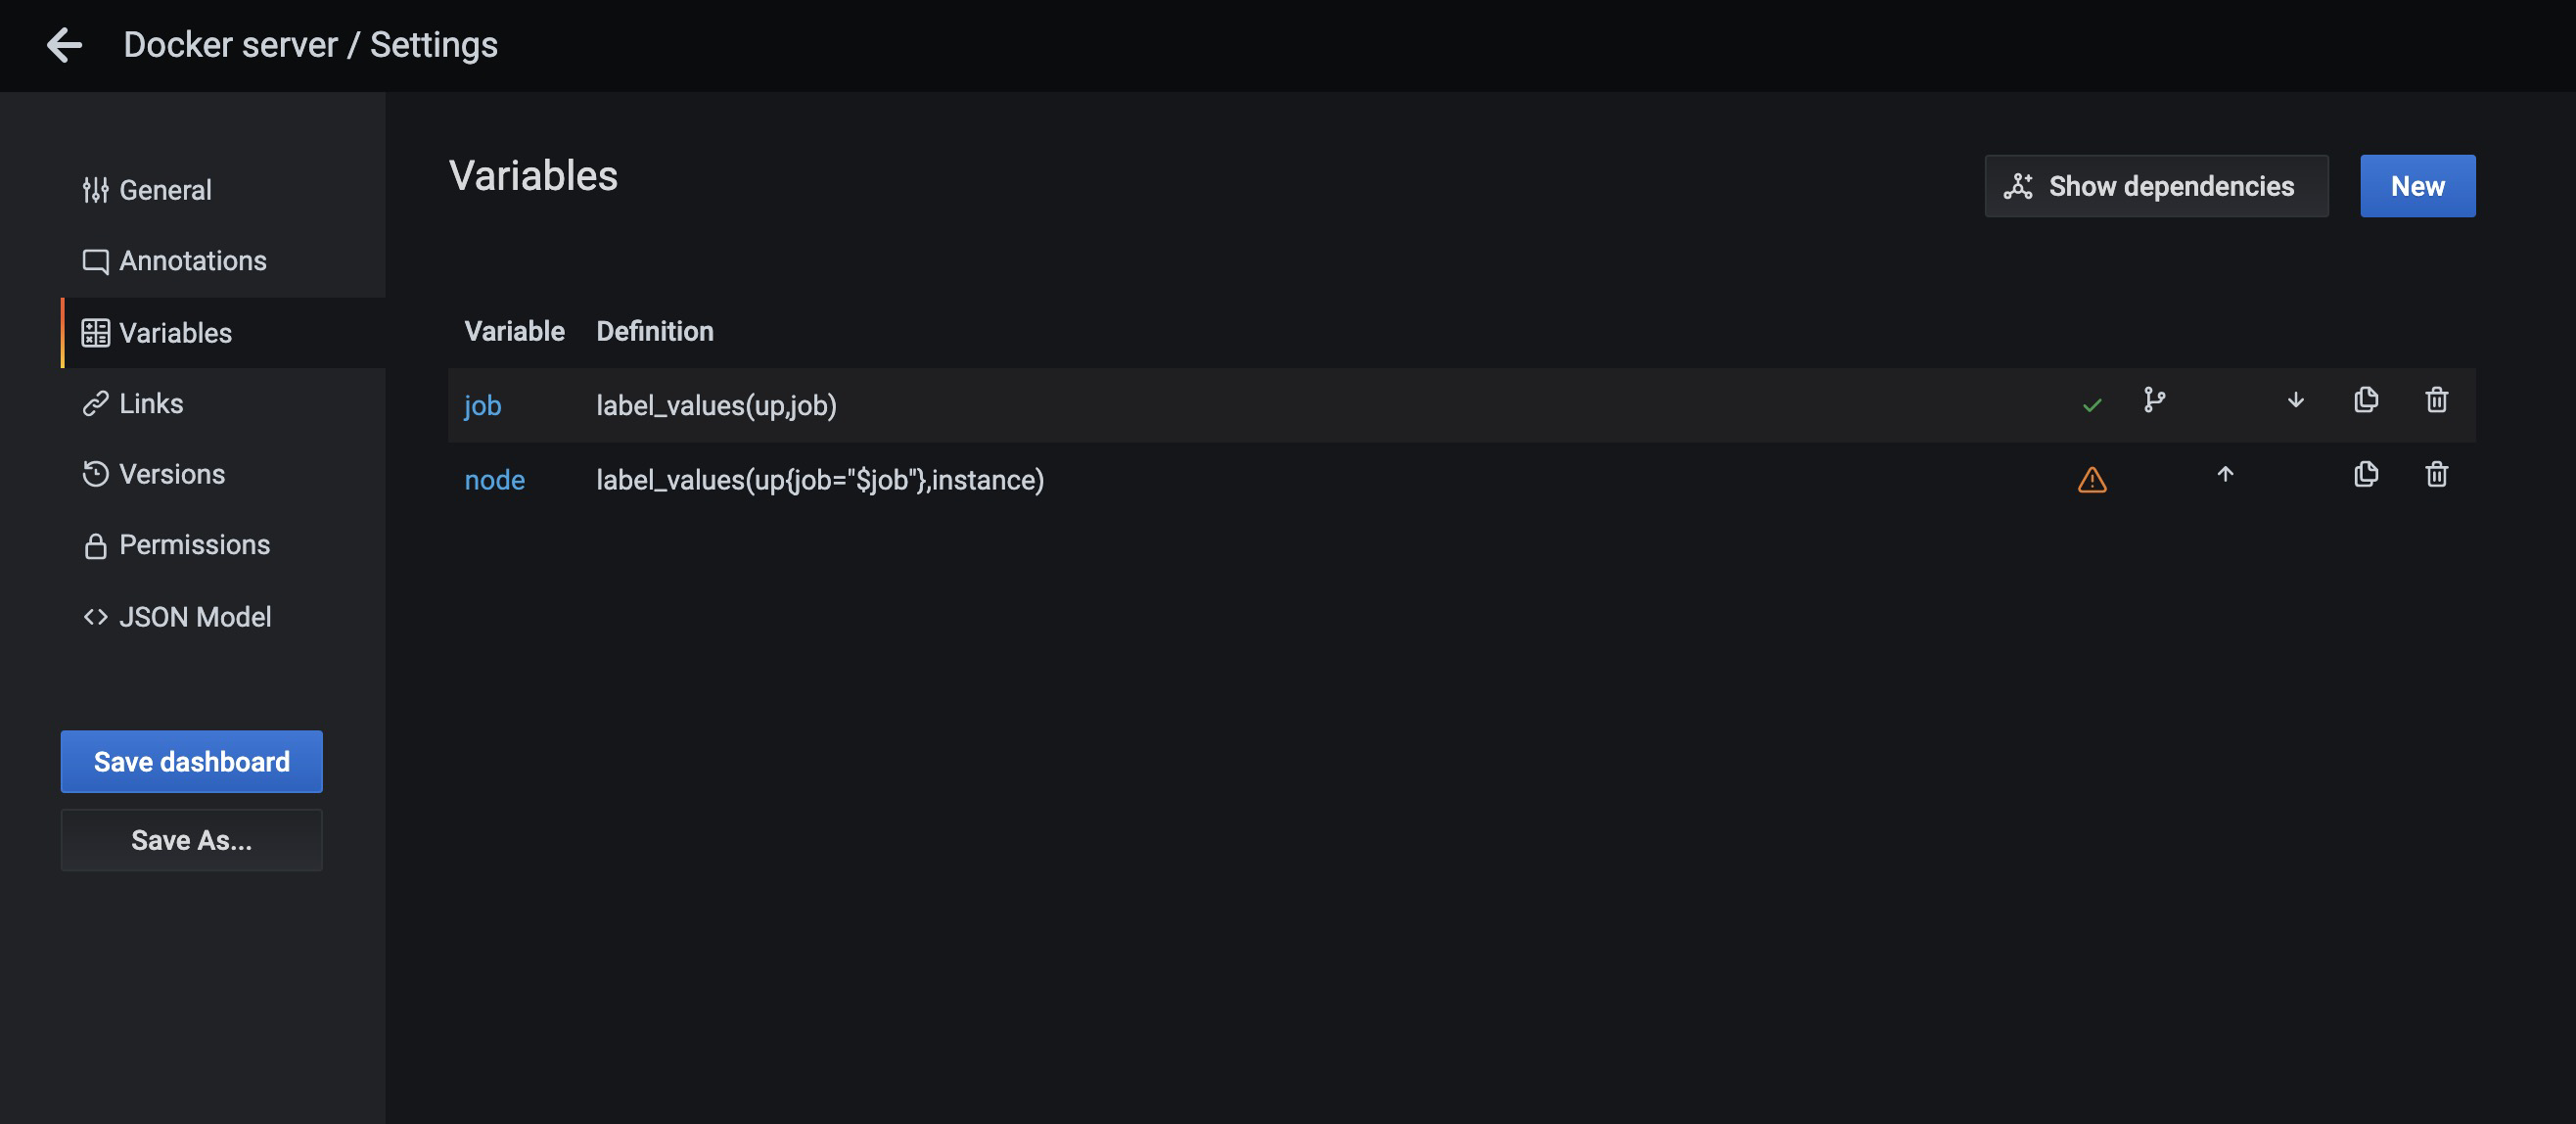
点击save dashboard保存
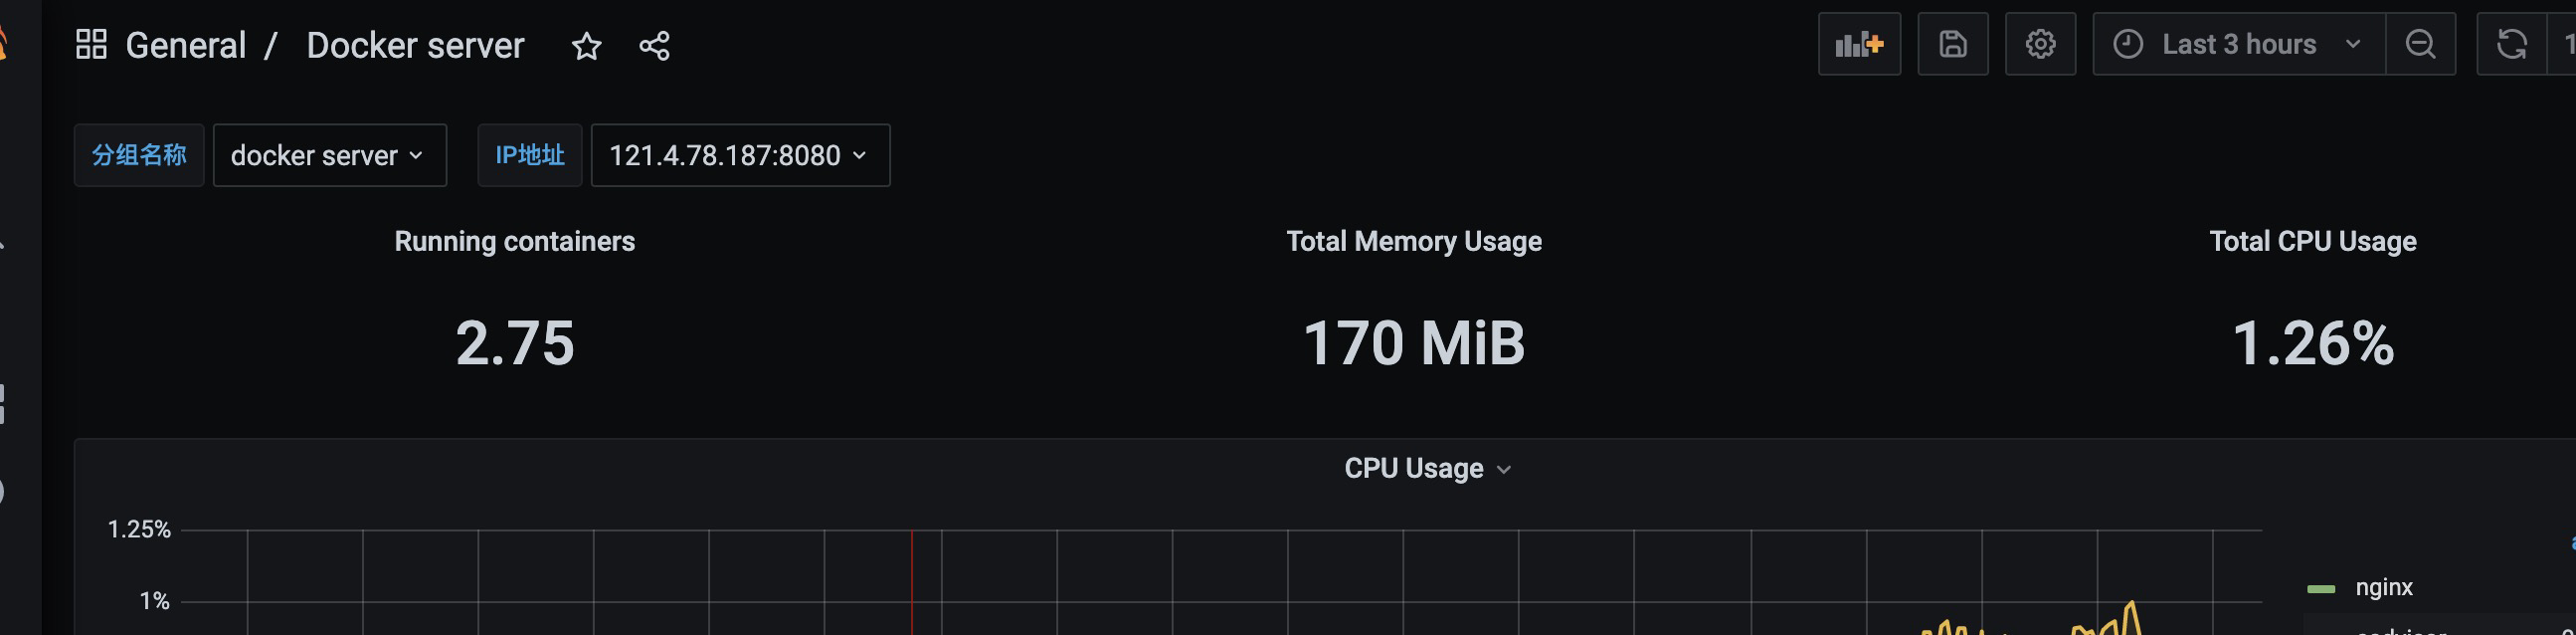
发现有了导航点击数据没有变化
我们需要修改图表信息
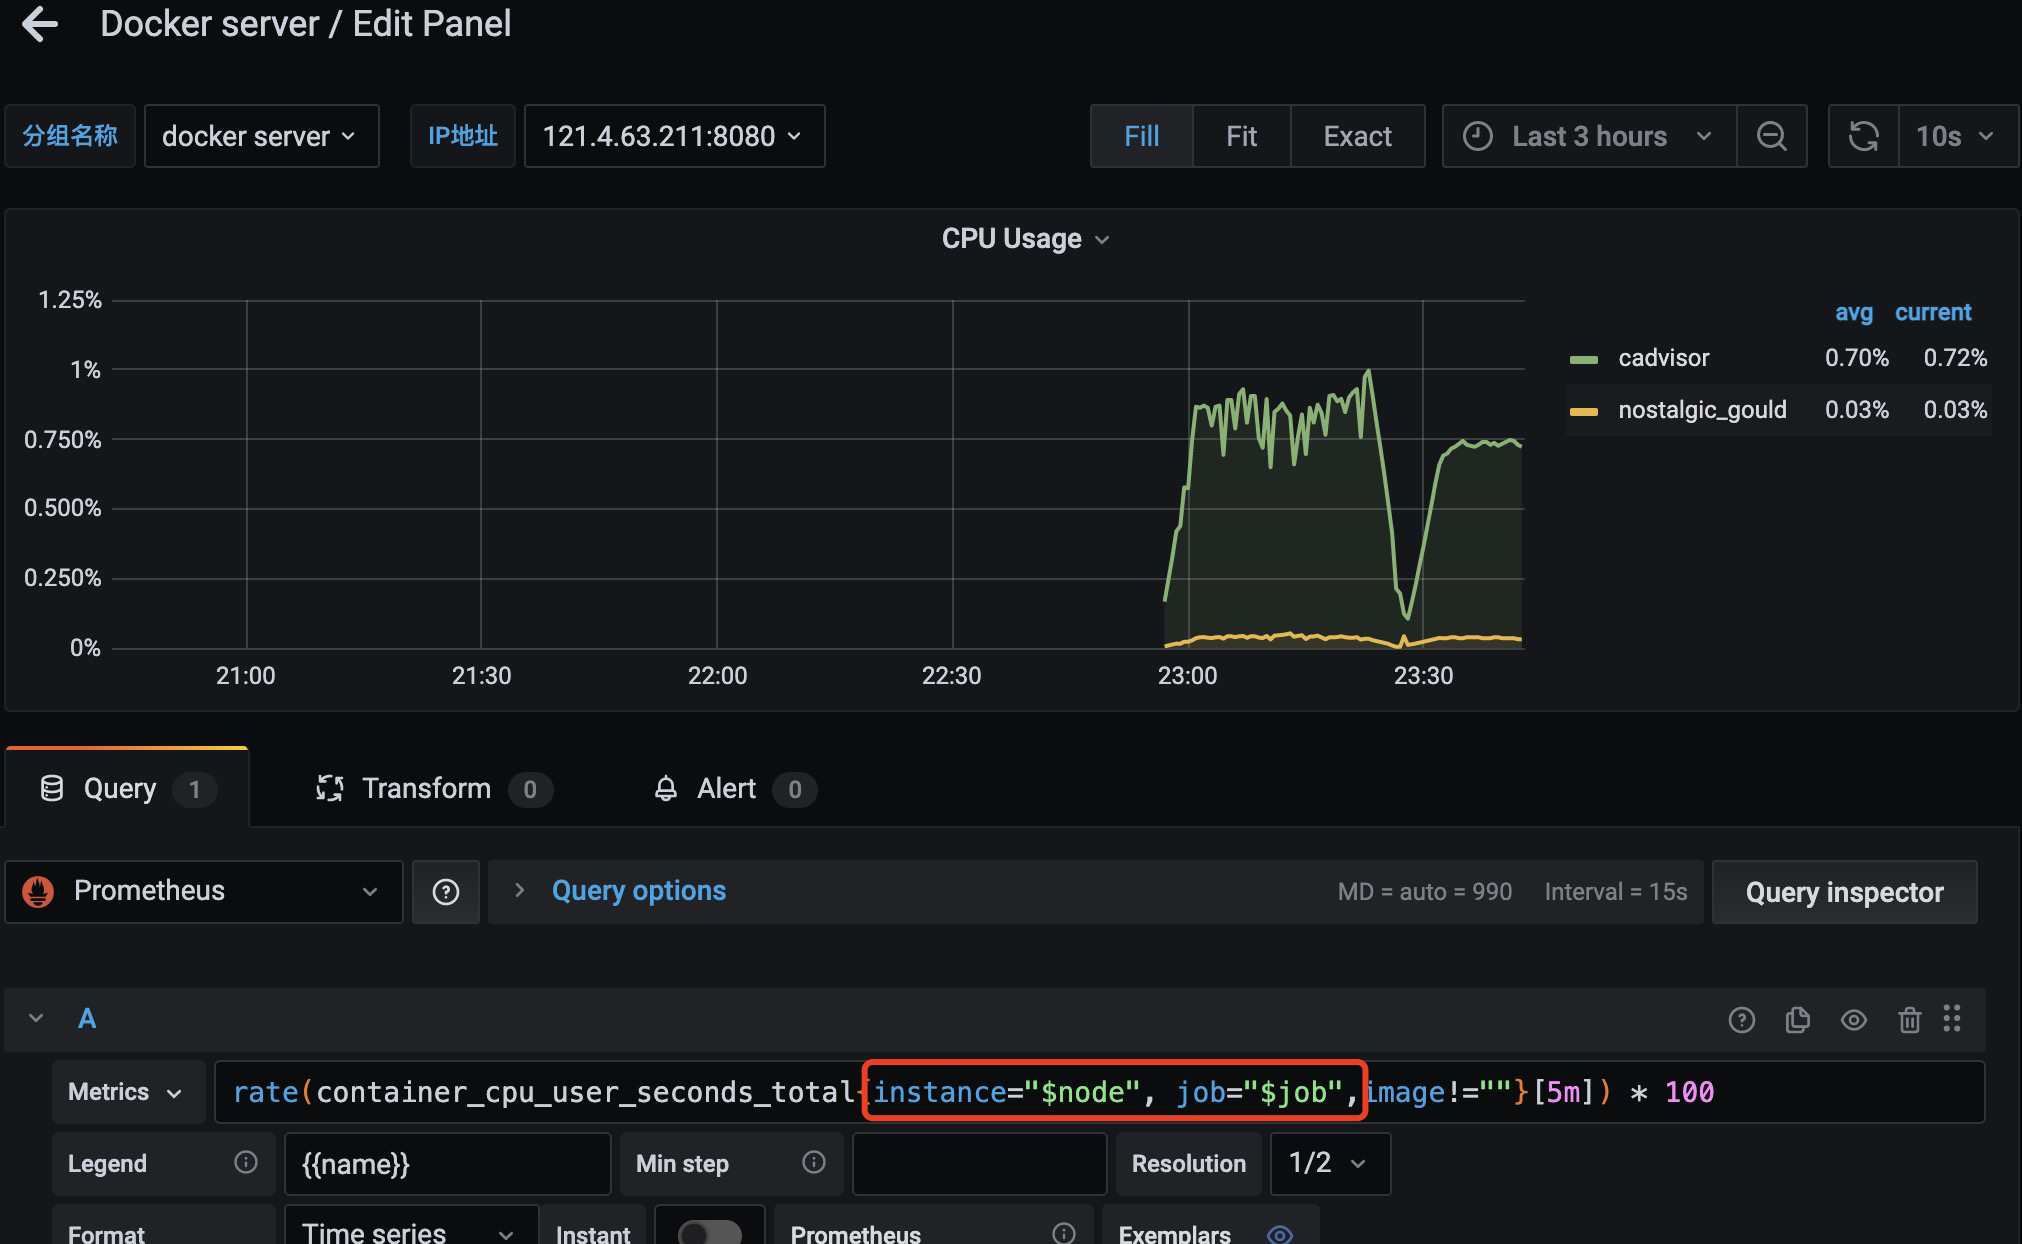
每张图片添加如上信息
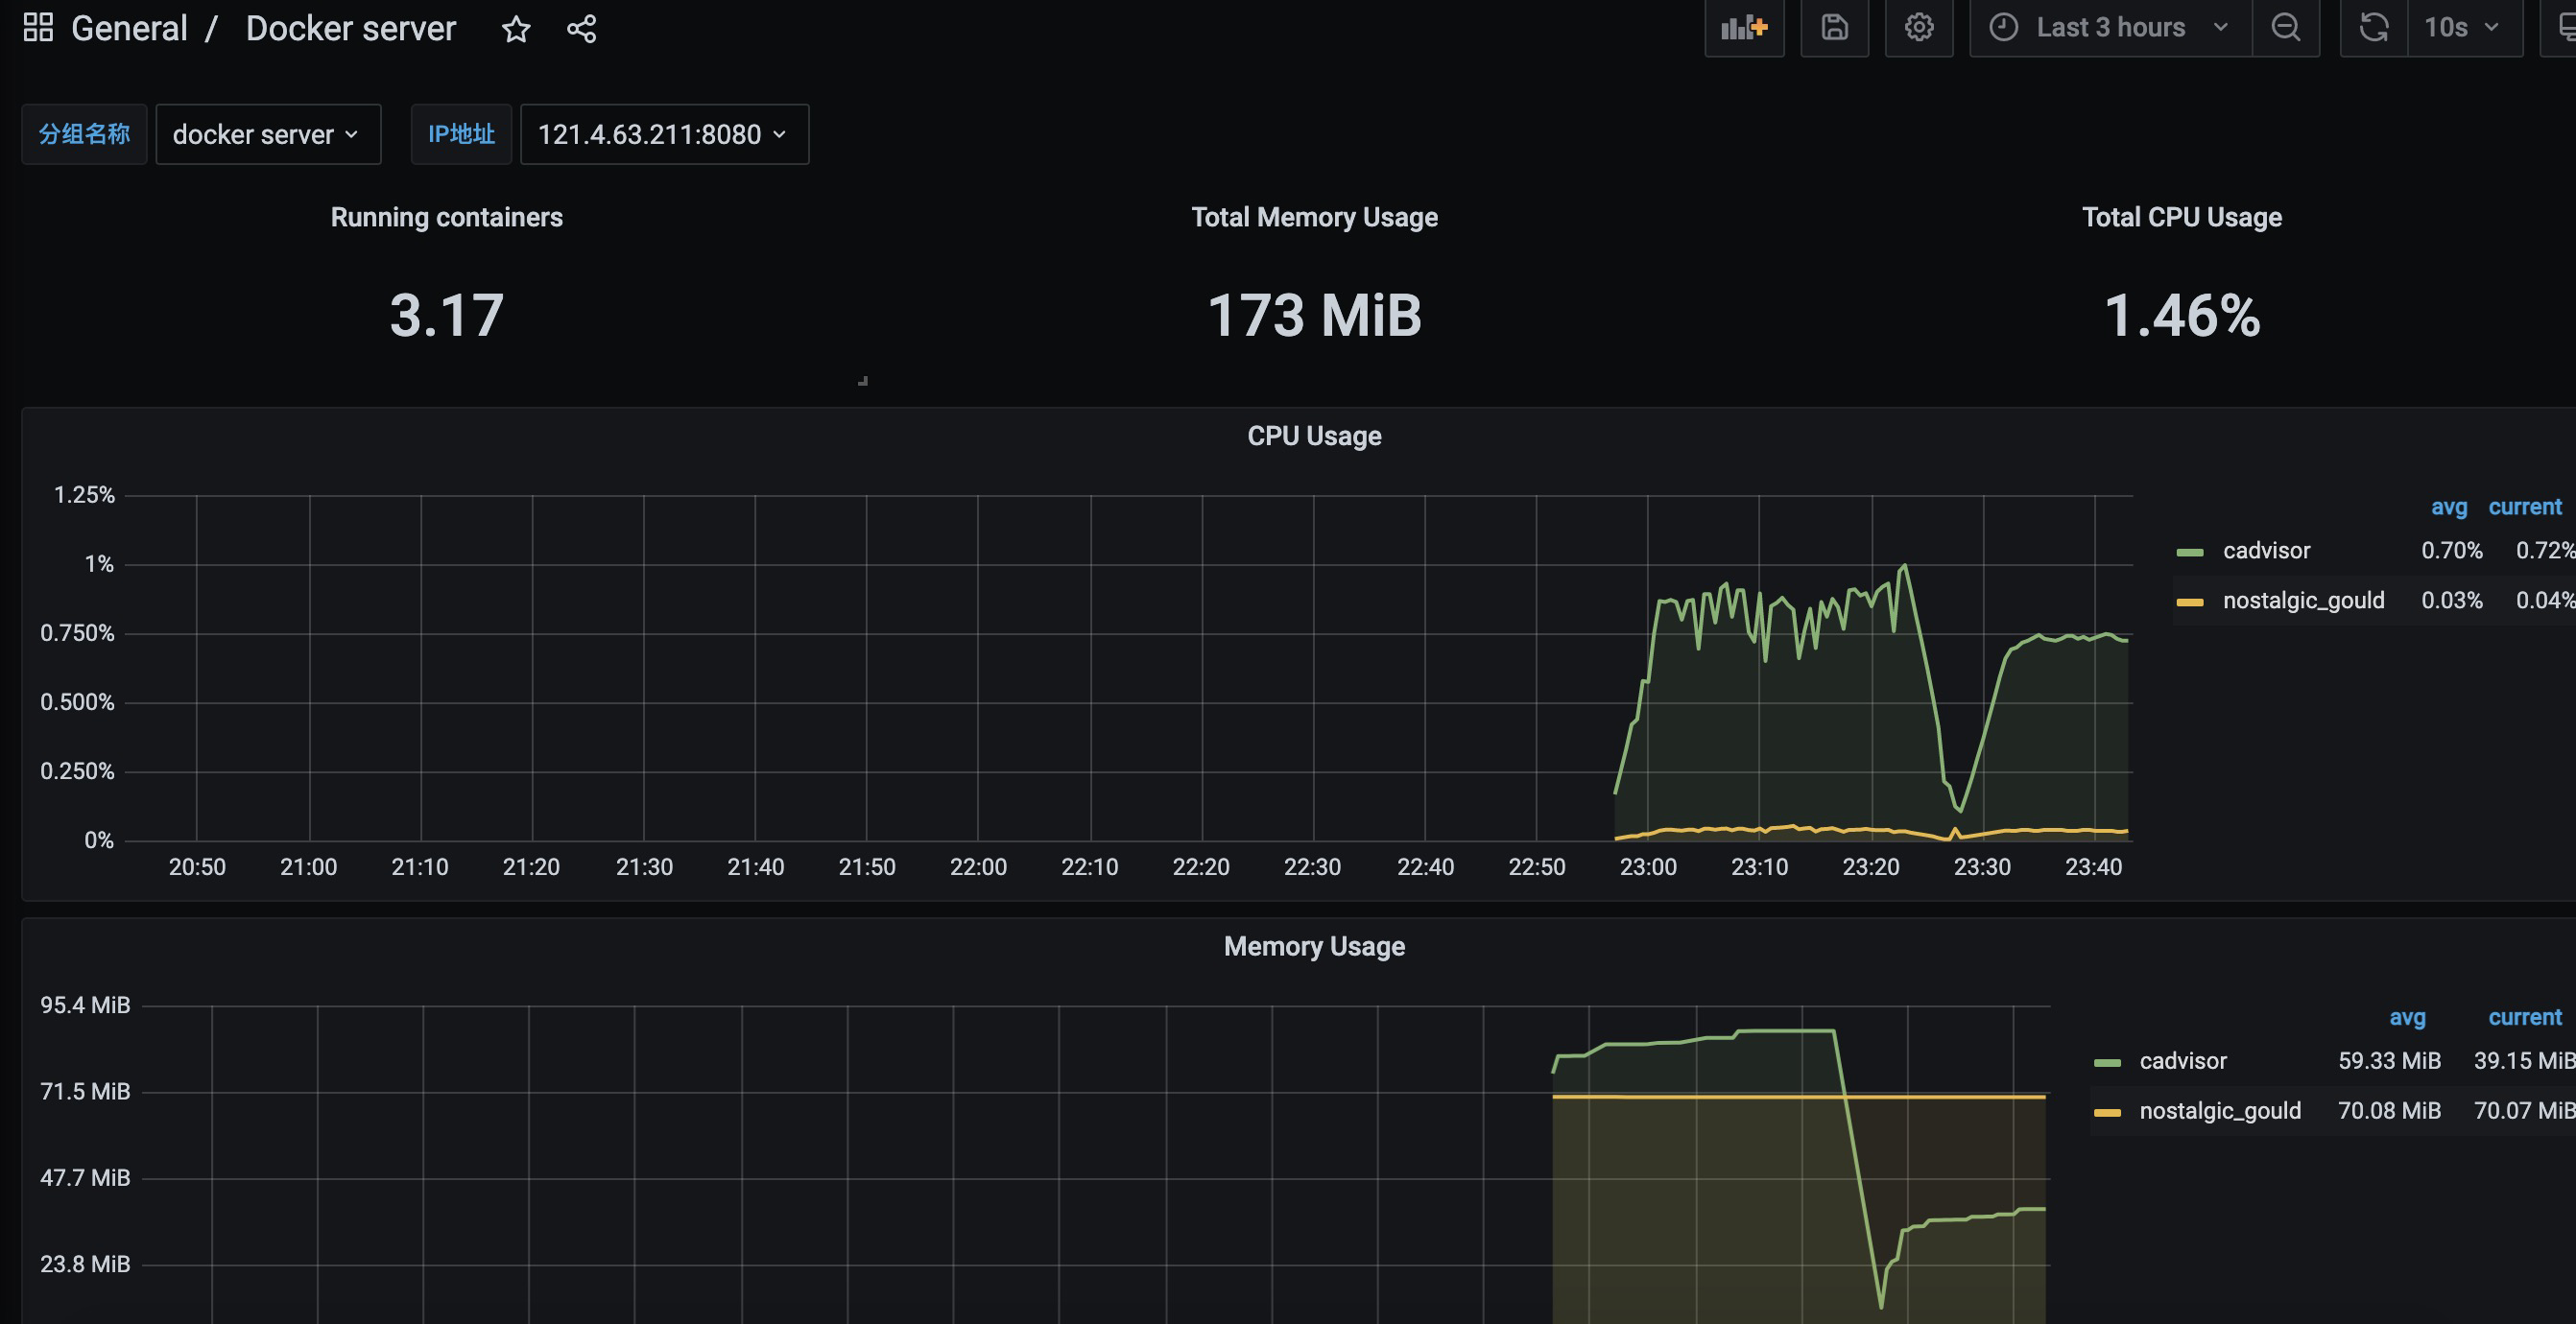
发现修改之后,就有了变化了
prometheus-监控docker服务器的更多相关文章
- Prometheus 监控Docker服务器及Granfanna可视化
Prometheus 监控Docker服务器及Granfanna可视化 cAdvisor(Container Advisor)用于收集正在运行的容器资源使用和性能信息. 使用Prometheus监控c ...
- Prometheus 监控linux服务器
Prometheus 监控linux服务器 node_exporter:用于*NIX系统监控,使用Go语言编写的收集器. 使用版本 node_exporter 0.17.0 相关文档 使用文档:htt ...
- Prometheus 监控Mysql服务器及Grafana可视化
Prometheus 监控Mysql服务器及Grafana可视化. mysql_exporter:用于收集MySQL性能信息. 使用版本 mysqld_exporter 0.11.0 官方地址 使用文 ...
- Prometheus监控Docker Swarm集群(一)
Prometheus监控Docker Swarm集群(一) cAdvisor简介 为了解决容器的监控问题,Google开发了一款容器监控工具cAdvisor(Container Advisor),它为 ...
- Grafana连接Prometheus监控Docker平台
Grafana是一款开源的分析平台. Grafana allows you to query, visualize, alert on and understand your metrics no m ...
- Prometheus入门到放弃(4)之cadvisor监控docker容器
Prometheus监控docker容器运行状态,我们用到cadvisor服务,cadvisor我们这里也采用docker方式直接运行. 1.下载镜像 [root@prometheus-server ...
- prometheus监控(小试牛刀)
prometheus监控(小试牛刀) 环境:全部服务都是基于docker运行 本文略微草率,好文章在这里,特别好如下: https://www.cnblogs.com/tchua/p/11120228 ...
- 6. 使用cadvisor监控docker容器
Prometheus监控docker容器运行状态,我们用到cadvisor服务,cadvisor我们这里也采用docker方式直接运行.这里我们可以服务端和客户端都使用cadvisor 客户端 1.下 ...
- cAdvisor+Prometheus+Grafana监控docker
cAdvisor+Prometheus+Grafana监控docker 一.cAdvisor(需要监控的主机都要安装) 官方地址:https://github.com/google/cadvisor ...
- 使用docker方式构建prometheus监控的学习
一.背景:近期学习部署prometheus监控系统,经研究发现prometheus提供docker运行模式.根据我的经验,能够使用docker模式构建系统一定多快好省. 二.环境: 1.centos7 ...
随机推荐
- C++ 标准文档
正式的 C++ 标准文档不是免费的,需要付费购买,可以到 ISO Store 或者其成员国的标准商店购买正版(中国 SACinfo 标准信息服务网,美国 ANSI WebStore,其他成员国可查看 ...
- zabbix企业监控
第一节.系统初始化 1.前期环境 主机名 IP地址 操作系统 备注 zabbix-10 192.168.2.10 CentOS Linux release 7.4 zabbix服务端 agent-15 ...
- Hbase之理论
第1章 HBase简介 1.1 什么是HBase HBase的原型是Google的BigTable论文,受到了该论文思想的启发,目前作为Hadoop的子项目来开发维护,用于支持结构化的数据存储. 官方 ...
- Mybatis-Plus自动生成器生成代码基于springboot项目启动
创建springbootweb项目 pom.xml 导入 MBP 依赖 <dependency> <groupId>com.baomidou</groupId> & ...
- 规则引擎深度对比,LiteFlow vs Drools!
前言 Drools是一款老牌的java规则引擎框架,早在十几年前,我刚工作的时候,曾在一家第三方支付企业工作.在核心的支付路由层面我记得就是用Drools来做的. 难能可贵的是,Drools这个项目在 ...
- Chrony时间同步服务
概: 网络时间协议(Network Time Protocol,NTP)是用于网络时间同步的协议.提供NTP时间同步服务的软件有很多,这里采用Chrony软件来实现时间同步 chrony 的优势: ...
- 19.-哈希算法&注册登录
一.哈希算法 哈希: 给定明文-计算出一段定长的-不可逆的值 定长输出:不管明文输入多少,哈希都是定长的 不可逆:无法反向计算出对应的明文 雪崩效应:输入改变,输出必然变 md5:32位16进制 ...
- Istio(十一):向istio服务网格中引入虚拟机
目录 一.模块概览 二.系统环境 三.虚拟机负载 3.1 虚拟机负载 3.2 单网络架构 3.3 多网络架构 3.4 Istio 中如何表示虚拟机工作负载? 四.实战:向istio Mesh中引入虚拟 ...
- go基础语法50问,来看看你的go基础合格了吗?
目录 1.使用值为 nil 的 slice.map会发生啥 2.访问 map 中的 key,需要注意啥 3.string 类型的值可以修改吗 4.switch 中如何强制执行下一个 case 代码块 ...
- 实例解读丨关于GaussDB ETCD服务异常
摘要:本文通过对ETCD服务异常问题分析,代码展示解决方案. 本文分享自华为云社区<[实例状态]GaussDB ETCD服务异常>,作者:酷哥. 首先确认是否是虚拟机.网络故障 虚拟机故障 ...