prometheus学习系列十一: Prometheus pushgateway的使用
由于网络问题或者安全问题,可能我们的数据无法直接暴露出一个entrypoint 给prometheus采集。 这个时候可能就需要一个pushgateway来作为中间者完成中转工作。 prometheus还是采用pull方式来采集pushgateway的数据,我们的采集端通过push方式把数据push给pushgateway,来完成数据的上报。
pushgateway的安装
[root@node01 src]# wget https://github.com/prometheus/pushgateway/releases/download/v0.10.0/pushgateway-0.10.0.linux-amd64.tar.gz

[root@node01 src]# tar xf pushgateway-0.10.0.linux-amd64.tar.gz

[root@node01 src]# ll

total 8732

drwxr-xr-x. 2 root root       6 Nov  5  2016 debug

drwxr-xr-x. 2 root root       6 Nov  5  2016 kernels

drwxr-xr-x  2 3434 3434      54 Oct 10 19:29 pushgateway-0.10.0.linux-amd64

-rw-r--r--  1 root root 8940709 Oct 10 19:30 pushgateway-0.10.0.linux-amd64.tar.gz

[root@node01 src]# mv pushgateway-0.10.0.linux-amd64 /usr/local/^C

[root@node01 src]# mkdir /usr/local/prometheus

[root@node01 src]# mv pushgateway-0.10.0.linux-amd64 /usr/local/prometheus/

[root@node01 src]# cd  /usr/local/prometheus/

[root@node01 prometheus]# ls

pushgateway-0.10.0.linux-amd64

[root@node01 prometheus]# ln -s pushgateway-0.10.0.linux-amd64/ pushgateway

[root@node01 prometheus]# ll

total 0

lrwxrwxrwx 1 root root 31 Oct 11 04:00 pushgateway -> pushgateway-0.10.0.linux-amd64/

drwxr-xr-x 2 3434 3434 54 Oct 10 19:29 pushgateway-0.10.0.linux-amd64
pushgateway的配置
[root@node01 system]#  cd /usr/lib/systemd/system

[root@node01 system]#  vim pushgateway.service

[root@node01 system]# cat pushgateway.service

[Unit]

Description=prometheus

After=network.target

[Service]

User=prometheus

Group=prometheus

WorkingDirectory=/usr/local/prometheus/pushgateway

ExecStart=/usr/local/prometheus/pushgateway/pushgateway \

                --web.enable-admin-api  \

                --persistence.file="pushfile.txt" \

                --persistence.interval=10m

[Install]

WantedBy=multi-user.target

[root@node01 system]# systemctl enable pushgateway

Created symlink from /etc/systemd/system/multi-user.target.wants/pushgateway.service to /usr/lib/systemd/system/pushgateway.service.

[root@node01 system]# systemctl start pushgateway

[root@node01 system]# systemctl status pushgateway
注意: 上面的持久文件如果存储量大,需要考虑配置单独的磁盘来存储。
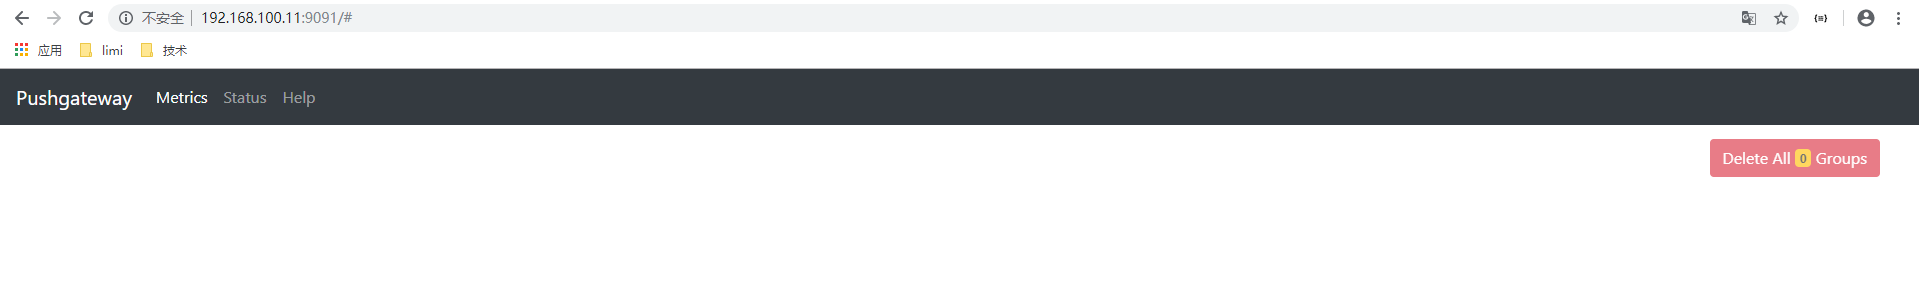
测试web页面
配置采集push端
添加一个数据,查看结果
[root@node02 ~]# !vim

vim push_memory.sh
#!/bin/bash
# desc push memory info

total_memory=$(free  |awk '/Mem/{print $2}')
used_memory=$(free  |awk '/Mem/{print $3}')

job_name="custom_memory"
instance_name="192.168.100.12"

cat <<EOF | curl --data-binary @- http://192.168.100.11:9091/metrics/job/$job_name/instance/$instance_name
#TYPE custom_memory_total  gauge
custom_memory_total $total_memory
#TYPE custom_memory_used  gauge
custom_memory_used $used_memory
EOF

# 执行导入
bash push_memory.sh
插入数据后效果图

集成prometheus
添加pushgateway的采集
# 修改prometheus.yml 加入如下片段

 - job_name: "custom-memory-pushgateway"

    #honor_labels: true

    static_configs:

    - targets: ["192.168.100.11:9091"]
持续生成数据
上面执行的 push_memory.sh脚本也就是只是插入一次数据, 我们这里使用计划任务来周期push数据到pushgateway中。
[root@node02 ~]# crontab  -e

no crontab for root - using an empty one

 * * * * /root/push_memory.sh

[root@node02 ~]# chmod a+x push_memory.sh
效果图
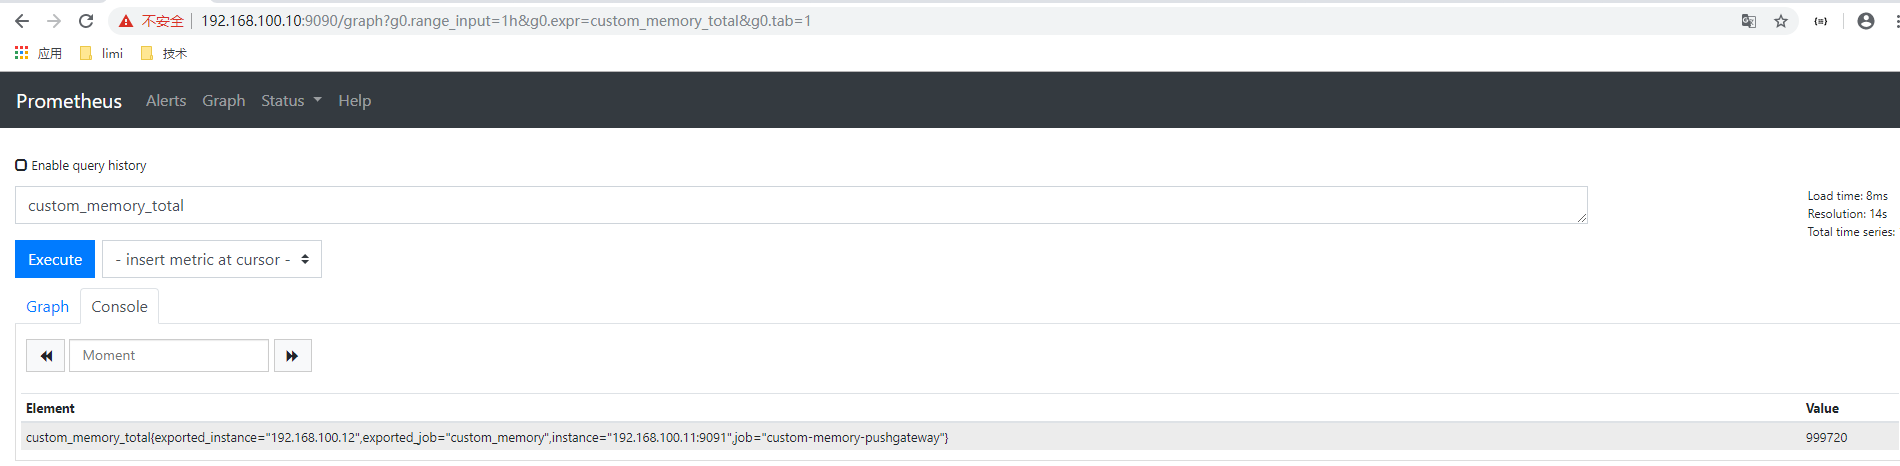
可以发现instance和job标签有点问题, 这是pushgateway填充的, 我们可以加入honor配置使用我们自定义的。
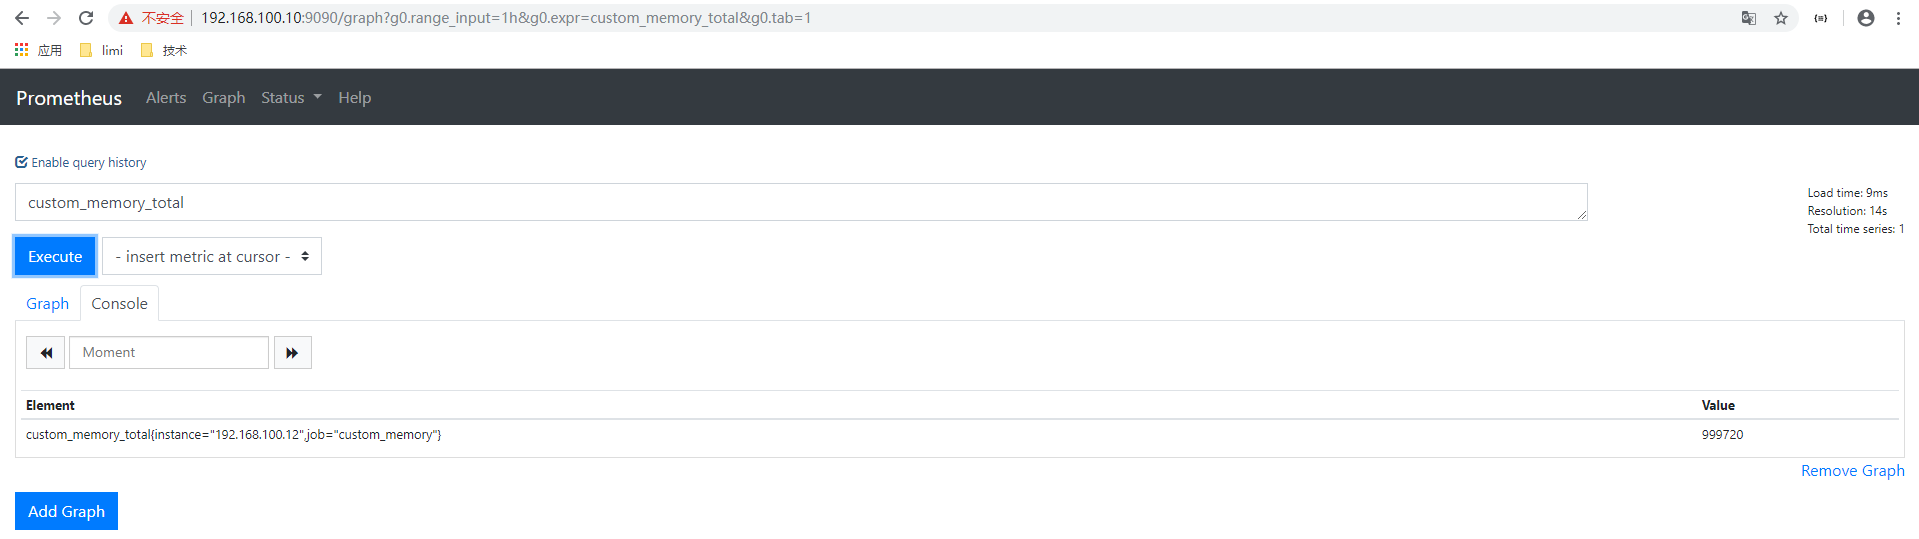
修改配置如下
  - job_name: "custom-memory-pushgateway"

    honor_labels: true

    static_configs:

    - targets: ["192.168.100.11:9091"]
效果图
总结
我们可以通过pushgateway来辅助采集。 此场景中,我们假定的192.168.100.10这个prometheus server服务器是到192.168.100.12网络是不通的, 但是192.168.100.11 这个ip地址是可以和2个ip是通的, 这里就可以在192.168.100.11 这个服务器上面部署pushgateway来作为桥梁, 采集到192.168.100.12的监控数据。
prometheus学习系列十一: Prometheus pushgateway的使用的更多相关文章
- prometheus学习系列十一: Prometheus 安全
prometheus安全 我们这里说的安全主要是基本认证和https2种, 目前这2种安全在prometheus中都没有的, 需要借助第三方软件实现, 这里以nginx为例. 基本认证 配置基本认证 ...
- prometheus学习系列十一: Prometheus和AlertManager的高可用
前面的系列中, prometheus和alertmanager都是单机部署的,会有单机宕机导致系统不可用情况发生.本文主要介绍下prometheus和alertmanager的高可用方案. 服务的高可 ...
- prometheus学习系列十一: Prometheus exporter详解
exporter详解 前面的系列中,我们在主机上面安装了node_exporter程序,该程序对外暴露一个用于获取当前监控样本数据的http的访问地址, 这个的一个程序成为exporter,Expor ...
- prometheus学习系列十一: Prometheus 采集器的编写
在前面的文章已经写了官方的几个exporter的使用了. 在实际使用环境中,我们可能需要收集一些自定义的数据, 这个时候我们一般是需要自己编写采集器的. 快速入门编写一个入门的demo 编写代码 fr ...
- prometheus学习系列十一: Prometheus 报警规则配置
prometheus监控系统的的报警规则是在prometheus这个组件完成配置的. prometheus支持2种类型的规则,记录规则和报警规则, 记录规则主要是为了简写报警规则和提高规则复用的, 报 ...
- Prometheus学习系列(六)之Prometheus 查询说明
前言 本文来自Prometheus官网手册和 Prometheus简介 Prothetheus查询 Prometheus提供一个函数式的表达式语言PromQL (Prometheus Query La ...
- Prometheus学习系列(九)之Prometheus 联盟、迁移
前言 本文来自Prometheus官网手册 和 Prometheus简介 FEDERATION 允许Prometheus服务器从另一台Prometheus服务器抓取选定的时间序列. 一,用例 联盟有不 ...
- Prometheus学习系列(五)之Prometheus 规则(rule)、模板配置说明
前言 本文来自Prometheus官网手册1.2.3.4和 Prometheus简介1.2.3.4 记录规则 一.配置规则 Prometheus支持两种类型的规则,这些规则可以定期配置,然后定期评估: ...
- Prometheus学习系列(二)之Prometheus FIRST STEPS
前言 本文来自Prometheus官网手册 和 Prometheus简介 说明 Prometheus是一个监控平台,通过在监控目标上的HTTP端点来收集受监控目标的指标.本指南将向您展示如何使用Pro ...
随机推荐
- prototype、__proto__、constructor
prototype:每个函数都有一个prototype属性,这个属性指向一个对象,这个对象叫原型对象. 作用:节约内存.扩展属性和方法.可以实现类之间的继承 __proto__:每个通过构造函数new ...
- django -- ORM建表
前戏 ORM(Object Relational Mapping,简称ORM)模式是一种为了解决面向对象与关系数据库存在的互不匹配的现象的技术. ORM的优势: ORM解决的主要问题是对象和关系的映射 ...
- 转载:tensorflow保存训练后的模型
训练完一个模型后,为了以后重复使用,通常我们需要对模型的结果进行保存.如果用Tensorflow去实现神经网络,所要保存的就是神经网络中的各项权重值.建议可以使用Saver类保存和加载模型的结果. 1 ...
- System.getProperty("line.separator") 是什么意思?
在java中存在一些转义字符,比如"\n"为换行符,但是也有一些JDK自带的一些操作符 比如 : System.getProperty("line.separator&q ...
- PostgreSQL中的Toast Pointer
1.分析背景 在使用数据库的过程中(PG的版本为9.2),遇到了错误"missing chunk number 0 for toast value XX in pg_toast_2619&q ...
- hanlp进行命名实体识别
需要安装jpype先,这个是python调用java库的桥梁. # -*- coding: utf-8 -*- """ Created on Thu May 10 09: ...
- 把jar包安装到本地Maven仓库
使用的场景 自己写的工具类想安装到本地 从Maven仓库中下载不下来的jar 使用的步骤 首先要保证自己的Maven配置全局环境变量,如果没有配置过maven全局变量,可以按照下面的步骤配 ...
- Java随堂笔记二
变量常量类型转换和命名规范 变量和常量 static double salary = 2500; //属性:变量 //变量作用域: //类变量 static // 局部变量 ...
- ubuntu docker inflxudb(安装 使用 备份 还原 以及python编码) telegraf Grafana
inflxudb1.7.7 1.拉取最新的镜像 docker pull influxdb 2.运行实例: docker run -d --restart=always -p 8086:8086 -p ...
- Logback获取SkyWalking的全局唯一标识 trace-id 记录到日志中
为什么要获取trace-id 通过上文Docker-Compose搭建单体SkyWalking我们搭建了SkyWalking服务,我们需要在日志中记录下来每次请求的唯一标识(trace-id),这样就 ...