
7.prometheus监控多个MySQL实例
mysqld_exporter集中部署
集中部署,就是说我们将所有的mysqld_exporter部署在同一台服务器上,在这台服务器上对mysqld_exporter进行统一的管理,下面介绍一下集中部署的方法。这里我们专门起一台IP为172.18.0.23的服务器,另外两台172.18.0.11和172.18.0.13作为2个MySQL节点。
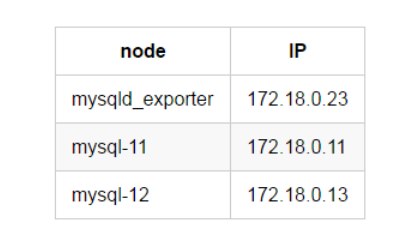
在172.18.0.23上下载安装mysqld_exporter
略
添加172.18.0.11节点
1、在172.18.0.11上建立监控用户
GRANT SELECT, PROCESS, SUPER, REPLICATION CLIENT, RELOAD ON *.* TO 'pmm'@'%' IDENTIFIED BY 'pmm';
2、在172.18.0.23上编辑172.18.0.11节点的配置文件
[root@mysqld_exporter-23 /]# cd /data/mysqld_exporter/

[root@mysqld_exporter-23 mysqld_exporter]# cat etc/.dk-11.cnf

[client]

user=pmm

password=pmm

host=172.18.0.11

port=3306
3、在172.18.0.23上启动mysqld_exporter
[root@mysqld_exporter-23 ~]# cd /data/mysqld_exporter/

[root@mysqld_exporter-23 mysqld_exporter]# nohup ./mysqld_exporter --web.listen-address=172.18.0.23:9104 --config.my-cnf=etc/.dk-11.cnf --collect.auto_increment.columns --collect.binlog_size --collect.global_status --collect.global_variables --collect.info_schema.innodb_metrics --collect.info_schema.innodb_cmp --collect.info_schema.innodb_cmpmem --collect.info_schema.processlist --collect.info_schema.query_response_time --collect.info_schema.tables --collect.info_schema.tablestats --collect.info_schema.userstats --collect.perf_schema.eventswaits --collect.perf_schema.file_events --collect.perf_schema.indexiowaits --collect.perf_schema.tableiowaits --collect.perf_schema.tablelocks --collect.slave_status &
这里看到mysqld_exporter的启动多了两个选项,"--web.listen-address"和"--config.my-cnf"。
web.listen-address代表这个mysqld_exporter进程绑定的端口,以供prometheus调用,这里暴露的是172.18.0.23的9104端口。
config.my-cnf代表这个mysqld_exporter进程监控的MySQL的连接信息。
4、在prometheus服务器配置prometheus文件
[root@prometheus-21 /]# cd /data/prometheus/

[root@prometheus-21 prometheus]# cat prometheus.yml

# my global config

global:

  scrape_interval: 15s # Set the scrape interval to every 15 seconds. Default is every 1 minute.

  evaluation_interval: 15s # Evaluate rules every 15 seconds. The default is every 1 minute.

# A scrape configuration containing exactly one endpoint to scrape:

scrape_configs:

  - file_sd_configs:

    - files:

      - mysql.yml

    job_name: MySQL

    metrics_path: /metrics

    relabel_configs:

    - source_labels: [__address__]

      regex: (.*)

      target_label: __address__

      replacement: $1
5、在prometheus服务器配置mysql.yml文件
[root@prometheus-21 prometheus]# cat mysql.yml

- labels:

    instance: dk-11:3306 # grafana显示的实例的别名

  targets:

  - 172.18.0.23:9104 # mysqld_exporter暴露的端口
mysql.yml的172.18.0.23:9104会通过prometheus配置文件中的file_sd_configs配置,作为变量传给$1,然后替换__address__,因而被prometheus所识别。
6、使prometheus配置生效
[root@prometheus-21 prometheus]# pgrep -fl prometheus

33 /data/prometheus/prometheus --storage.tsdb.retention=30d

[root@prometheus-21 prometheus]# kill -HUP 33
prometheus.yml文件更改后需要上述操作后生效,mysql.yml修改后prometheus会自动识别。
7、验证172.18.0.11是否添加成功
浏览器输入Prometheus_IP:9090
浏览器输入Grafana_IP:3000
添加172.18.0.13节点
添加新的节点到监控,只需要做4步就可以。
1、在172.18.0.13上建立监控用户
GRANT SELECT, PROCESS, SUPER, REPLICATION CLIENT, RELOAD ON *.* TO 'pmm'@'%' IDENTIFIED BY 'pmm';
2、在172.18.0.23上编辑172.18.0.13节点的配置文件
[root@mysqld_exporter-23 /]# cd /data/mysqld_exporter/

[root@mysqld_exporter-23 mysqld_exporter]# cat etc/.dk-13.cnf

[client]

user=pmm

password=pmm

host=172.18.0.13

port=3306
3、在172.18.0.23上启动mysqld_exporter
[root@mysqld_exporter-23 ~]# cd /data/mysqld_exporter/

[root@mysqld_exporter-23 mysqld_exporter]# nohup ./mysqld_exporter --web.listen-address=172.18.0.23:9105 --config.my-cnf=etc/.dk-13.cnf --collect.auto_increment.columns --collect.binlog_size --collect.global_status --collect.global_variables --collect.info_schema.innodb_metrics --collect.info_schema.innodb_cmp --collect.info_schema.innodb_cmpmem --collect.info_schema.processlist --collect.info_schema.query_response_time --collect.info_schema.tables --collect.info_schema.tablestats --collect.info_schema.userstats --collect.perf_schema.eventswaits --collect.perf_schema.file_events --collect.perf_schema.indexiowaits --collect.perf_schema.tableiowaits --collect.perf_schema.tablelocks --collect.slave_status &

# 这里暴露的是9105端口,使用的是.dk-13.cnf的文件。
4.在prometheus服务器配置mysql.yml文件
[root@prometheus-21 prometheus]# cat mysql.yml

- labels:

    instance: dk-11:3306

  targets:

  - 172.18.0.23:9104

- labels:

    instance: dk-13:3306

  targets:

  - 172.18.0.23:9105
只需要添加172.18.0.13的mysqld_exporter对应的端口和别名就可以。
5、验证172.18.0.13是否添加成功
浏览器输入Prometheus_IP:9090
浏览器输入Grafana_IP:3000
集中管理
当我们需要添加新的节点,只需要将新节点的连接信息配置好,划分新的端口,启动mysqld_exporter,然后在prometheus中的mysql.yml文件添加新节点暴露的端口以及新节点的自定义别名就可以了。
这样我们就可以在mysqld_exporter节点上对mysqld_exporter的进程进行统一管理了。
改造
文章地址:https://www.cnblogs.com/sanduzxcvbnm/p/13094580.html
根据这篇文章的讲述,可以稍加改造,使用多个mysqld_exporter.service服务,名称区分开,比如mysqld_exporter1.service,mysqld_exporter2.service等,在每个里面配置上数据库的连接信息
7.prometheus监控多个MySQL实例的更多相关文章
- k8s中prometheus监控k8s外mysql
k8s外安装mysql https://www.cnblogs.com/uncleyong/p/10739530.html 配置MySQL Exporter采集MySQL监控数据 创建yaml文件:v ...
- 使用 Docker 部署 Grafana + Prometheus 监控 MySQL 数据库
一.背景 在平时开发过程当中需要针对 MySQL 数据库进行监控,这里我们可以使用 Grafana 和 Prometheus 来实现监控功能.Grafana 是一款功能强大的仪表盘面板,支持多种数据源 ...
- Docker监控平台prometheus和grafana,监控redis,mysql,docker,服务器信息
Docker监控平台prometheus和grafana,监控redis,mysql,docker,服务器信息 一.通过redis_exporter监控redis 1.1 下载镜像 1.2 运行服务 ...
- [k8s]prometheus+grafana监控node和mysql(普罗/grafana均vm安装)
https://github.com/prometheus/prometheus Architecture overview Prometheus Server Prometheus Server 负 ...
- Grafana+Prometheus 监控 MySQL
转自:Grafana+Prometheus 监控 MySQL 架构图 环境 IP 环境 需装软件 192.168.0.237 mysql-5.7.20 node_exporter-0.15.2.lin ...
- Prometheus 监控Mysql服务器及Grafana可视化
Prometheus 监控Mysql服务器及Grafana可视化. mysql_exporter:用于收集MySQL性能信息. 使用版本 mysqld_exporter 0.11.0 官方地址 使用文 ...
- 手把手教你使用 Prometheus 监控 MySQL 与 MariaDB.md
概述 MySQL 是常用的关系型数据库,MariaDB 作为 MySQL 的分支版本,兼容 MySQL 协议,也越来越流行.在 Kubernetes 环境中如何使用 Prometheus 来对它们进行 ...
- Kubernetes容器集群管理环境 - Prometheus监控篇
一.Prometheus介绍之前已经详细介绍了Kubernetes集群部署篇,今天这里重点说下Kubernetes监控方案-Prometheus+Grafana.Prometheus(普罗米修斯)是一 ...
- 使用Prometheus监控SpringBoot应用
通过之前的文章我们使用Prometheus监控了应用服务器node_exporter,数据库mysqld_exporter,今天我们来监控一下你的应用.(本文以SpringBoot 2.1.9.REL ...
随机推荐
- Linux教我们丢掉键盘
前言 本篇博客并非博主编写,而是跟着黑马教程整理的. 因为Linux都是一些操作命令,也不想深入研究,所以就用此博客记录一下平时的基本知识,方便日后查找. 一.常用命令 命令 对应英文 作用 ls l ...
- markdown练习显示
1.[markdown学习网址1]https://sspai.com/post/25137 2.[markdown学习网址1]https://www.runoob.com/markdown/md-pa ...
- day01--DOS常用命令
打开CMD的方式 开始+系统+命令提示符 Win键+R输入cmd打开控制台(推荐使用) 在任意的文件夹下面,按住shift键+鼠标右键点击,在此处打开命令行窗口 资源管理器的地址栏前面加,上cmd路径 ...
- Trie树模板1字符串统计
Trie树模板1字符串统计 我们首先来了解一下字典树,首先看一下一张字典树的图片 字典树就是一个可以高效存储.查找字符串的树,比如上面这个字典树就是存储abc,acb,bac的字典树. 1.插入操作( ...
- 1000-ms-HashMap 线程安全安全问题
问题: HashMap是否是线程安全 详解 http://www.importnew.com/21396.html 有源码分析 和代码性能比较 CHM性能最好 HashMap不是线程安全的:Hasht ...
- Linux系列之进程管理
前言 进程是正在运行的程序,Linux系统通常有数百个进程同时运行.本文就来介绍下Linux是如何进行进程管理的. 我们可以看到: 查看进程(Viewing processes) 查找进程(Findi ...
- mysql常见用法
查看连接数show processlist; 查看慢日志 show variables like '%slow_query_log%'; show variables like 'long_query ...
- YII XSS(跨站脚本攻击)
\Yii::$app->response->headers->add('X-XSS-Protection','0');//表示关闭YII的跨站脚本过滤//http://www.fro ...
- 【cartographer ros】十: 延时和误差分析
上一节介绍了在cartographer进行建图和定位(在线和离线). 本节将分析cartographer运行时的误差与延迟,主要是在线定位时的,并尝试优化解决. 目录 1,误差分析 a,硬件精度 b, ...
- Prometheus+Grafana+钉钉部署一个单机的MySQL监控告警系统
GreatSQL社区原创内容未经授权不得随意使用,转载请联系小编并注明来源. GreatSQL是MySQL的国产分支版本,使用上与MySQL一致. 目录 一.Prometheus 二.exporter ...