
Stanford coursera Andrew Ng 机器学习课程第二周总结(附Exercise 1)
Exercise 1:Linear Regression---实现一个线性回归
重要公式
1.h(θ)函数

2.J(θ)函数

思考一下,在matlab里面怎么表达?如下:

原理如下:(如果你懂了这道作业题,上面的也就懂了)

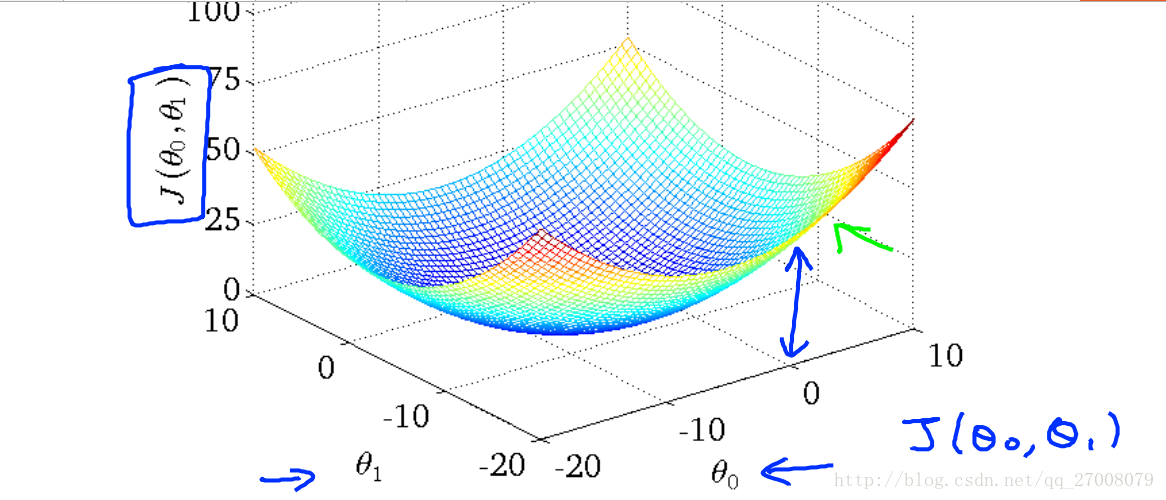
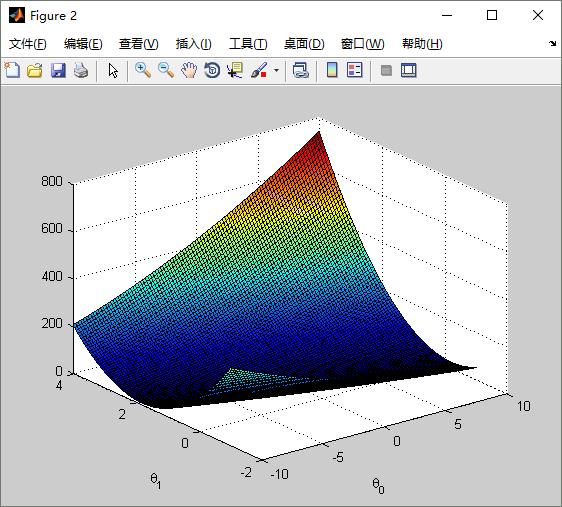
下面通过图形方式感受一下代价函数 :
3.θ迭代过程(梯度下降)
First way:批梯度下降:(编程作业使用这个公式,sum转换同理J(θ))

Second way:随机梯度下降:
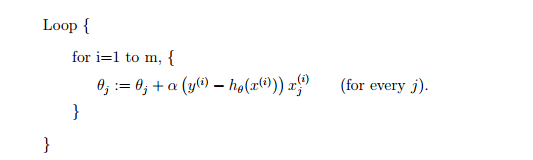
好比我们下山,每次在一点环顾四周,往最陡峭的路向下走,用图形的方式更形象的表示 :

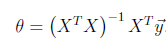
4.θ的直接求解法(让代价函数导数为0,求θ值)
编程作业答案(红色为添加代码)
1.warmUpExercise.m
function A = warmUpExercise()

%WARMUPEXERCISE Example function in octave

%   A = WARMUPEXERCISE() is an example function that returns the 5x5 identity matrix

% ============= YOUR CODE HERE ==============

% Instructions: Return the 5x5 identity matrix

%               In octave, we return values by defining which variables

%               represent the return values (at the top of the file)

%               and then set them accordingly.

A = eye(5,5);

% ===========================================

end
2.plotData.m
function plotData(x, y)

%PLOTDATA Plots the data points x and y into a new figure

%   PLOTDATA(x,y) plots the data points and gives the figure axes labels of

%   population and profit.

figure; % open a new figure window

% ====================== YOUR CODE HERE ======================

% Instructions: Plot the training data into a figure using the

%               "figure" and "plot" commands. Set the axes labels using

%               the "xlabel" and "ylabel" commands. Assume the

%               population and revenue data have been passed in

%               as the x and y arguments of this function.

%

% Hint: You can use the 'rx' option with plot to have the markers

%       appear as red crosses. Furthermore, you can make the

%       markers larger by using plot(..., 'rx', 'MarkerSize', 10);

plot(x,y, 'rx', 'MarkerSize', 10);

xlabel('Population of City in 10,000s');

ylabel('Profit in $10,000s');

% ============================================================

end
3.gradientDescent.m
function [theta, J_history] = gradientDescent(X, y, theta, alpha, num_iters)

%GRADIENTDESCENT Performs gradient descent to learn theta

%   theta = GRADIENTDESENT(X, y, theta, alpha, num_iters) updates theta by

%   taking num_iters gradient steps with learning rate alpha

% Initialize some useful values

m = length(y); % number of training examples

J_history = zeros(num_iters, );

for iter = :num_iters

    % ====================== YOUR CODE HERE ======================

    % Instructions: Perform a single gradient step on the parameter vector

    %               theta.

    %

    % Hint: While debugging, it can be useful to print out the values

    %       of the cost function (computeCost) and gradient here.

    %

    % ============================================================
theta = theta - (alpha/m)*X'*(X*theta-y); % theta 就是用上面的向量表示法的 matlab 语言实现
    % Save the cost J in every iteration

    J_history(iter) = computeCost(X, y, theta);

end

end
4.computeCost.m
function J = computeCost(X, y, theta)

%COMPUTECOST Compute cost for linear regression

%   J = COMPUTECOST(X, y, theta) computes the cost of using theta as the

%   parameter for linear regression to fit the data points in X and y

% Initialize some useful values

m = length(y); % number of training examples

% You need to return the following variables correctly

J = 0;

% ====================== YOUR CODE HERE ======================

% Instructions: Compute the cost of a particular choice of theta

%               You should set J to the cost.

J=1/(2*m)*(X*theta-y)'*(X*theta-y);

% =========================================================================

end
5.运行结果
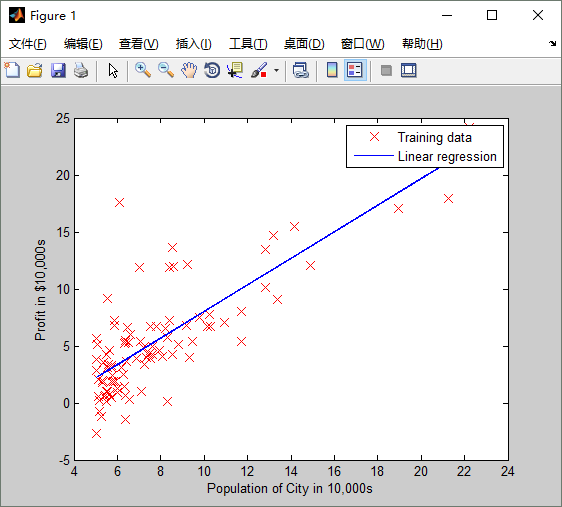
                      For population = 35,000, we predict a profit of 4519.767868

                      For population = 70,000, we predict a profit of 45342.450129
Stanford coursera Andrew Ng 机器学习课程第二周总结(附Exercise 1)的更多相关文章
- Stanford coursera Andrew Ng 机器学习课程编程作业(Exercise 2)及总结
Exercise 1:Linear Regression---实现一个线性回归 关于如何实现一个线性回归,请参考:http://www.cnblogs.com/hapjin/p/6079012.htm ...
- Stanford coursera Andrew Ng 机器学习课程编程作业(Exercise 1)
Exercise 1:Linear Regression---实现一个线性回归 在本次练习中,需要实现一个单变量的线性回归.假设有一组历史数据<城市人口,开店利润>,现需要预测在哪个城市中 ...
- Stanford coursera Andrew Ng 机器学习课程第四周总结(附Exercise 3)
Introduction Neural NetWork的由来 时,我们可以对它进行处理,分类.但是当特征数增长为时,分类器的效率就会很低了. Neural NetWork模型 该图是最简单的神经网络, ...
- 【原】Coursera—Andrew Ng机器学习—课程笔记 Lecture 15—Anomaly Detection异常检测
Lecture 15 Anomaly Detection 异常检测 15.1 异常检测问题的动机 Problem Motivation 异常检测(Anomaly detection)问题是机器学习算法 ...
- 【原】Coursera—Andrew Ng机器学习—课程笔记 Lecture 14—Dimensionality Reduction 降维
Lecture 14 Dimensionality Reduction 降维 14.1 降维的动机一:数据压缩 Data Compression 现在讨论第二种无监督学习问题:降维. 降维的一个作用是 ...
- 【原】Coursera—Andrew Ng机器学习—课程笔记 Lecture 12—Support Vector Machines 支持向量机
Lecture 12 支持向量机 Support Vector Machines 12.1 优化目标 Optimization Objective 支持向量机(Support Vector Machi ...
- 【原】Coursera—Andrew Ng机器学习—课程笔记 Lecture 1_Introduction and Basic Concepts 介绍和基本概念
目录 1.1 欢迎1.2 机器学习是什么 1.2.1 机器学习定义 1.2.2 机器学习算法 - Supervised learning 监督学习 - Unsupervised learning 无 ...
- 【原】Coursera—Andrew Ng机器学习—课程笔记 Lecture 17—Large Scale Machine Learning 大规模机器学习
Lecture17 Large Scale Machine Learning大规模机器学习 17.1 大型数据集的学习 Learning With Large Datasets 如果有一个低方差的模型 ...
- 【原】Coursera—Andrew Ng机器学习—课程笔记 Lecture 16—Recommender Systems 推荐系统
Lecture 16 Recommender Systems 推荐系统 16.1 问题形式化 Problem Formulation 在机器学习领域,对于一些问题存在一些算法, 能试图自动地替你学习到 ...
随机推荐
- Mutual Training for Wannafly Union #5
A(UVA12336) 题意:给一个n*m(n,m<=1e5)的棋盘,棋盘上有一些障碍点不能放棋子,现在要在棋盘上放4个棋子,满足A->B->C->D->A,其中走的规则 ...
- [bzoj 1047][HAOI2007]理想正方形(单调队列)
题目:http://www.lydsy.com/JudgeOnline/problem.php?id=1047 分析: 第一感觉二维线段树当然没问题但是挺慢的. 注意到要求的正方形形中的最大最小边长是 ...
- MYSQL的一些常用函数
#数学函数 SELECT ABS(-8);#绝对值SELECT CEILING(9.8);#查询大于等于给定数值的最小整数SELECT FLOOR(9.8);#查询小于等于给定数值的最大整数SELEC ...
- [转][MEF插件式开发] 一个简单的例子
偶然在博客园中了解到这种技术,顺便学习了几天. 以下是搜索到一些比较好的博文供参考: MEF核心笔记 <MEF程序设计指南>博文汇总 先上效果图 一.新建解决方案 开始新建一个解决方案Me ...
- SQL 为SQL Server服务指定的凭据无效怎么办
如下所示,在安装SQL Server2008的时候,我随便输入了了账户名和密码,点击下一步没用 正确做法是:点击账户名右边的小三角,从下拉列表随便选一个("对所有SQL Server服务 ...
- swift 2.0 语法 分支
import UIKit // 注意: Swift中可以不写;号, 但是有一定的前提条件, 一行只有一句代码 // 如果一行有多句代码, 那么;还是必须写 // 注意: Swift变态的地方 ...
- Python基础--webbrowser
非常多人,一提到Python,想到的就是爬虫.我会一步一步的教你怎样爬出某个站点. 今天就先介绍一下webbrowser,这个词您肯定不会陌生.对,就是浏览器. 看看Python中对webbrowse ...
- Ubuntu13.10添加/删除PPA
什么是ppa ppa即Personal Package Archive(个人安装包文档),简单来说就是一些个人或者团体通过独立的网站发布的第三方的软件源.将这些软件源添加到你的电脑上后,你就可以像使用 ...
- HDFS03
=====================HDFS数据块(block)===================== 文件被切分成固定大小的数据块 -------------> √默认数据块大小为6 ...
- ios-UI1
// AppDelegate.h // 01-HelloWorld的实现 // /* 新建工程的时候,Use Core Data:比如本地缓存, Include Unit test:增加单元测试 In ...