ArcGIS实现打点、线路图、色块、自定义弹窗
闲聊:
马上就要过年了,不知道大家过年都放几天假,小颖公司就只放8天假,就这还有一天是集体调休扣年假,就很··············还不如不放,不过庆幸最近这两周项目也做完了也没啥事,不然就静不下心写代码,就想放假回家干饭,趁着最近没事小颖把上个项目用ArcGIS实现的瓦片地图和一些功能总结了下,下面就先看看效果吧
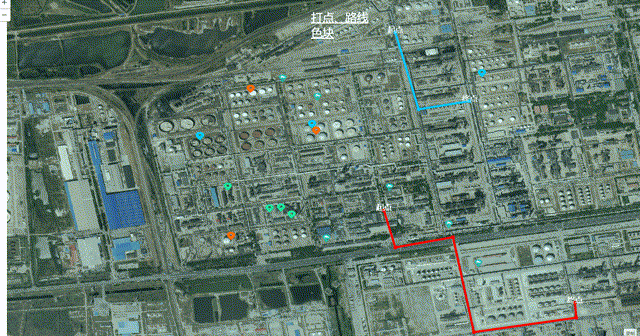
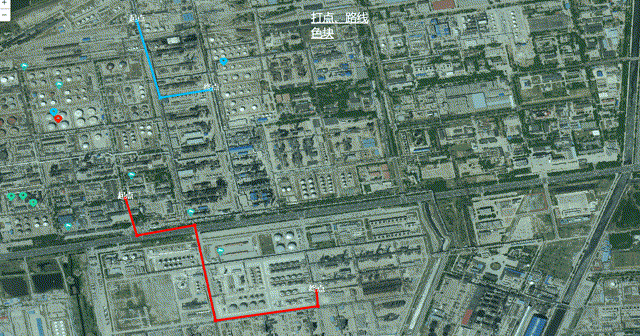
效果图:
具体代码:
小颖是先拿vue脚手架初始化了一个简单的项目,所以基础的那些我就不写了,其他的贴出来
首先导入所需node包:esri-loader、terraformer-wkt-parser、terraformer-arcgis-parser
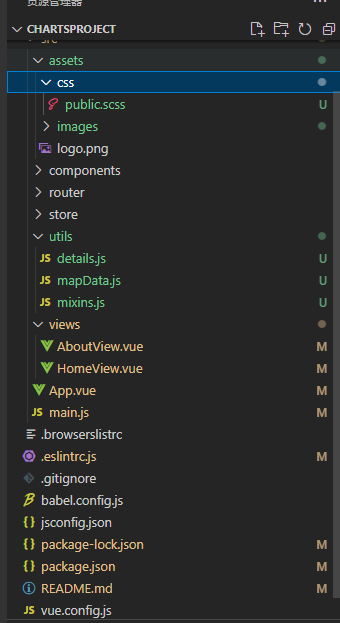
目录:
公用css:


* {

    font-family: Microsoft YaHei;

    padding: 0;

    margin: 0;

}

html,

body,

#app,

#mapBox {

    width: 100%;

    height: 100%;

}

nav {

    position: absolute;

    z-index: 9;

    left: 45%;

    top: 6%;

}

// 弹窗样式

.markerstyle {

    background: rgba(0, 30, 67, 0.8);

    border: 1px solid #1c3e8c;

    box-shadow: 0px 3px 6px 0px rgba(0, 0, 0, 0.56);

    color: white;

    font-size: 12px;

    padding-bottom: 11px;

    .marker-f {

        display: flex;

        align-items: center;

        justify-content: space-between;

        height: 32px;

        line-height: 32px;

        padding: 0 10px;

        background: #12376d;

        border: 1px solid #1c3e8c;

        .marker-t {

            font-size: 16px;

        }

    }

    .marker-c {

        width: 20px;

        height: 20px;

        background: rgba(11, 50, 79, 0.3);

        border: 1px solid #0659B6;

        color: white;

        line-height: 20px;

        text-align: center;

        color: #2987F1;

    }

    .marker-nr {

        padding: 12px 10px 10px 16px;

        color: red;

    }

    .marker-list,

    .marker-nr-f {

        padding-left: 16px;

    }

    .marker-nr-f .marker-list {

        padding: 0;

    }

    .marker-list span {

        color: #b0c9df;

    }

}

.bulletFrame {

    width: 266px;

    height: 274px;

    background: rgba(58, 2, 3, 0.8);

    border: 1px solid #b61b1b;

}

.frame_top {

    height: 48px;

    display: flex;

}

.frame_top span {

    display: inline-block;

    width: 150px;

    padding-top: 8px;

    font-size: 16px;

    font-family: Adobe Heiti Std;

    font-weight: normal;

    color: #f24f54;

}

.leftImg {

    margin: 5px 15px 0 19px;

    width: 26px;

    height: 23px;

}

.rightImg {

    margin-top: 8px;

    margin-left: 20px;

    width: 20px;

    height: 20px;

    cursor: pointer;

}

.frame_middle {

    margin-left: 16px;

}

.frame_middle p:nth-child(1) {

    width: 100%;

    padding-bottom: 6px;

}

.frame_middle p:nth-child(2) {

    float: left;

}

.frame_middle p:nth-child(3) {

    margin-left: 10%;

    float: left;

}

.frame_middle p:nth-child(4) {

    clear: both;

}

.frame_middle p,

.uls li,

.frame_foot p {

    color: #f0f0f0;

    font-size: 13px;

    font-family: Microsoft YaHei;

}

.responsibility {

    margin-left: 30px;

}

.uls {

    width: 240px;

    height: 73px;

    margin: 0;

    padding: 0;

    display: flex;

    flex-wrap: wrap;

    margin-left: 14px;

    margin-top: 10px;

    border-top: 1px solid #5c2522;

    border-bottom: 1px solid #5c2522;

}

.uls li {

    list-style: none;

    width: 110px;

    margin-left: 5px;

}

.uls li:nth-child(1) {

    margin-top: 5px;

}

.uls li:nth-child(2) {

    margin-top: 5px;

}

.uls li:nth-child(2n) {

    margin-left: 10px;

}

.uls li:nth-child(1) span {

    color: #2addc4;

}

.uls li:nth-child(2) span {

    color: #ffad3c;

}

.uls li:nth-child(3) span {

    color: #ffad3c;

}

.uls li:nth-child(4) span {

    color: #037df9;

}

.uls li:nth-child(5) span {

    color: #037df9;

}

.frame_foot {

    width: 100%;

    height: 100px;

}

.configureP {

    margin-left: 14px;

    line-height: 35px;

}

.footDiv {

    width: 239px;

    height: 60px;

    background: #37100e;

    border: 1px solid #4b1212;

    margin-left: 14px;

}

// 地图弹框按钮

.esriPopup .contentPane {

    background-color: transparent !important;

    padding: 0 !important;

}

.esriPopup .actionsPane .zoomTo,

.esriPopup .titleButton.close,

.esriPopup .actionsPane,

.esriPopup .titleButton.maximize {

    display: none;

}

.esriPopup .pointer,

.esriPopup .outerPointer {

    background-color: #3a0203cc !important;

}
public.scss
图片大家可以就自已根据项目给合适的,小颖就不贴了
utils文件下公用js
let dialogData = [

    // 装置点

    {

        id: 0,

        title: 'XXX重大危险源1',

        contentTips: [

            { tipP: '分险内容:', tipContent: "" },

            { tipP: "履职完成情况", tipContent: "XXX" },

            { tipP: '责任人', tipContent: "XXX" }

        ],

        hiddenDanger: [

            { tipLi: '隐患排查次数:', numSpan: "12" },

            { tipLi: '发现隐患数量:', numSpan: "6" },

            { tipLi: '治理完成隐患:', numSpan: "4" },

            { tipLi: '未整改隐患:', numSpan: "2" },

            { tipLi: '超期隐患:', numSpan: "1" },

        ],

        configuration: {

            header: '安全系统配置情况:'

        },

        dataPoint: {

            x: 117.3924468963087,

            Y: 38.829585795516564,

            icon: require("@/assets/images/mapicon3.png"),

        }

    },

    {

        id: 1,

        title: 'XXX重大危险源2',

        contentTips: [

            { tipP: '分险内容:', tipContent: "" },

            { tipP: "履职完成情况", tipContent: "XXX" },

            { tipP: '责任人', tipContent: "XXX" }

        ],

        hiddenDanger: [

            { tipLi: '隐患排查次数:', numSpan: "12" },

            { tipLi: '发现隐患数量:', numSpan: "6" },

            { tipLi: '治理完成隐患:', numSpan: "4" },

            { tipLi: '未整改隐患:', numSpan: "2" },

            { tipLi: '超期隐患:', numSpan: "1" },

        ],

        configuration: {

            header: '安全系统配置情况:'

        },

        dataPoint: {

            x: 117.3924468963087,

            Y: 38.829585795516564,

            icon: require("@/assets/images/mapicon3.png"),

        }

    },

    {

        id: 2,

        title: 'XXX重大危险源3',

        contentTips: [

            { tipP: '分险内容:', tipContent: "" },

            { tipP: "履职完成情况", tipContent: "XXX" },

            { tipP: '责任人', tipContent: "XXX" }

        ],

        hiddenDanger: [

            { tipLi: '隐患排查次数:', numSpan: "12" },

            { tipLi: '发现隐患数量:', numSpan: "6" },

            { tipLi: '治理完成隐患:', numSpan: "4" },

            { tipLi: '未整改隐患:', numSpan: "2" },

            { tipLi: '超期隐患:', numSpan: "1" },

        ],

        configuration: {

            header: '安全系统配置情况:'

        },

        dataPoint: {

            x: 117.39832093416086,

            Y: 38.83022416127399,

            icon: require("@/assets/images/mapicon3.png"),

        }

    },

    {

        id: 3,

        title: 'XXX重大危险源4',

        contentTips: [

            { tipP: '分险内容:', tipContent: "" },

            { tipP: "履职完成情况", tipContent: "XXX" },

            { tipP: '责任人', tipContent: "XXX" }

        ],

        hiddenDanger: [

            { tipLi: '隐患排查次数:', numSpan: "12" },

            { tipLi: '发现隐患数量:', numSpan: "6" },

            { tipLi: '治理完成隐患:', numSpan: "4" },

            { tipLi: '未整改隐患:', numSpan: "2" },

            { tipLi: '超期隐患:', numSpan: "1" },

        ],

        configuration: {

            header: '安全系统配置情况:'

        },

        dataPoint: {

            x: 117.40723123267456,

            Y: 38.8328795482483,

            icon: require("@/assets/images/mapicon3.png"),

        }

    },

    // 储罐

    {

        id: 4,

        title: 'XXX重大危险源5',

        contentTips: [

            { tipP: '分险内容:', tipContent: "" },

            { tipP: "履职完成情况", tipContent: "XXX" },

            { tipP: '责任人', tipContent: "XXX" }

        ],

        hiddenDanger: [

            { tipLi: '隐患排查次数:', numSpan: "12" },

            { tipLi: '发现隐患数量:', numSpan: "6" },

            { tipLi: '治理完成隐患:', numSpan: "4" },

            { tipLi: '未整改隐患:', numSpan: "2" },

            { tipLi: '超期隐患:', numSpan: "1" },

        ],

        configuration: {

            header: '安全系统配置情况:'

        },

        dataPoint: {

            x: 117.3951076477011,

            Y: 38.83206415669256,

            icon: require("@/assets/images/mapicon1.png"),

        }

    },

    {

        id: 5,

        title: 'XXX重大危险源6',

        contentTips: [

            { tipP: '分险内容:', tipContent: "" },

            { tipP: "履职完成情况", tipContent: "XXX" },

            { tipP: '责任人', tipContent: "XXX" }

        ],

        hiddenDanger: [

            { tipLi: '隐患排查次数:', numSpan: "12" },

            { tipLi: '发现隐患数量:', numSpan: "6" },

            { tipLi: '治理完成隐患:', numSpan: "4" },

            { tipLi: '未整改隐患:', numSpan: "2" },

            { tipLi: '超期隐患:', numSpan: "1" },

        ],

        configuration: {

            header: '安全系统配置情况:'

        },

        dataPoint: {

            x: 117.39855160414047,

            Y: 38.82987547409558,

            icon: require("@/assets/images/mapicon1.png"),

        }

    },

    {

        id: 6,

        title: 'XXX重大危险源7',

        contentTips: [

            { tipP: '分险内容:', tipContent: "" },

            { tipP: "履职完成情况", tipContent: "XXX" },

            { tipP: '责任人', tipContent: "XXX" }

        ],

        hiddenDanger: [

            { tipLi: '隐患排查次数:', numSpan: "12" },

            { tipLi: '发现隐患数量:', numSpan: "6" },

            { tipLi: '治理完成隐患:', numSpan: "4" },

            { tipLi: '未整改隐患:', numSpan: "2" },

            { tipLi: '超期隐患:', numSpan: "1" },

        ],

        configuration: {

            header: '安全系统配置情况:'

        },

        dataPoint: {

            x: 117.39407767942018,

            Y: 38.82438230993061,

            icon: require("@/assets/images/mapicon1.png"),

        }

    },

    // 气体监测点

    {

        id: 7,

        title: 'XXX重大危险源8',

        contentTips: [

            { tipP: '分险内容:', tipContent: "" },

            { tipP: "履职完成情况", tipContent: "XXX" },

            { tipP: '责任人', tipContent: "XXX" }

        ],

        hiddenDanger: [

            { tipLi: '隐患排查次数:', numSpan: "12" },

            { tipLi: '发现隐患数量:', numSpan: "6" },

            { tipLi: '治理完成隐患:', numSpan: "4" },

            { tipLi: '未整改隐患:', numSpan: "2" },

            { tipLi: '超期隐患:', numSpan: "1" },

        ],

        configuration: {

            header: '安全系统配置情况:'

        },

        dataPoint: {

            x: 117.39391674687629,

            Y: 38.826946501796684,

            icon: require("@/assets/images/mapicon2.png"),

        }

    },

    {

        id: 8,

        title: 'XXX重大危险源9',

        contentTips: [

            { tipP: '分险内容:', tipContent: "" },

            { tipP: "履职完成情况", tipContent: "XXX" },

            { tipP: '责任人', tipContent: "XXX" }

        ],

        hiddenDanger: [

            { tipLi: '隐患排查次数:', numSpan: "12" },

            { tipLi: '发现隐患数量:', numSpan: "6" },

            { tipLi: '治理完成隐患:', numSpan: "4" },

            { tipLi: '未整改隐患:', numSpan: "2" },

            { tipLi: '超期隐患:', numSpan: "1" },

        ],

        configuration: {

            header: '安全系统配置情况:'

        },

        dataPoint: {

            x: 117.39608933621888,

            Y: 38.825817291780375,

            icon: require("@/assets/images/mapicon2.png"),

        }

    },

    {

        id: 9,

        title: 'XXX重大危险源10',

        contentTips: [

            { tipP: '分险内容:', tipContent: "" },

            { tipP: "履职完成情况", tipContent: "XXX" },

            { tipP: '责任人', tipContent: "XXX" }

        ],

        hiddenDanger: [

            { tipLi: '隐患排查次数:', numSpan: "12" },

            { tipLi: '发现隐患数量:', numSpan: "6" },

            { tipLi: '治理完成隐患:', numSpan: "4" },

            { tipLi: '未整改隐患:', numSpan: "2" },

            { tipLi: '超期隐患:', numSpan: "1" },

        ],

        configuration: {

            header: '安全系统配置情况:'

        },

        dataPoint: {

            x: 117.39670356209474,

            Y: 38.82584947828915,

            icon: require("@/assets/images/mapicon2.png"),

        }

    },

    {

        id: 10,

        title: 'XXX重大危险源11',

        contentTips: [

            { tipP: '分险内容:', tipContent: "" },

            { tipP: "履职完成情况", tipContent: "XXX" },

            { tipP: '责任人', tipContent: "XXX" }

        ],

        hiddenDanger: [

            { tipLi: '隐患排查次数:', numSpan: "12" },

            { tipLi: '发现隐患数量:', numSpan: "6" },

            { tipLi: '治理完成隐患:', numSpan: "4" },

            { tipLi: '未整改隐患:', numSpan: "2" },

            { tipLi: '超期隐患:', numSpan: "1" },

        ],

        configuration: {

            header: '安全系统配置情况:'

        },

        dataPoint: {

            x: 117.39725609716213,

            Y: 38.82548469785632,

            icon: require("@/assets/images/mapicon2.png"),

        }

    },

    // 监控点

    {

        id: 11,

        title: 'XXX重大危险源12',

        contentTips: [

            { tipP: '分险内容:', tipContent: "" },

            { tipP: "履职完成情况", tipContent: "XXX" },

            { tipP: '责任人', tipContent: "XXX" }

        ],

        hiddenDanger: [

            { tipLi: '隐患排查次数:', numSpan: "12" },

            { tipLi: '发现隐患数量:', numSpan: "6" },

            { tipLi: '治理完成隐患:', numSpan: "4" },

            { tipLi: '未整改隐患:', numSpan: "2" },

            { tipLi: '超期隐患:', numSpan: "1" },

        ],

        configuration: {

            header: '安全系统配置情况:'

        },

        dataPoint: {

            x: 117.39678268726217,

            Y: 38.83260328071463,

            icon: require("@/assets/images/mapjiankong.png"),

        }

    },

    {

        id: 12,

        title: 'XXX重大危险源13',

        contentTips: [

            { tipP: '分险内容:', tipContent: "" },

            { tipP: "履职完成情况", tipContent: "XXX" },

            { tipP: '责任人', tipContent: "XXX" }

        ],

        hiddenDanger: [

            { tipLi: '隐患排查次数:', numSpan: "12" },

            { tipLi: '发现隐患数量:', numSpan: "6" },

            { tipLi: '治理完成隐患:', numSpan: "4" },

            { tipLi: '未整改隐患:', numSpan: "2" },

            { tipLi: '超期隐患:', numSpan: "1" },

        ],

        configuration: {

            header: '安全系统配置情况:'

        },

        dataPoint: {

            x: 117.3986092716354,

            Y: 38.83162427440592,

            icon: require("@/assets/images/mapjiankong.png"),

        }

    },

    {

        id: 13,

        title: 'XXX重大危险源14',

        contentTips: [

            { tipP: '分险内容:', tipContent: "" },

            { tipP: "履职完成情况", tipContent: "XXX" },

            { tipP: '责任人', tipContent: "XXX" }

        ],

        hiddenDanger: [

            { tipLi: '隐患排查次数:', numSpan: "12" },

            { tipLi: '发现隐患数量:', numSpan: "6" },

            { tipLi: '治理完成隐患:', numSpan: "4" },

            { tipLi: '未整改隐患:', numSpan: "2" },

            { tipLi: '超期隐患:', numSpan: "1" },

        ],

        configuration: {

            header: '安全系统配置情况:'

        },

        dataPoint: {

            x: 117.40239386862599,

            Y: 38.826906268660714,

            icon: require("@/assets/images/mapjiankong.png"),

        }

    },

    {

        id: 14,

        title: 'XXX重大危险源15',

        contentTips: [

            { tipP: '分险内容:', tipContent: "" },

            { tipP: "履职完成情况", tipContent: "XXX" },

            { tipP: '责任人', tipContent: "XXX" }

        ],

        hiddenDanger: [

            { tipLi: '隐患排查次数:', numSpan: "12" },

            { tipLi: '发现隐患数量:', numSpan: "6" },

            { tipLi: '治理完成隐患:', numSpan: "4" },

            { tipLi: '未整改隐患:', numSpan: "2" },

            { tipLi: '超期隐患:', numSpan: "1" },

        ],

        configuration: {

            header: '安全系统配置情况:'

        },

        dataPoint: {

            x: 117.40550523114129,

            Y: 38.82498580697022,

            icon: require("@/assets/images/mapjiankong.png"),

        }

    },

    {

        id: 15,

        title: 'XXX重大危险源16',

        contentTips: [

            { tipP: '分险内容:', tipContent: "" },

            { tipP: "履职完成情况", tipContent: "XXX" },

            { tipP: '责任人', tipContent: "XXX" }

        ],

        hiddenDanger: [

            { tipLi: '隐患排查次数:', numSpan: "12" },

            { tipLi: '发现隐患数量:', numSpan: "6" },

            { tipLi: '治理完成隐患:', numSpan: "4" },

            { tipLi: '未整改隐患:', numSpan: "2" },

            { tipLi: '超期隐患:', numSpan: "1" },

        ],

        configuration: {

            header: '安全系统配置情况:'

        },

        dataPoint: {

            x: 117.40705018356269,

            Y: 38.82294732808087,

            icon: require("@/assets/images/mapjiankong.png"),

        }

    },

    {

        id: 16,

        title: 'XXX重大危险源17',

        contentTips: [

            { tipP: '分险内容:', tipContent: "" },

            { tipP: "履职完成情况", tipContent: "XXX" },

            { tipP: '责任人', tipContent: "XXX" }

        ],

        hiddenDanger: [

            { tipLi: '隐患排查次数:', numSpan: "12" },

            { tipLi: '发现隐患数量:', numSpan: "6" },

            { tipLi: '治理完成隐患:', numSpan: "4" },

            { tipLi: '未整改隐患:', numSpan: "2" },

            { tipLi: '超期隐患:', numSpan: "1" },

        ],

        configuration: {

            header: '安全系统配置情况:'

        },

        dataPoint: {

            x: 117.39907195269903,

            Y: 38.82425356389547,

            icon: require("@/assets/images/mapjiankong.png"),

        }

    },

]

export { dialogData}
details.js
打点和其弹窗信息
let mapjw = [

    {

        title: '炼油部',

        status: 1,

        center: [117.396687, 38.828285],

        lnglat: '117.409724 38.839610,117.409832 38.838206,117.403791 38.837422,117.402640 38.836384,117.403145 38.834053,117.406237 38.834528,117.408287 38.824639,117.395956 38.822963,117.391105 38.822688,117.388949 38.831736,117.393009 38.833417,117.396530 38.835266,117.402425 38.837648,117.405229 38.838770,117.405589 38.838938,117.405589 38.838938,117.409724 38.839610'

    },

    {

        title: '水务部',

        status: 10,

        center: [117.408586, 38.836618],

        lnglat: '117.406236 38.835286,117.406344 38.834640,117.403180 38.834193,117.402784 38.836300,117.403863 38.837310,117.414113 38.838654,117.418826 38.839552,117.419402 38.836968,117.406236 38.835286'

    },

    {

        title: '化工部',

        status: 30,

        center: [117.411283, 38.828865],

        lnglat: '117.414653 38.836210,117.415516 38.832558,117.422353 38.833401,117.423001 38.830479,117.416200 38.829440,117.417028 38.825676,117.408466 38.824611,117.406380 38.835146,117.414653 38.836210'

    },

    {

        title: '水务部',

        status: 12,

        lukong: 1,

        center: [117.411355, 38.830325],

        lnglat: '117.412639 38.830115,117.410481 38.829695,117.410192 38.830706,117.412459 38.831014,117.412639 38.830115'

    },

    {

        title: '聚醚部',

        status: 40,

        center: [117.41855551934665, 38.834108],

        lnglat: '117.415228 38.834862,117.421706 38.835928,117.422281 38.833541,117.415660 38.832727,117.415228 38.834862'

    },

    {

        title: '热电部',

        status: 20,

        center: [117.420351, 38.818385],

        lnglat: '117.426674 38.823907,117.419079 38.822810,117.414151 38.810308,117.419620 38.808621,117.426674 38.823907'

    },

    {

        title: '烯烃部',

        status: 8,

        center: [117.431836, 38.816701],

        lnglat: '117.427322 38.821800,117.424478 38.815871,117.424587 38.813511,117.423974 38.813426,117.424119 38.809465,117.437011 38.809639,117.435748 38.822169,117.427322 38.821800'

    }

]

export { mapjw}
mapData.js
色块信息
/* eslint-disable */

import * as esriLoader from "esri-loader";

import WKT from "terraformer-wkt-parser";

import ARCGIS from "terraformer-arcgis-parser";

// 统一绘制区域

export const drawMapClass = {

  data() {

    return {

      gisJs: "http://xxxx/arcgis/init.js",

      esriCssPath:

        "http://xxxx/arcgis/esri/css/esri.css",

      cssPath:

        "http://xxxx/arcgis/dijit/themes/tundra/tundra.css",

      baseMapUrl: "http://xxxx/map/_AllLayers/",

      deviceIcon: require("../assets/images/maphongqi.png"),

      showBussLayer: null,

    }

  },

  methods: {

    // 设置中心点 参数:经度 纬度 级别

    zoomMapToPoint(lng, lat, lod) {

      let _this = this;

      esriLoader

        .loadModules(["esri/geometry/Point", "esri/SpatialReference"])

        .then(([Point, SpatialReference]) => {

          var x = parseFloat(lng);

          var y = parseFloat(lat);

          var z = parseFloat(lod);

          var mapCenter = new Point(

            [x, y],

            new SpatialReference({ wkid: 4490 })

          );

          _this.myMap.map.centerAndZoom(mapCenter, z);

        });

    },

    // 画图层

    addGraphicsLayer(LayerId) {

      esriLoader

        .loadModules(["esri/layers/GraphicsLayer"])

        .then(([GraphicsLayer]) => {

          this.showBussLayer = new GraphicsLayer({ id: LayerId });

          this.myMap.map.addLayer(this.showBussLayer);

          this.showBussLayer.on("mouse-down", (e) => {

            this.glayerMouseDown(e);

          });

        });

    },

    glayerMouseDown(e) {

      console.log(e);

    },

    // 画点

    addPointToMapUsePic(data) {

      esriLoader

        .loadModules(["esri/graphic", "esri/geometry/Point"])

        .then(([Graphic, Point]) => {

          var graphPolygon = new Graphic();

          //定义一些属性

          var attributes = {

            mapData: data,

          };

          graphPolygon.attributes = attributes;

          var pnt = new Point(

            parseFloat(data.dataPoint.x),

            parseFloat(data.dataPoint.Y),

            new esri.SpatialReference({ wkid: 4490 })

          );

          graphPolygon.geometry = pnt;

          graphPolygon.symbol = this.getMarkPicSymbol(data.dataPoint.icon);

          this.showBussLayer.add(graphPolygon);

        });

    },

    getMarkPicSymbol(icon) {

      var pictureMarkerSymbol = new esri.symbol.PictureMarkerSymbol(

        icon,

        20,

        20

      ); //'icon/red.png'

      pictureMarkerSymbol.xoffset = 12;

      pictureMarkerSymbol.yoffset = 12;

      return pictureMarkerSymbol;

    },

    // 画线

    addLineToMap(jsondata, LayerId, colors, textData) {

      esriLoader

        .loadModules([

          "esri/layers/GraphicsLayer",

          "esri/geometry/Point",

          "esri/SpatialReference",

          "esri/graphic",

          "esri/Color",

          "esri/symbols/TextSymbol",

          "esri/symbols/Font",

        ])

        .then(([GraphicsLayer, Point, SpatialReference, Graphic, Color, TextSymbol, Font]) => {

          var poiLineColor = colors; //渲染面边框填充颜色  rgb值 1是透明度,0透明 1不透明

          var poiLineWidth = 5; //渲染面边框宽度,一般为2,设大点可以看效果。

          var pointColor = colors;

          var jsonData = JSON.parse(jsondata);

          if (jsonData == null) return;

          var markSymbole = this.getPointSymbolByColorExSquare(

            8,

            new Color(pointColor)

          );

          var showPointLayer = null;

          var graphicLayerIds = this.myMap.map.graphicsLayerIds;

          var len = graphicLayerIds.length;

          for (var i = 0; i < len; i++) {

            if (graphicLayerIds[i] == LayerId) {

              showPointLayer = this.myMap.map.getLayer(graphicLayerIds[i]);

              showPointLayer.clear();

              break;

            }

          }

          if (showPointLayer == null) {

            showPointLayer = new GraphicsLayer({ id: LayerId });

          }

          //加点

          for (let k = 0; k < jsonData.length; k++) {

            var lng = jsonData[k].lng;

            var lat = jsonData[k].lat;

            var pnt = new Point(

              parseFloat(lng),

              parseFloat(lat),

              new SpatialReference({ wkid: 4490 })

            );

            var grahight = new Graphic();

            grahight.geometry = pnt;

            grahight.symbol = markSymbole;

            grahight.attributes = jsonData[k];

            showPointLayer.add(grahight);

          }

          //加线

          for (let k = 1; k < jsonData.length; k++) {

            var lng_s = jsonData[k - 1].lng;

            var lat_s = jsonData[k - 1].lat;

            var pnt_s = new Point(

              parseFloat(lng_s),

              parseFloat(lat_s),

              new SpatialReference({ wkid: 4490 })

            );

            var lng_e = jsonData[k].lng;

            var lat_e = jsonData[k].lat;

            var pnt_e = new Point(

              parseFloat(lng_e),

              parseFloat(lat_e),

              new SpatialReference({ wkid: 4490 })

            );

            var grahight_line = new Graphic();

            grahight_line.geometry = this.getLineGeometry(pnt_s, pnt_e);

            grahight_line.symbol = this.getLineSymbol(

              new Color(poiLineColor),

              poiLineWidth,

              ""

            );

            var attr = {

              名称: "线段1",

            };

            grahight_line.attributes = attr;

            showPointLayer.add(grahight_line);

            if (textData && textData.length > 0) {

              textData.forEach((element, index) => {

                // 起点、终点

                let point = new Point([element.lng, element.lat]);

                let textSym = new TextSymbol(index == 0 ? '起点' : '终点');

                let font = new Font();

                font.setSize("14pt");

                textSym.setFont(font);

                textSym.setColor(new Color([255, 255, 255, 0.8]));

                let labelPointGraphic = new Graphic(point, textSym);

                showPointLayer.add(labelPointGraphic);

              });

            }

          }

          this.myMap.map.addLayer(showPointLayer);

        });

    },

    getPointSymbolByColorExSquare(size, color) {

      var symbol = new esri.symbol.SimpleMarkerSymbol();

      symbol.setSize(size);

      symbol.setColor(color);

      var sls = new esri.symbol.SimpleLineSymbol();

      sls.style = esri.symbol.SimpleLineSymbol.STYLE_SOLID;

      sls.setColor(color);

      sls.width = 0;

      symbol.outline = sls;

      //symbol.style = "STYLE_SQUARE";

      symbol.style = esri.symbol.SimpleMarkerSymbol.STYLE_SQUARE;

      symbol.xoffset = 0;

      symbol.yoffset = 0;

      return symbol;

    },

    getLineGeometry(startpnt, endpnt) {

      var lines = new Array();

      lines.push([Number(startpnt.x), Number(startpnt.y)]);

      lines.push([Number(endpnt.x), Number(endpnt.y)]);

      var lineJson = {

        paths: [lines],

        spatialReference: { wkid: 4490 },

      };

      var polyline = new esri.geometry.Polyline(lineJson);

      return polyline;

    },

    getLineSymbol(LineRgb, width, stype) {

      var sls = new esri.symbol.SimpleLineSymbol();

      if (stype.length > 0)

        sls.style = esri.symbol.SimpleLineSymbol.STYLE_DASHDOT;

      else sls.style = esri.symbol.SimpleLineSymbol.STYLE_SOLID;

      //STYLE_DASH:"dash" // 常规虚线

      //STYLE_DASHDOT:"dashdot" // 常规虚、点线

      //STYLE_DASHDOTDOT:"longdashdotdot" // 常规虚、点、点线

      //STYLE_DOT:"dot" // 常规点线

      //STYLE_LONGDASH:"longdash" // 长虚线

      //STYLE_LONGDASHDOT:"longdashdot" // 长虚、点线

      //STYLE_NULL:"none"

      //STYLE_SHORTDASH:"shortdash" // 短虚线

      //STYLE_SHORTDASHDOT:"shortdashdot" // 短虚、点线

      //STYLE_SHORTDASHDOTDOT:"shortdashdotdot" // 短虚、点、点线

      //STYLE_SHORTDOT:"shortdot" // 短点线

      //STYLE_SOLID:"solid" // 线条

      sls.setColor(LineRgb);

      sls.width = width;

      return sls;

    },

    // 画色块

    addRegionToMapByWkt(FillColor, LineColor, data) {

      esriLoader

        .loadModules([

          "esri/symbols/TextSymbol",

          "esri/geometry/jsonUtils",

          "esri/graphic",

          "esri/geometry/Point",

          "esri/symbols/Font",

          "esri/Color",

        ])

        .then(([TextSymbol, jsonUtils, Graphic, Point, Font, Color]) => {

          //根据名称从数据库获取到坐标集

          var poiFillColor = FillColor; //渲染面填充颜色  rgb值 0.8是透明度,0透明 1不透明

          var poiLineColor = LineColor; //渲染面边框填充颜色  rgb值 1是透明度,0透明 1不透明

          var poiLineWidth = 3; //渲染面边框宽度,一般为2,设大点可以看效果。

          var wkt = `POLYGON((${data.lnglat}))`;

          //定义一个面对象

          var graphPolygon = new Graphic();

          //定义一些属性

          var attributes = {

            炼油部: "炼油部",

          };

          graphPolygon.attributes = attributes;

          var arcgisJson = this.wktToGeometry(wkt);

          graphPolygon.geometry = jsonUtils.fromJson(arcgisJson);

          graphPolygon.symbol = this.getFillSymbol(

            poiFillColor,

            poiLineColor,

            poiLineWidth

          );

          if (data.title) {

            // 中心点

            var point = new Point(data.center);

            var textSym = new TextSymbol(data.title);

            var font = new Font();

            font.setSize("16pt");

            font.setWeight(Font.WEIGHT_BOLD);

            textSym.setFont(font);

            textSym.setColor(new Color([255, 255, 255, 0.8]));

            var labelPointGraphic = new Graphic(point, textSym);

            this.showBussLayer.add(labelPointGraphic);

          }

          // this.myMap.map.addLayer(_this.showBussLayer);

          // x: 117.39776303467535, y: 38.82816422471212

          //map.centerAndZoom(geo.getCentroid(), 10);  定位到中心点和比例尺

          this.showBussLayer.add(graphPolygon);

        });

    },

    wktToGeometry(wktdata) {

      //原始wkt数据格式化

      var primitiveGeoData = WKT.parse(wktdata);

      //wkt格式转arcgis的json格式

      var arcgisJson = ARCGIS.convert(primitiveGeoData);

      arcgisJson.spatialReference = new esri.SpatialReference({ wkid: 4490 });

      //json数据转geometry

      //var geometry = jsonUtils.fromJson(arcgisJson)

      return arcgisJson;

    },

    getFillSymbol(fillRgb, LineRgb, width) {

      let sfs = new esri.symbol.SimpleFillSymbol();

      sfs.style = esri.symbol.SimpleFillSymbol.STYLE_SOLID;

      sfs.setColor(fillRgb);

      sfs.outline = this.getLineSymbol(LineRgb, width, "");

      return sfs;

    },

    // 清除绘制的区域

    clearMap(LayerId) {

      const layer = this.myMap.map.getLayer(LayerId);

      layer && layer.clear();

      layer && this.myMap.map.removeLayer(layer);

    },

  },

}
mixins.js
封装的打点、画线、画色块的公共方法
因为地图是每个页面都要的,所以小颖把初始化地图写到了app.vue里,每次切换路由的时候也是只让各自模块清理各自创建的图层
<template>

  <div id="app">

    <nav>

      <router-link to="/">打点、路线</router-link><br/>

      <router-link to="/about">色块</router-link>

    </nav>

    <div class="main_box tundra gismap" id="mapBox"></div>

    <router-view />

  </div>

</template>

<script>

import { drawMapClass } from "./utils/mixins";

// 地图所需

/* eslint-disable */

import * as esriLoader from "esri-loader";

export default {

  name: "HomeView",

  mixins: [drawMapClass],

  beforeRouteUpdate(to, from, next) {

    this.zoomMapToPoint(117.41895248628826, 38.82732737548387, 16);

    this.myMap.map.infoWindow.hide();

    next();

  },

  data() {

    return {};

  },

  mounted() {

    this.initMap(

      "mapBox",

      this.esriCssPath,

      this.cssPath,

      this.gisJs,

      this.baseMapUrl

    );

  },

  methods: {

    initMap(mapDom, esriCssPath, cssPath, gisJs, baseMapUrl, lods) {

      let _this = this;

      esriLoader.loadCss(esriCssPath);

      esriLoader.loadCss(cssPath);

      const options = {

        url: gisJs,

      };

      esriLoader

        .loadModules(["esri/map", "js/customTiledLyr_sh"], options)

        .then(([Map, customTiledLyr_sh]) => {

          if (_this.myMap.map != null) {

            _this.myMap.map.destory();

          }

          _this.myMap.map = new Map(mapDom, {

            logo: false,

            sliderStyle: "small",

            smartNavigation: false,

            showPanArrows: true,

            nav: false,

            ShowZoomSlider: false,

            lods: lods,

            autoResize: false,

          });

          // 加载基础图层

          let basepng = new customTiledLyr_sh(baseMapUrl);

          _this.myMap.map.addLayer(basepng);

          this.zoomMapToPoint(117.41895248628826, 38.82732737548387, 16);

        })

        .catch((err) => {});

    },

  },

};

</script>

<style lang="scss">

@import "./assets/css/public.scss";

nav a {

  font-size: 28px;

  color: #fff;

}

</style>
App.vue
在main.js中创建个存地图信息的全局对象:
// 地图全局参数

Vue.prototype.myMap = { map: null }
下面来看看怎么调用打点、画线、画色块吧
HomeView.vue
<template>

  <div class="home"></div>

</template>

<script>

// @ is an alias to /src

// import HelloWorld from '@/components/HelloWorld.vue'

import { drawMapClass } from "../utils/mixins";

import { dialogData } from "../utils/details";

import Vue from "vue/dist/vue.js";

export default {

  name: "HomeView",

  mixins: [drawMapClass],

  data() {

    return {};

  },

  mounted() {

    setTimeout(() => {

      this.initMap();

    }, 1000);

  },

  methods: {

    initMap() {

      let _this = this;

      _this.addGraphicsLayer("Home_Buss");

      dialogData.forEach((item) => {

        _this.addPointToMapUsePic(item);

      });

      //添加线

      var data =

        '[{"lng":"117.40233351892198","lat":"38.82599699978767"},{"lng":"117.40293433375253","lat":"38.824044351588405"},{"lng":"117.40595986557777","lat":"38.82458079340139"},{"lng":"117.40705420687624","lat":"38.819624071049404"},{"lng":"117.41241862500611","lat":"38.82037508958758"},{"lng":"117.41235425198855","lat":"38.82114756579829"}]';

      this.addLineToMap(data, "Memery_AddPoint", "#ff0000", [

        { lng: "117.40233351892198", lat: "38.82599699978767" },

        { lng: "117.41235425198855", lat: "38.82114756579829" },

      ]);

      var data2 =

        '[{"lng":"117.40293433375253","lat":"38.83526671431604"},{"lng":"117.40415742108613","lat":"38.831254129554914"},{"lng":"117.40683963015105","lat":"38.8316832830053"}]';

      this.addLineToMap(data2, "Memery_AddPoint2", "#00b5ff",[

        { lng: "117.40293433375253", lat: "38.83526671431604" },

        { lng: "117.40683963015105", lat: "38.8316832830053" },

      ]);

    },

    glayerMouseDown(e) {

      let _this = this;

      e.stopPropagation();

      this.parentbulletFrame = e.graphic.attributes.mapData;

      var Profile = Vue.extend({

        template: `

            <div class="bulletFrame" v-if='mapmodel'>

              <div class="frame_top">

                <img class="leftImg" :src="icon_warning" />

                <span>{{ bulletFrame.title }}</span>

                <img

                class="rightImg" :src="icon_error" @click="sonClose"/>

              </div>

              <div class="frame_middle">

                <p v-for="(item, index) in bulletFrame.contentTips" :key="index">

                  {{ item.tipP }}{{ item.tipContent }}

                </p>

              </div>

              <ul class="uls">

                <li v-for="(item, index) in bulletFrame.hiddenDanger" :key="index">

                  {{ item.tipLi }}<span>{{ item.numSpan }}</span>

                </li>

              </ul>

              <div class="frame_foot">

                <p class="configureP">{{bulletFrame.configuration.header}}</p>

                <div class="footDiv"></div>

              </div>

            </div>

                `,

        data() {

          return {

            icon_warning: require("@/assets/images/icon_warning.png"),

            icon_error: require("@/assets/images/icon_error.png"),

            mapmodel: true,

            bulletFrame: {

              configuration: { header: "" },

            },

          };

        },

        mounted() {

          this.bulletFrame = _this.parentbulletFrame;

        },

        methods: {

          sonClose() {

            this.mapmodel = false;

            _this.myMap.map.infoWindow.hide();

          },

        },

      });

      // // 创建 Profile 实例,并挂载到一个元素上。

      let profile = new Profile().$mount();

      this.myMap.map.infoWindow.setContent(profile.$el);

      this.myMap.map.infoWindow.resize(270, 280);

      this.myMap.map.infoWindow.show(e.mapPoint);

    },

  },

  beforeDestroy() {

    if (this.showBussLayer != null) {

      this.clearMap("Home_Buss");

    }

    this.clearMap("Memery_AddPoint");

    this.clearMap("Memery_AddPoint2");

  },

};

</script>
AboutView.vue
<template>

  <div class="about"></div>

</template>

<script>

import { drawMapClass } from "../utils/mixins";

import { mapjw } from "../utils/mapData";

export default {

  name: "AboutView",

  mixins: [drawMapClass],

  data() {

    return {};

  },

  mounted() {

    setTimeout(() => {

      this.initMap();

    }, 500);

  },

  methods: {

    initMap() {

      this.addGraphicsLayer("Memery_sekuai");

      this.addColorBlock();

    },

    // 画所有色块

    addColorBlock() {

      mapjw.forEach((item) => {

        let FillColor = null,

          LineColor = null;

        if (item.status < 5) {

          //红色

          FillColor = [255, 0, 0, 0.5];

          LineColor = [255, 0, 0, 1];

        } else if (item.status > 5 && item.status < 10) {

          //紫色

          FillColor = [158, 20, 254, 0.5];

          LineColor = [158, 20, 254, 1];

        } else if (item.status >= 10 && item.status < 20) {

          // 绿色

          FillColor = [0, 255, 156, 0.5];

          if (item.lukong == 1) {

            FillColor = [0, 255, 156, 0.6];

          }

          LineColor = [0, 255, 156, 1];

        } else if (item.status >= 20 && item.status < 30) {

          // 深蓝

          FillColor = [18, 76, 211, 0.5];

          LineColor = [18, 76, 211, 1];

        } else if (item.status >= 30 && item.status < 40) {

          // 浅蓝色

          FillColor = [255, 173, 60, 0.5];

          LineColor = [255, 173, 60, 1];

        } else {

          // 黄色

          FillColor = [27, 225, 226, 0.5];

          LineColor = [27, 225, 226, 1];

        }

        this.addRegionToMapByWkt(FillColor, LineColor, item);

      });

    },

  },

  destroyed() {

    this.clearMap("Memery_sekuai");

  },

};

</script>
好啦复制粘贴已完成,刚才领导给我和旁边的设计说我们没事的话明天就可以不来了,在家打个外勤卡,嘻嘻,这个消息让我很欢喜啊,那就提前给大家拜个早年哦,祝大家新年快乐、恭喜发财、涨薪涨薪再涨薪··················
偷偷晒下小颖上周末去买小裙裙时拍的照片,放假啦放假啦·········································

ArcGIS实现打点、线路图、色块、自定义弹窗的更多相关文章
- ArcGis之popup列表字段自定义
ArcGis之popup列表字段自定义 featureLayer图层中可以使用popupTemplate属性添加弹窗. API:https://developers.arcgis.com/javasc ...
- ExtJs基础知识总结:自定义弹窗和ComboBox自动联想加载(四)
概述 Extjs弹窗可以分为消息弹窗.对话框,这些弹窗的方式ExtJs自带的Ext.Msg.alert就已经可以满足简单消息提示,但是相对复杂的提示,比如如何将Ext.grid.Panel的控件显示嵌 ...
- xamarin UWP平台下 HUD 自定义弹窗
在我的上一篇博客中我写了一个在xamarin的UWP平台下的自定义弹窗控件.在上篇文章中介绍了一种弹窗的写法,但在实际应用中发现了该方法的不足: 1.当弹窗出现后,我们拖动整个窗口大小的时候,弹窗的窗 ...
- 支付宝小程序自定义弹窗插件|支付宝dialog插件|model插件
支付宝小程序自定义弹窗组件wcPop|小程序自定义对话框|actionSheet弹窗模板 支付宝小程序官方提供的alert提示框.dialog对话框.model弹窗功能比较有限,有些都不能随意自定义修 ...
- 微信小程序自定义弹窗wcPop插件|仿微信弹窗样式
微信小程序自定义组件弹窗wcPop|小程序消息提示框|toast自定义模板弹窗 平时在开发小程序的时候,弹窗应用场景还是蛮广泛的,但是微信官方提供的弹窗比较有局限性,不能自定义修改.这个时候首先想到的 ...
- 基于JQ的自定义弹窗组件
<!DOCTYPE html> <html lang="en"> <head> <meta charset="UTF-8&quo ...
- 获取浏览器弹窗alert、自定义弹窗以及其操作
web自动化测试第10步:获取浏览器弹窗alert.自定义弹窗以及其操作 - CSDN博客 http://blog.csdn.net/ccggaag/article/details/76573857 ...
- ionic2\ionic3 自定义弹窗
ionic2及ionic3没有了popup及 其templateUrl属性 那我们如何对弹窗里加入自定义元素 从而达到自定义弹窗样式 那么就可以通过写h5页面来实现 自定义弹窗效果: 写个H5的弹窗及 ...
- js实现自定义弹窗
众所周知,浏览器自带的原生弹窗很不美观,而且功能比较单一,绝大部分时候我们都会按照设计图自定义弹窗或者直接使用注入layer的弹窗等等.前段时间在慕课网上看到了一个自定义弹窗的实现,自己顺便就学习尝试 ...
- WPF权限控制——【3】数据库、自定义弹窗、表单验证
你相信"物竞天择,适者生存"这样的学说吗?但是我们今天却在提倡"尊老爱幼,救死扶伤",帮助并救护弱势群体:第二次世界大战期间,希特勒认为自己是优等民族,劣势民族 ...
随机推荐
- oracle expdp/exp ora-600/ora-39014报错处理
在一次数据迁移的时候,expdp导出报错,错误信息如下: 版本号:11.2.0.1 没有打PSU,查看报错的aler部分日志如下: 其中的某一些trc日志文件截图: Trace file d:\ora ...
- 二、docker安装
一.docker安装 Docker 是管理容器的工具, Docker 不等于 容器. 1.1.docker yum源设置 #step 1 download docker-ce.repo file [r ...
- Codeforces Round #831 (Div. 1 + Div. 2) A-E
比赛链接 A 题解 知识点:数学. \(2\) 特判加 \(7\),其他加 \(3\) 直接偶数. 时间复杂度 \(O(1)\) 空间复杂度 \(O(1)\) 代码 #include <bits ...
- 多项式回归 & pipeline & 学习曲线 & 交叉验证
多项式回归就是数据的分布不满足线性关系,而是二次曲线或者更高维度的曲线.此时只能使用多项式回归来拟合曲线.比如如下数据,使用线性函数来拟合就明显不合适了. 接下来要做的就是升维,上面的真实函数是:$ ...
- Xmake v2.7.3 发布,包组件和 C++ 模块增量构建支持
Xmake 是一个基于 Lua 的轻量级跨平台构建工具. 它非常的轻量,没有任何依赖,因为它内置了 Lua 运行时. 它使用 xmake.lua 维护项目构建,相比 makefile/CMakeLis ...
- 2022春每日一题:Day 22
题目:[HAOI2008]糖果传递 光看题几乎没有思路,但是显然到最后每个人手中一定有 d=s/n个糖果(s为所有人糖果总和),不妨设2号给1号x2个糖果,3号给2号x3个.....1号给n号x1个, ...
- mysql管理工具mysqladmin的使用
1. 初始化密码 mysqladmin -uroot -p'password' password 'new-password' [root@controller3 ~]# yum -y install ...
- 两行CSS让页面提升了近7倍渲染性能!
前言 对于前端人员来讲,最令人头疼的应该就是页面性能了,当用户在访问一个页面时,总是希望它能够快速呈现在眼前并且是可交互状态.如果页面加载过慢,你的用户很可能会因此离你而去.所以页面性能对于前端开发者 ...
- Spring Security(3)
您好,我是湘王,这是我的博客园,欢迎您来,欢迎您再来- 前面运行写好的代码之所以没有任何显示,是因为还没有对Spring Security进行配置,当然啥也不显示了.这就好比你坐在车上,却不打开发动机 ...
- [.NET学习]EFCore学习之旅 -2 简单的增删改查
1.实例化创建数据库上下文类 首先实例化一个数据库操作上下文类,注意到DbContext实现了IDisposable接口,所以使用using语句,避免内存泄露. 2.插入 以Person类为例,先生成 ...