matplotlib 库的使用
1.问题描述:
在学习kaggle经典学习项目Titanic,进行数据可视化处理时,对于每个特征进行相关性分析(也就是绘制pearson correlation heatmap )热力相关性矩阵时, plt.show() 图形绘制出来,字体会重叠.导致无法观察
# Visualisations

"""将数据进行可视化"""

print(train.head(3))

# correlation heatmap   相关性热点矩阵

plt.figure(figsize=(14,12))

plt.title('Pearson Correlation of Features',y=1.05,size=15)

sns.heatmap(train.astype(float).corr(),linewidths=0.1,vmax=1.0,

            square=True,linecolor='white',annot=True)

plt.show()
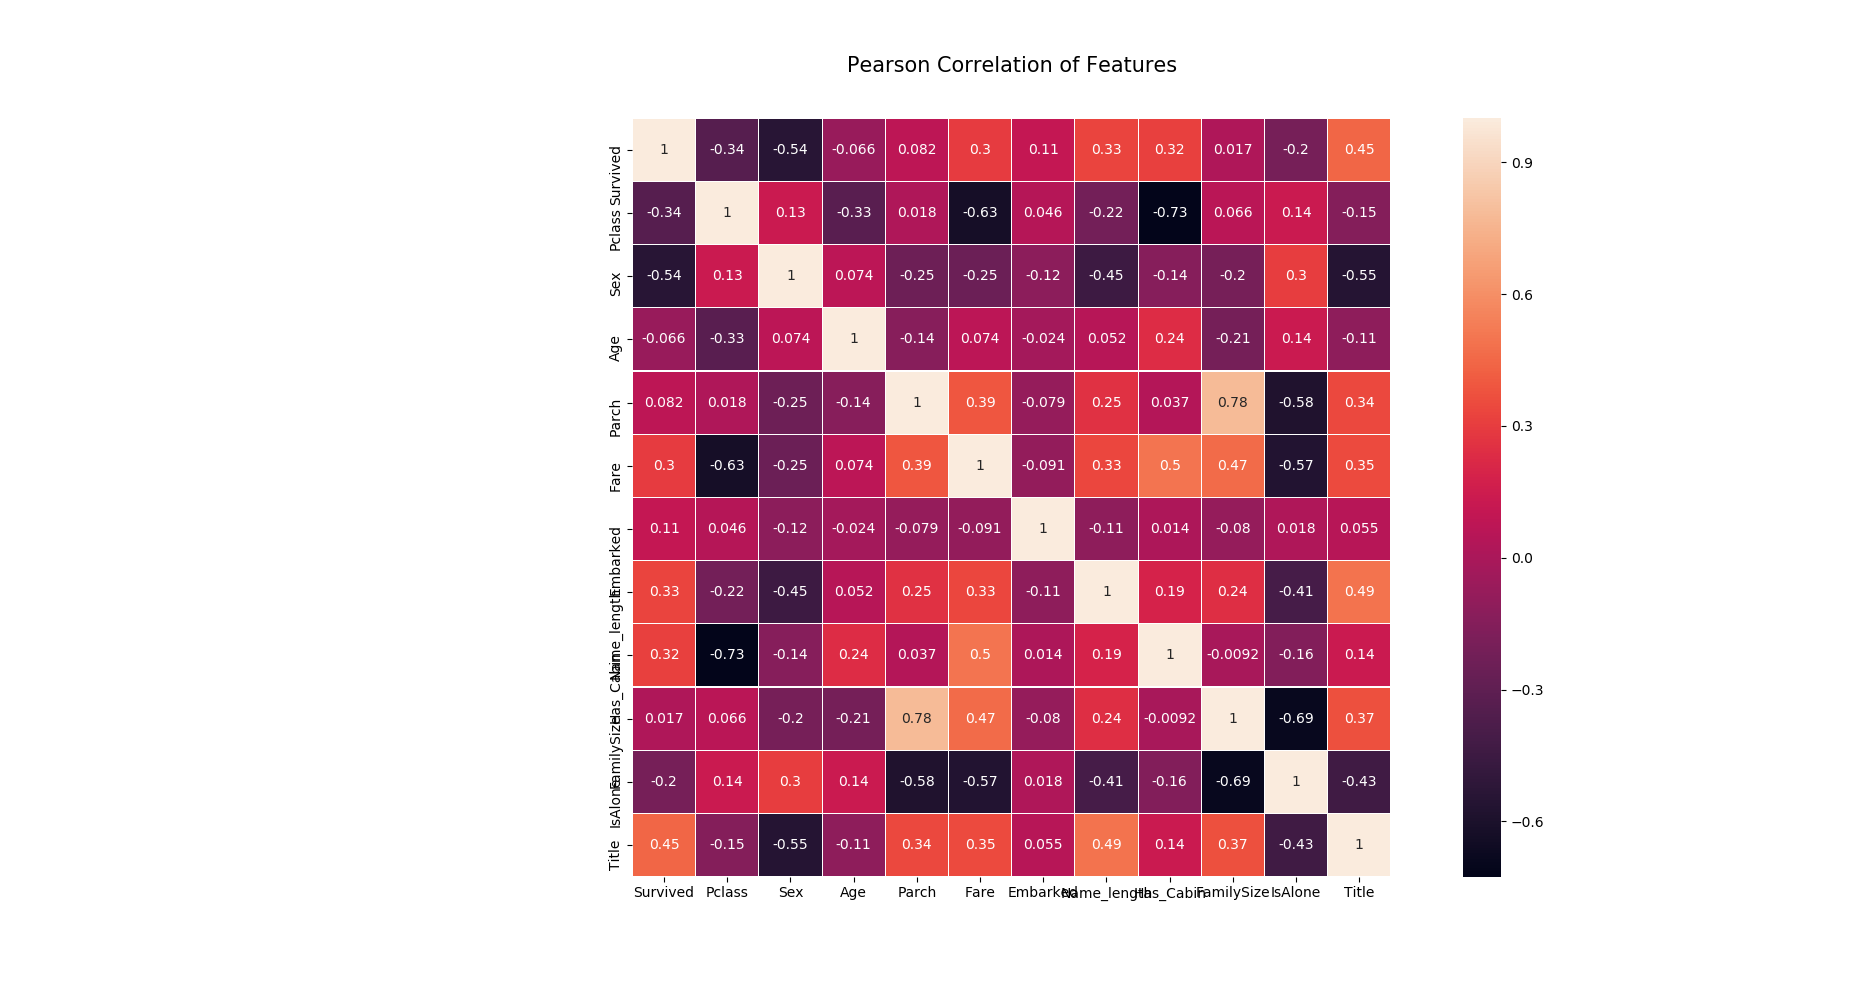
导致看不清坐标轴每个特征的含义
2.解决问题:
思路:只要找到plt所含有的命令,将X.Y坐标轴字体进行旋转即可
寻找python xlabel 的文档
Help on function xlabel in module matplotlib.pyplot:

xlabel(s, *args, **kwargs)

    Set the *x* axis label of the current axis.

    Default override is::

      override = {

          'fontsize'            : 'small',

          'verticalalignment'   : 'top',

          'horizontalalignment' : 'center'

          }

    .. seealso::

        :func:`~matplotlib.pyplot.text`

            For information on how override and the optional args work
发现没有关于xlabel进行旋转的参数,
寻找 python xticks 文档
Help on function xticks in module matplotlib.pyplot:

xticks(*args, **kwargs)

    Get or set the *x*-limits of the current tick locations and labels.

    ::

      # return locs, labels where locs is an array of tick locations and

      # labels is an array of tick labels.

      locs, labels = xticks()

      # set the locations of the xticks

      xticks( arange(6) )

      # set the locations and labels of the xticks

      xticks( arange(5), ('Tom', 'Dick', 'Harry', 'Sally', 'Sue') )

    The keyword args, if any, are :class:`~matplotlib.text.Text`

    properties. For example, to rotate long labels::

      xticks( arange(12), calendar.month_name[1:13], rotation=17 )
上面黑体下划线,rotate long label
找到参数 rotation
plt.figure(figsize=(14,12))

plt.title('Pearson Correlation of Features',y=1.05,size=15)

sns.heatmap(train.astype(float).corr(),linewidths=0.1,vmax=1.0,

            square=True,linecolor='white',annot=True)

plt.xticks(rotation=90)    # 将字体进行旋转

plt.yticks(rotation=360)

plt.show()
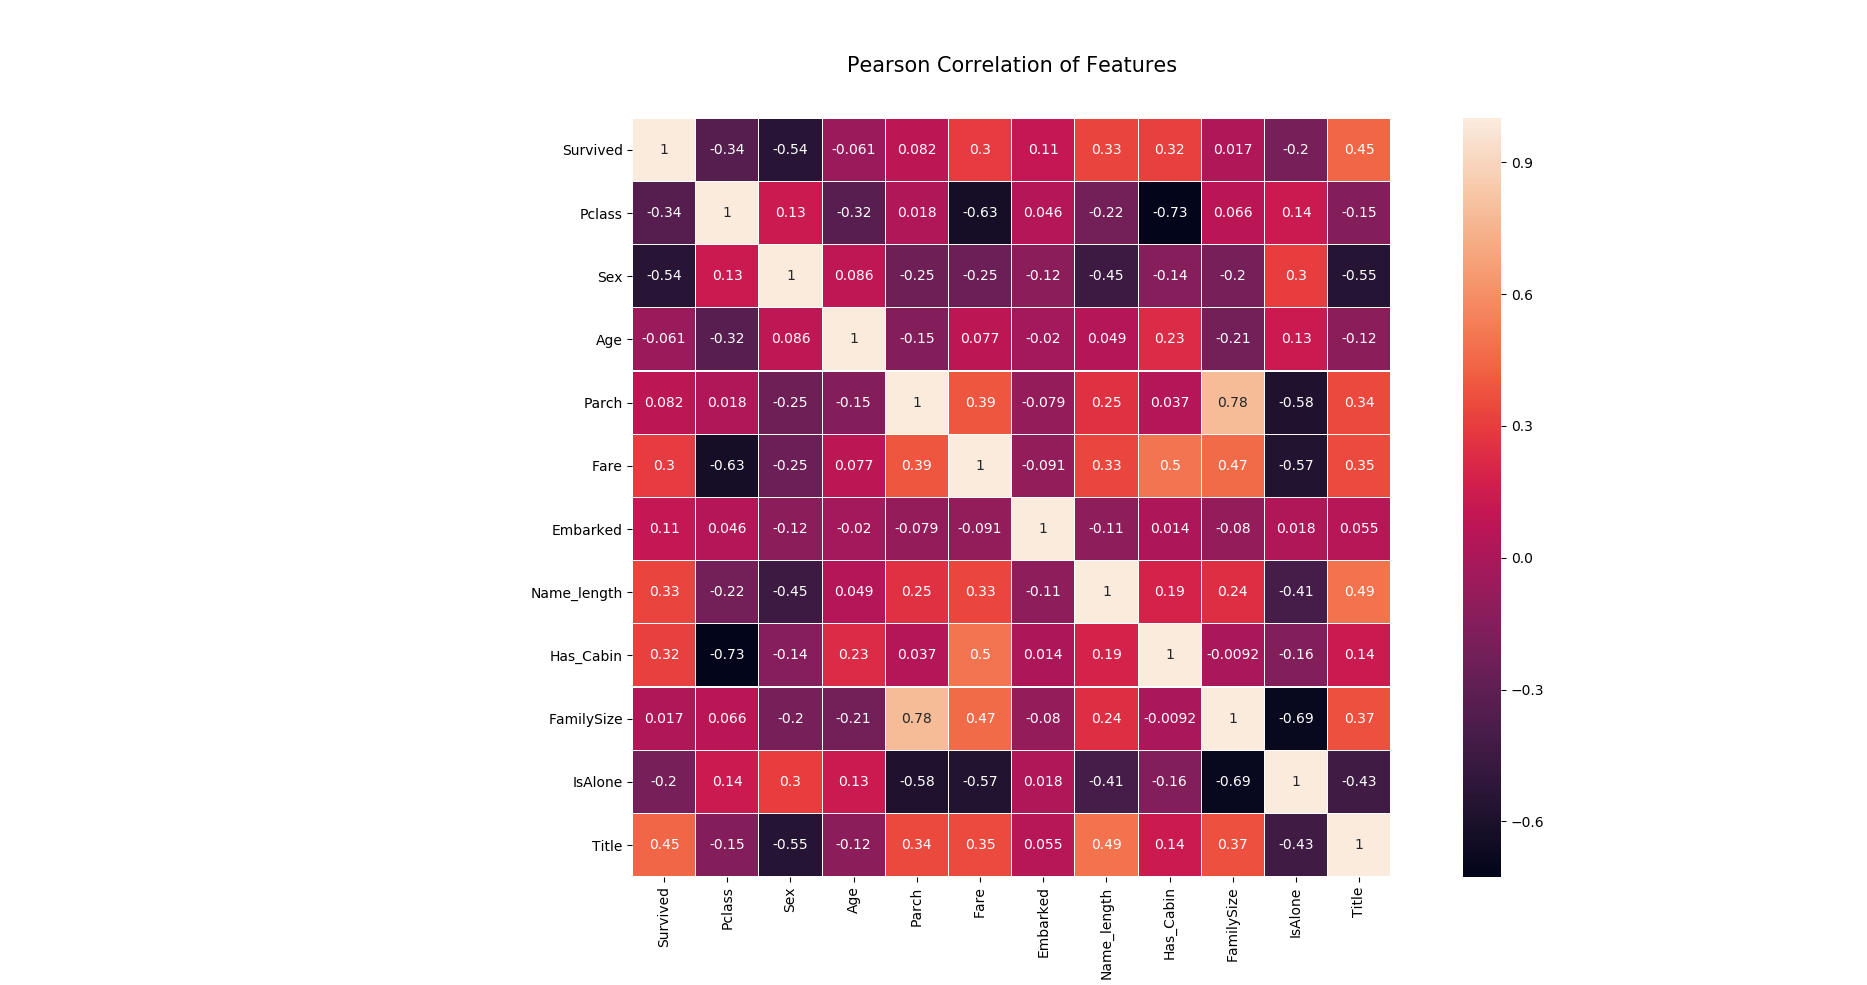
标签旋转,可清晰看到每个特征的含义
问题思考:
就是plt.show() 输出不了中文字体,这个问题还没有解决
matplotlib 库的使用的更多相关文章
- 在Ubuntu 14.04 64bit上安装numpy和matplotlib库
原文:http://blog.csdn.net/tao_627/article/details/44004541 按照这个成功安装! 机器学习是数据挖掘的一种实现形式,在学习<机器学习实战> ...
- 数据分析与展示——Matplotlib库入门
Matplotlib库入门 Matplotlib库介绍 Matliotlib库是Python优秀的数据可视化第三方库. Matliotlib库的效果见:http://matplotlib.org/ga ...
- matplotlib库的简单应用
matplotlib库 import matplotlib.pyplot as plt import matplotlib matplotlib.rcParams['font.family']='Si ...
- 对matplotlib库的运用
1.matplotlib库的运用效果图 绘制基本的三角函数 ...
- 第二周 数据分析之展示 Matplotlib库入门
Matplotlib库介绍:优秀的数据可视化第三方库 使用:Matplotlib库由各种可视化类构成,内部结构复杂,受Matlab启发,matplotlib.pyplot是绘制各类可视化图形的命令子库 ...
- numpy, matplotlib库学习笔记
Numpy库学习笔记: 1.array() 创建数组或者转化数组 例如,把列表转化为数组 >>>Np.array([1,2,3,4,5]) Array([1,2,3,4,5]) ...
- 利用matplotlib库和numpy库画数学图形
首先,电脑要安装到matplotlib库和numpy库,这可以通过到命令符那里输入“pip install matplotlib ”,两个操作一样 其次,参照下列代码: import numpy as ...
- Python的Matplotlib库简述
Matplotlib 库是 python 的数据可视化库import matplotlib.pyplot as plt 1.字符串转化为日期 unrate = pd.read_csv("un ...
- Python3.x(windows系统)安装matplotlib库
Python3.x(windows系统)安装matplotlib库 cmd命令: pip install matplotlib 执行结果:
- 机器学习 Matplotlib库入门
2017-07-21 15:22:05 Matplotlib库是一个优秀的python的数据可视化的第三方类库,其中的pyplot支持了类似matlab的图像输出操作.matplotlib.pyplo ...
随机推荐
- IDEA创建普通java和web项目教程
1.第一个javaSE项目 01.双击idea运行IDE 02.配置JDK 03.创建项目的workspace .iml文件里面是当前项目的一些配置信息! 相当于web项目中的web.xml文件 04 ...
- 使用secureCRT上传下载
secureCRT 的 下载 http://pan.baidu.com/s/1c1Mz1ks 下载完成后,输入yum install lrzsz,安装这个东西, 然后就可以直接在secureCRT中输 ...
- Linux文件系统损坏导致无法正常启动与fsck修复工具
今天在打开自己的虚拟机学习的时候,发现在文件系统检查过程中出现以下的报错: /dev/mapper/VolGroup-lv_root:UNEXPECTED INCONSISTENCY;RUN fsck ...
- 用ECharts绘制Prometheus图表,实现类似Grafana的自定义Dashboard
大家一般都是用Grafana自定义Dashboard来监控Prometheus数据的,作者这次尝试用ECharts来绘制Prometheus数据图表,一方面可以减少依赖,另一方面可以将监控界面灵活 ...
- 编写自定义 .NET Core 主机以从本机代码控制 .NET 运行时
自定义 .Net Core 主机运行.Net Core代码,以及控制运行时运行状态,是在.Net Core 高级运行环境以及定制.Net Host ,CLR 等必不可少的. 这些设置包括为 1 ...
- codeforces 322 A Ciel and Dancing
题目链接 题意: 有n个男孩和m个女孩,他们要结对跳舞,每对要有一个女孩和一个男孩,而且其中一个要求之前没有和其他人结对,求出最大可以结多少对. 如图,一条线代表一对,只有这样三种情况. #inclu ...
- 【一些小常识】Linux文件目录的通配符用法/*
在使用linux命令的时候,一时有点搞不清*的用法,于是整理记录下,在做jenkins 持续集成时还是很有用的 “*”在通配符中是最常用的一种,主要整理下在使用Linux命令时,文件夹目录的用法. 1 ...
- Computing Jobs
docker&k8shadoopsparkhbasemesosrediskafkazookeeper SCSI.NVMe.PCIe devops
- Linux启动之旅
引言 某出租房内,某台电脑的电源键被按下,于是开启了一段Linux启动之旅... BIOS 系统启动,首先进入BIOS. ● BIOS 为 Base Input/Output System(基本输入输 ...
- Java虚拟机(一)-Java内存区域
通过看深入理解java虚拟机这本书,大致总结一些笔记,或者提出一些问题,希望大家深入交流学习,第一次写博客,大家多多支持 Java虚拟机对于很多Java开发人员每天都在用,但是大部分人初学者对这些并不 ...