canvas(七)绘制网格和坐标轴
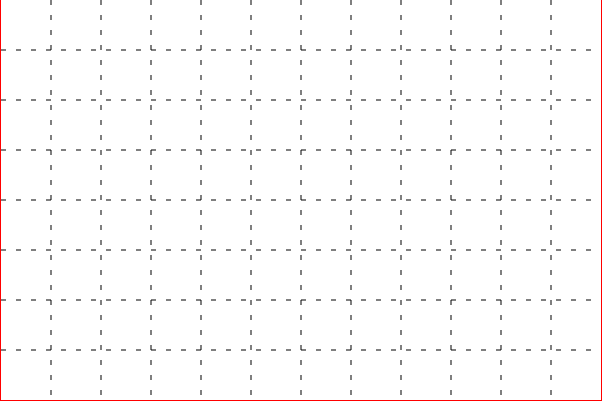
1.绘制网格
- 传入dom和分割线间隔进行渲染,网格线分为水平方向和垂直方向
<script>

    //绘制网格

    function drwaGrid(dom = document.querySelector("canvas"),space = 50){

        //获取画笔

        var ctx = dom && dom.getContext("2d")

        //根据画布宽高计算分割线数量

        var row = Math.floor(dom.height/space)

        var col = Math.floor(dom.width/space)

        //设置虚线

        ctx.setLineDash([5,10])

        //绘制水平分割线

        for(var i=0;i<=row;i++){

            //开启新路径

            ctx.beginPath()

            //起点

            ctx.moveTo(0,i*space)

            //画直线

            ctx.lineTo(dom.width,i*space)

            //绘制

            ctx.stroke()

        }

        //绘制垂直分割线

        for(var i=0;i<=col;i++){

            //开启新路径

            ctx.beginPath()

            //起点

            ctx.moveTo(i*space,0)

            //画直线

            ctx.lineTo(i*space,dom.height)

            //绘制

            ctx.stroke()

        }

    }

    //获取容器

    var box = document.querySelector('canvas')

    //绘制网格

    drwaGrid(box)

</script>
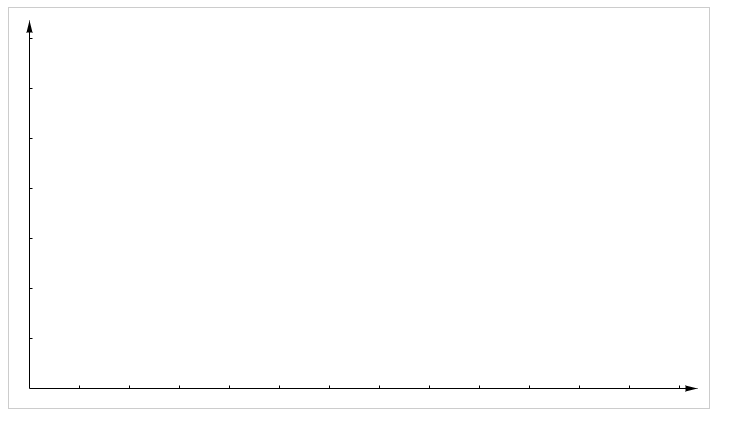
2.绘制坐标轴
- 分为3个部分:坐标轴,刻度线,坐标轴箭头
<script>

    //封装绘制坐标轴的类

    class DrawAxis{

        //构造器

        constructor(dom = document.querySelector('canvas'),padding = 20){

            //初始化

            this.init(dom,padding)

            //执行绘制

            this.render()

        }

        //初始化

        init(dom,padding){

            //获取画笔

            this.ctx = dom.getContext('2d')

            //间隔

            this.padding = padding

            //坐标原点

            this.x0 = this.padding + 0.5

            this.y0 = dom.height - this.padding + 0.5

            //坐标终点

            this.x_end = dom.width - this.padding + 0.5

            this.y_end = this.padding + 0.5

            //网格宽高

            this.grid_width = dom.width - this.padding * 2

            this.grid_height = dom.height - this.padding * 2

        }

        //执行渲染

        render(){

            //绘制坐标轴

            this.DrawLine()

            //绘制刻度线

            this.DrawMark()

            //绘制箭头

            this.DrawArrow()

        }

        //绘制坐标轴

        DrawLine(){

            //设置绘制宽度

            this.ctx.lineWidth = 1

            //横坐标线

            this.ctx.beginPath()

            //起点

            this.ctx.moveTo(this.x0,this.y0)

            //终点

            this.ctx.lineTo(this.x_end,this.y0)

            //绘制

            this.ctx.stroke()

            //纵坐标线

            this.ctx.beginPath()

            this.ctx.moveTo(this.x0,this.y0)

            this.ctx.lineTo(this.x0,this.y_end)

            this.ctx.stroke()

        }

        //绘制刻度线

        DrawMark(){

            //定义刻度间隔

            var space = 50

            //刻度线高度

            var mark_width = 3

            //计算刻度线数量

            var row = Math.floor(this.grid_height / space)

            var col = Math.floor(this.grid_width / space)

            //x轴刻度线

            for(var i=0;i<col;i++){

                //新路径

                this.ctx.beginPath()

                //当前x刻度坐标

                var x = (i+1) * space + this.x0

                //起点

                this.ctx.moveTo(x,this.y0)

                //终点

                this.ctx.lineTo(x,this.y0 - mark_width)

                //绘制

                this.ctx.stroke()

            }

            //y轴刻度线

            for(var i=0;i<row;i++){

                //新路径

                this.ctx.beginPath()

                //当前y刻度坐标

                var y = this.y0 - (i+1) * space

                //起点

                this.ctx.moveTo(this.x0,y)

                //终点

                this.ctx.lineTo(this.x0 + mark_width,y)

                //绘制

                this.ctx.stroke()

            }

        }

        //绘制箭头(以坐标轴终点为起点,填充一个三角形)

        DrawArrow(){

            //设置填充颜色

            this.ctx.fillStyle = 'black'

            //横坐标轴箭头

            //开启新路径

            this.ctx.beginPath()

            //移动到x轴终点附近

            this.ctx.moveTo(this.x_end + 8,this.y0)

            //绘制三角形

            this.ctx.lineTo(this.x_end - 4,this.y0 - 3)

            this.ctx.lineTo(this.x_end - 4,this.y0 + 3)

            this.ctx.lineTo(this.x_end + 8,this.y0)

            //填充

            this.ctx.fill()

            //纵坐标轴箭头

            //开启新路径

            this.ctx.beginPath()

            //移动到y轴终点附近

            this.ctx.moveTo(this.x0,this.y_end - 8)

            //绘制三角形

            this.ctx.lineTo(this.x0 - 3,this.y_end + 4)

            this.ctx.lineTo(this.x0 + 3,this.y_end + 4)

            this.ctx.lineTo(this.x0,this.y_end - 8)

            //填充

            this.ctx.fill()

        }

    }

    //获取容器

    var box = document.querySelector('canvas')

    //绘制坐标轴

    new DrawAxis(box)

</script>
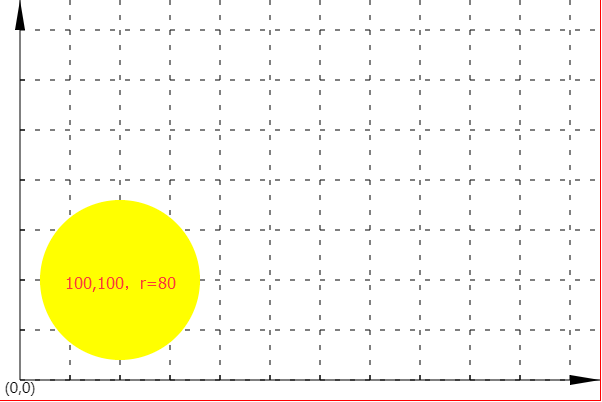
3.封装成插件
将绘制坐标轴,绘制网格,坐标转换的方法封装到插件中
使用方法,传入canvas元素和padding
class DrawCoordinateSystem{

    constructor(canvas,padding){

        this.canvas = canvas || document.querySelector("canvas")

        this.padding = padding

        this.ctx = this.canvas.getContext("2d")

        //根据padding计算原点

        this.x0 = 0+padding

        this.y0 = this.canvas.height-padding

        //定义箭头的长度和高度

        this.arrowWidth = 30

        this.arrowHeight = 5

        //定义刻度间隔

        this.space = 50

        //定义刻度长度

        this.markWidth = 5

        //绘制坐标轴

        this.drawAxis()

        //绘制网格

        this.drawDrid()

    }

    // 绘制坐标轴的方法

    drawAxis(){

        var {ctx,canvas,x0,y0,arrowWidth,arrowHeight,markWidth,space} = this

        //绘制x轴

        ctx.beginPath()

        ctx.moveTo(x0,y0)

        ctx.lineTo(canvas.width,y0)

        ctx.stroke()

        //绘制箭头

        ctx.beginPath()

        ctx.moveTo(canvas.width,y0)

        ctx.lineTo(canvas.width-arrowWidth,y0-arrowHeight)

        ctx.lineTo(canvas.width-arrowWidth,y0+arrowHeight)

        ctx.closePath()

        ctx.fill()

        //绘制x轴的刻度

        for(var x=x0+space;x<canvas.width-arrowWidth;x+=space){

            ctx.beginPath()

            ctx.moveTo(x,y0)

            ctx.lineTo(x,y0-markWidth)

            ctx.stroke()

        }

        //绘制y轴

        ctx.beginPath()

        ctx.moveTo(x0,y0)

        ctx.lineTo(x0,0)

        ctx.stroke()

        //绘制箭头

        ctx.beginPath()

        ctx.moveTo(x0,0)

        ctx.lineTo(x0-arrowHeight,arrowWidth)

        ctx.lineTo(x0+arrowHeight,arrowWidth)

        ctx.closePath()

        ctx.fill()

        //绘制x轴的刻度

        for(var y=y0-space;y>arrowWidth;y-=space){

            ctx.beginPath()

            ctx.moveTo(x0,y)

            ctx.lineTo(x0+markWidth,y)

            ctx.stroke()

        }

        //绘制原点标题

        ctx.textBaseline ="top"

        ctx.font = "15px 微软雅黑"

        ctx.textAlign = "center"

        ctx.fillText("(0,0)",x0,y0+2)

    }

    //绘制网格的方法

    drawDrid(){

        var {canvas,space,x0,y0} = this

        // 定义当前坐标

        var x = x0,y = y0

        // 设置虚线

        ctx.setLineDash([5,10])

        //绘制水平方向的网格线

        for(y=y0+space;y>0;y-=space){

            //开启路径

            ctx.beginPath()

            ctx.moveTo(x0,y)

            ctx.lineTo(canvas.width,y)

            ctx.stroke()

        }

        //绘制垂直方向的网格线

        for(x=x0+space;x<canvas.width;x+=space){

            //开启路径

            ctx.beginPath()

            ctx.moveTo(x,0)

            ctx.lineTo(x,y0)

            ctx.stroke()

        }

        ctx.beginPath()

    }

    //坐标转换工具

    transform(x=0,y=0){

        var {padding,y0} = this

        x = x+padding

        y = y0- y

        return [x,y]

    }

}
使用插件
<script>

    var canvas = document.querySelector("canvas")

    var ctx = canvas.getContext("2d")

    //绘制坐标轴

    var draw = new DrawCoordinateSystem(canvas,20)

    //在此坐标轴绘制一个圆(转换坐标)

    ctx.arc(...draw.transform(100,100),80,0,Math.PI*2)

    ctx.fillStyle="yellow";

	ctx.fill();

</script>
canvas(七)绘制网格和坐标轴的更多相关文章
- Canvas:绘制路径
Canvas:绘制路径 绘制路径 图形的基本元素是路径.路径是[通过不同颜色和宽度的线段或曲线相连形成的不同形状的]点的集合.一个路径,甚至一个子路径,都是闭合的. 使用路径绘制图形需要一些额外的步骤 ...
- canvas快速绘制圆形、三角形、矩形、多边形
想看前面整理的canvas常用API的同学可以点下面: canvas学习之API整理笔记(一) canvas学习之API整理笔记(二) 本系列文章涉及的所有代码都将上传至:项目代码github地址,喜 ...
- 用html5的canvas画布绘制贝塞尔曲线
查看效果:http://keleyi.com/keleyi/phtml/html5/7.htm 完整代码: <!DOCTYPE html PUBLIC "-//W3C//DTD XHT ...
- HTML5在canvas中绘制复杂形状附效果截图
HTML5在canvas中绘制复杂形状附效果截图 一.绘制复杂形状或路径 在简单的矩形不能满足需求的情况下,绘图环境提供了如下方法来绘制复杂的形状或路径. beginPath() : 开始绘制一个新路 ...
- Direct2D开发:绘制网格
转载请注明出处:http://www.cnblogs.com/Ray1024 一.引言 最近在使用Direct2D进行绘制工作中,需要实现使用Direct2D绘制网格的功能.在网上查了很多资料,终于实 ...
- Canvas 2D绘制抗锯齿的1px线条
当绘制1像素的线条时,发现多条线明显存在着粗细不均的问题,线条带有明显的锯齿. 事实上,Canvas的绘制线条指令都存在这个状况,如lineTo,arcTo,strokeRect. 解决方案是将Can ...
- HTML5 canvas标签绘制正三角形 鼠标按下点为中间点,鼠标抬起点为其中一个顶点
用html5的canvas标签绘制圆.矩形比较容易,绘制三角形,坐标确定相当于前面两种难点,这里绘制的是正三角形,比较容易,我们只需要把鼠标刚按下去的点设置为三角形的中心点,鼠标抬起的点设置为三角形右 ...
- untiy绘制网格mesh
关于绘制网格, 雨松前辈 已经解释的非常的到位,这里我只是搬运工,实在是感觉自己去描述的话不会有雨松大神描述的清楚,该文章循序渐进,一步步引导读者去理解unirty 绘图机制,真的是没有比这个再好得了 ...
- Canvas上绘制几何图形
重要的类自定义View组件要重写View组件的onDraw(Canvase)方法,接下来是在该 Canvas上绘制大量的几何图形,点.直线.弧.圆.椭圆.文字.矩形.多边形.曲线.圆角矩形,等各种形状 ...
- Android中使用SurfaceView和Canvas来绘制动画
事实上每一个View中都有Canvas能够用来绘制动画.仅仅须要在这个View中重载onDraw()方法就能够,可是SurfaceView类是一个专门用来制动动画的类. Canvas(中文叫做&quo ...
随机推荐
- POJ-3176 Cow Bowling(基础dp)
The cows don't use actual bowling balls when they go bowling. They each take a number (in the range ...
- .NET全局静态可访问IServiceProvider(支持Blazor)
DependencyInjection.StaticAccessor 前言 如何在静态方法中访问DI容器长期以来一直都是一个令人苦恼的问题,特别是对于热爱编写扩展方法的朋友.之所以会为这个问题苦恼,是 ...
- 《Vue.js 设计与实现》读书笔记 - 第12章、组件的实现原理
第12章.组件的实现原理 12.1 渲染组件 在渲染器内部的实现看,一个组件是一个特殊类型的虚拟 DOM 节点.之前在 patch 我们判断了 VNode 的 type 值来处理,现在来处理类型为对象 ...
- debian 12 编译 vlc/libvlc 支持 rtsp
debian 官方从11开始,不再提供支持 rtsp 的 VLC deb 包,通过 libvlc 播放 rtsp 也无法实现,因此需要自己编译. # 安装编译环境,编译依赖库以及 contrib 第三 ...
- 封装一个Promise.all 的函数
// 1. 准备三个异步函数 const promise1 = Promise.resolve('prom11ise1'); const promise2 = new Promise(function ...
- 3DRealCar: An In-the-wild RGB-D Car Dataset with 360-degree Views
3DRealCar:An In-the-wild RGB-D Car Dataset with 360-degree Views Du, Xiaobiao and Sun, Haiyang and W ...
- KubeSphere 使用 HTTPS 协议集成 Harbor 镜像仓库指南
作者:申红磊,青云科技容器解决方案架构师,开源项目爱好者,KubeSphere Member. 上面两篇文章讲了如何部署 HTTPS Harbor 和对接 HTTP 的 Harbor 镜像仓库:接下来 ...
- manim边做边学--直角平面
直角平面NumberPlane是Manim库中用于创建二维坐标平面的对象,它可以帮助用户在场景中可视化坐标轴以及网格线. 通过坐标轴.网格线以及刻度,它能够动态地展示函数曲线.几何图形以及它们的变换过 ...
- 从围绕API到围绕数据-使用流式编程构建更简洁的架构
背景 在服务刚刚搭建时,通常的思维就是根据API编写业务逻辑: // SendStream ... func (d *Svc) SendStream(stream MyApi_data.ProxyDi ...
- vue 父子组件之间传值
在vue中父子组件传值是必不可少的,大家必须要学会! 首先父组件向子组件传值: 父组件:比如我们传teacher为index,如果我们传值变量可以使用 : 绑定我们在data中定义的变量. 子组件:为 ...