matplotlib 进阶之Legend guide
import numpy as np

import matplotlib.pyplot as plt
matplotlib.pyplot.legend
在开始教程之前,我们必须先了解matplotlib.pyplot.legend(),该函数可以用以添加图例。
方法1自动检测
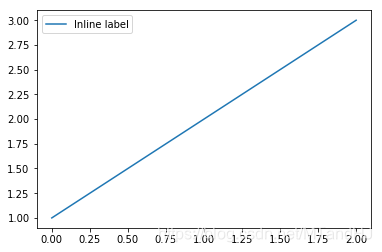
通过这种方式,lendgend()会从artist中获取label属性,并自动生成图例,比如:
fig, ax = plt.subplots()

line, = ax.plot([1, 2, 3], label="Inline label")

ax.legend()

plt.show()
或者:
line.set_label("Inline label")

ax.legend()
方法2为现有的Artist添加
我们也可以通过下列操作,为已经存在的Artist添加图例,但是这种方式并不推荐,因为我们很容易混淆。
fig, ax = plt.subplots()

line, = ax.plot([1, 2, 3])

ax.legend(["A simple line"])

方3显示添加图例
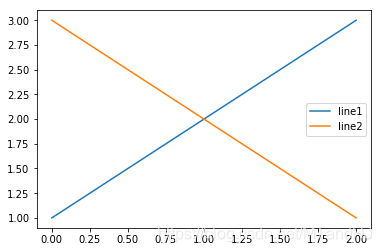
我们也可以显示添加图例:
fig, ax = plt.subplots()

line1, = ax.plot([1, 2, 3])

line2, = ax.plot([3, 2, 1])

ax.legend((line1, line2), ("line1", "line2"))
参数:
handle: Artist
label: 标签
loc:位置,比如"best":0, "upper right" 1 ...
fontsize
...
控制图例的输入
直接使用legend()命令,matplotlib会自动检测并生成图例,这种方式等价于:
handles, labels = ax.get_legend_handles_labels()

ax.legend(handles, labels)
需要注意的是,只有为Artist设置标签了,通过get_legend_handles_labels()才有效。
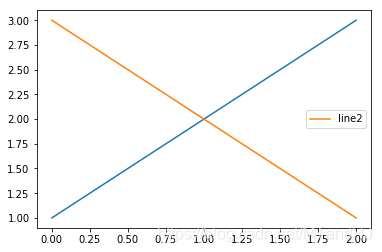
有些时候,我们只需要为部分Artist设置图例,这时只需手动传入handles:
line_up, = plt.plot([1,2,3], label='Line 2')

line_down, = plt.plot([3,2,1], label='Line 1')

plt.legend(handles=[line_up, line_down])
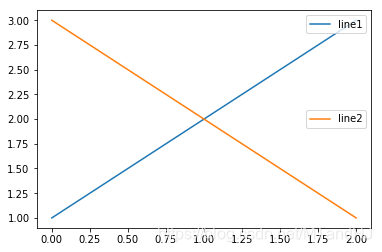
当然了,相应的可以传入标签:
line_up, = plt.plot([1,2,3], label='Line 2')

line_down, = plt.plot([3,2,1], label='Line 1')

plt.legend([line_up, line_down], ['Line Up', 'Line Down'])
为一类Artist设置图例
并不是所有的Artist都能被自动设置为图例,也不是所有Artist都需要被设置为图例。
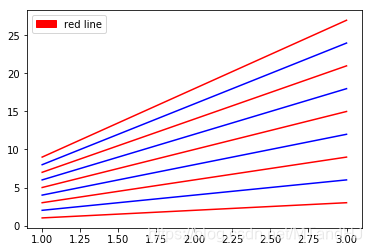
假如我们想要为所有红颜色的玩意儿设置图例:
import matplotlib.patches as mpatches

x = np.arange(1, 4)

fig, ax = plt.subplots()

for i in range(1, 10):

    ax.plot(x, i * x, color = "red" if i % 2 else "blue")

red_patch = mpatches.Patch(color="red")

# red_patch: <matplotlib.patches.Patch object at 0x00000228D0D4BF60>

plt.legend(handles=[red_patch], labels=["red line"])

plt.show()
如果没理解错,通过patches.Patch构造了一个颜色为红色的Artist类,然后legend()就会对所有满足条件的Artist的类进行处理(其实也用不了处理啊,只是加了图例)。错啦错啦,实际上,就是简单地造了一个颜色为红色的片,价格red line标签而已,跟已有的Artist没啥关系。
实际上,图例并不十分依赖于现有的Artist,我们完全可以随心所欲地添加:
import matplotlib.lines as mlines

blue_line = mlines.Line2D([], [], color='blue', marker='*',

                          markersize=15, label='Blue stars')

plt.legend(handles=[blue_line])

plt.show()
Legend 的位置 loc, bbox_to_anchor
legend()提供了loc参数,可以处理一般的位置。而bbox_to_anchor参数可以更加有效强大地来定位:
x = np.arange(1, 4)

fig, ax = plt.subplots()

for i in range(1, 10):

    ax.plot(x, i * x, color = "red" if i % 2 else "blue", label="line{0}".format(i))

plt.legend(bbox_to_anchor=(1, 1),

           bbox_transform=plt.gcf().transFigure)

plt.show()
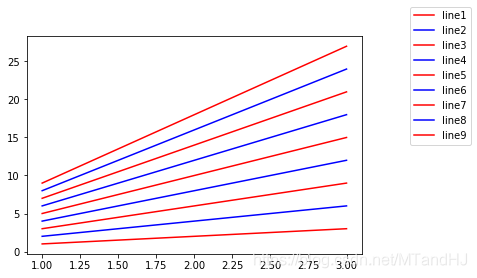
bbox_to_anchor=(1,1)表示legend的位置在右上角,因为bbox_transform,我们将坐标转换为了当前figure的坐标系,也就是图例会放在整个图片的右上角,如果我们去掉这个选项:
plt.legend(bbox_to_anchor=(1, 1))
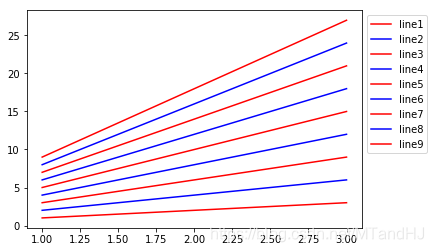
这个时候和下面是等价的:
plt.legend(bbox_to_anchor=(1,1),

		bbox_transform=ax.transAxes)
即,此时的(1,1)表示的是Axes的右上角。
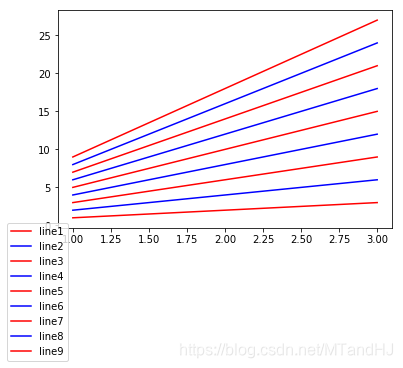
当我们这么做的时候:
plt.legend(bbox_to_anchor=(1, 1),

           bbox_transform=ax.transData)
这个时候以数据,也就是我们看到的坐标为依据:
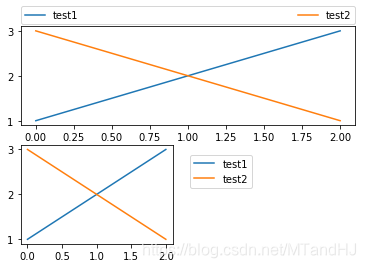
一个具体的例子
下面会用到的一些参数分析:
bbox_to_anchor: (x, y, width, height) 说实话,我并没有搞懂width, height的含义,有的时候能调正宽度,有的时候又不能
ncol: 图例的列数,有些时候图例太多,让他分成俩列三列啊
boderraxespad: axes与图例边界的距离。
plt.subplot(211)

plt.plot([1, 2, 3], label="test1")

plt.plot([3, 2, 1], label="test2")

# Place a legend above this subplot, expanding itself to

# fully use the given bounding box.

plt.legend(bbox_to_anchor=(0., 1.02, 1., .102), loc='lower left',

           ncol=2, mode="expand", borderaxespad=0.)

plt.subplot(223)

plt.plot([1, 2, 3], label="test1")

plt.plot([3, 2, 1], label="test2")

# Place a legend to the right of this smaller subplot.

plt.legend(bbox_to_anchor=(1.05, 1), loc='upper left', borderaxespad=1.)

plt.show()
同一个Axes多个legend
如果我们多次使用legend(),实际上并不会生成多个图例:
fig, ax = plt.subplots()

line1, = ax.plot([1, 2, 3])

line2, = ax.plot([3, 2, 1])

ax.legend([line1], ["line1"])

ax.legend([line2], ["line2"])

plt.show()
为此,我们需要手动添加图例:
fig, ax = plt.subplots()

line1, = ax.plot([1, 2, 3])

line2, = ax.plot([3, 2, 1])

legend1 = ax.legend([line1], ["line1"], loc="upper right")

ax.add_artist(legend1)

ax.legend([line2], ["line2"])

plt.show()
Legend Handlers
没看懂啥意思。
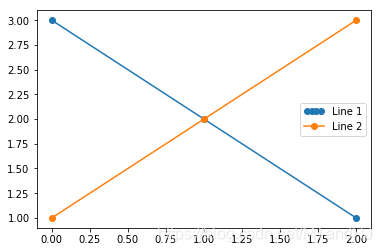
from matplotlib.legend_handler import HandlerLine2D

line1, = plt.plot([3, 2, 1], marker='o', label='Line 1')

line2, = plt.plot([1, 2, 3], marker='o', label='Line 2')

plt.legend(handler_map={line1: HandlerLine2D(numpoints=4)})
from numpy.random import randn

z = randn(10)

red_dot, = plt.plot(z, "ro", markersize=15)

# Put a white cross over some of the data.

white_cross, = plt.plot(z[:5], "w+", markeredgewidth=3, markersize=15)

plt.legend([red_dot, (red_dot, white_cross)], ["Attr A", "Attr A+B"])
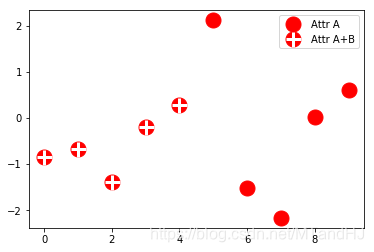
从这例子中感觉,就是legend_handler里面有一些现成,稀奇古怪的图例供我们使用?
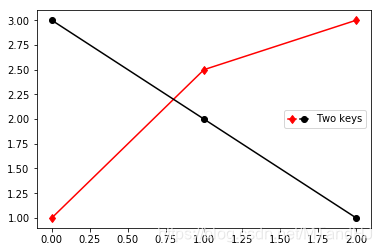
from matplotlib.legend_handler import HandlerLine2D, HandlerTuple

p1, = plt.plot([1, 2.5, 3], 'r-d')

p2, = plt.plot([3, 2, 1], 'k-o')

l = plt.legend([(p1, p2)], ['Two keys'], numpoints=1,

               handler_map={tuple: HandlerTuple(ndivide=None)})
自定义图例处理程序
这一节呢,主要就是告诉我们,如何通过handler_map这个参数,传入一个映射,可以构造任意?奇形怪状的图例?不过参数也忒多了吧,不过感觉蛮有用的。
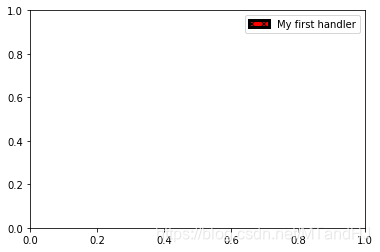
import matplotlib.patches as mpatches

class AnyObject(object):

    pass

class AnyObjectHandler(object):

    def legend_artist(self, legend, orig_handle, fontsize, handlebox):

        x0, y0 = handlebox.xdescent, handlebox.ydescent

        width, height = handlebox.width, handlebox.height

        patch = mpatches.Rectangle([x0, y0], width, height, facecolor='red',

                                   edgecolor='black', hatch='xx', lw=3,

                                   transform=handlebox.get_transform())

        handlebox.add_artist(patch)

        return patch

plt.legend([AnyObject()], ['My first handler'],

           handler_map={AnyObject: AnyObjectHandler()})
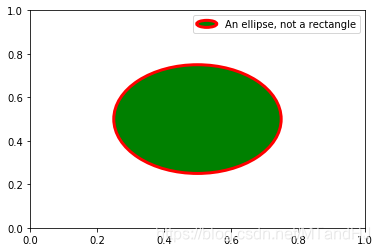
from matplotlib.legend_handler import HandlerPatch

class HandlerEllipse(HandlerPatch):

    def create_artists(self, legend, orig_handle,

                       xdescent, ydescent, width, height, fontsize, trans):

        center = 0.5 * width - 0.5 * xdescent, 0.5 * height - 0.5 * ydescent

        p = mpatches.Ellipse(xy=center, width=width + xdescent,

                             height=height + ydescent)

        self.update_prop(p, orig_handle, legend)

        p.set_transform(trans)

        return [p]

c = mpatches.Circle((0.5, 0.5), 0.25, facecolor="green",

                    edgecolor="red", linewidth=3)

plt.gca().add_patch(c)

plt.legend([c], ["An ellipse, not a rectangle"],

           handler_map={mpatches.Circle: HandlerEllipse()})
"""都是啥和啥啊。。。"""
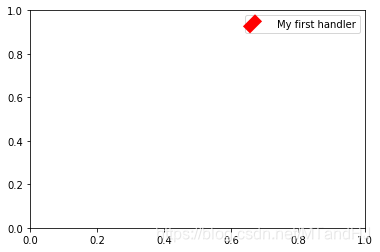
class AnyObject(object):
pass
class AnyObjectHandler(object):
def legend_artist(self, legend, orig_handle, fontsize, handlebox):
x0, y0 = handlebox.xdescent, handlebox.ydescent
width, height = handlebox.width, handlebox.height
patch = mlines.Line2D([1, 2, 3, 4, 6], [1, 2, 3, 4, 6], linewidth=width/2, color='red',
transform=handlebox.get_transform())
handlebox.add_artist(patch)
return patch
plt.legend([AnyObject()], ['My first handler'],
handler_map={AnyObject: AnyObjectHandler()})
函数链接
plt.lengend()-添加图例
get_legend_handles_labels()-获取图例处理对象和对应的标签
matplotlib.patches-包括向量,圆,矩形,多边形等等
legend_artist
matplotlib 进阶之Legend guide的更多相关文章
- matplotlib中的legend()—显示图例
源自 matplotlib中的legend()——用于显示图例 -- 博客园 http://www.cnblogs.com/yinheyi/p/6792120.html legend()的一个用法: ...
- matplotlib 进阶之Tight Layout guide
目录 简单的例子 Use with GridSpec Legend and Annotations Use with AxesGrid1 Colorbar 函数链接 matplotlib教程学习笔记 ...
- matplotlib 进阶之Constrained Layout Guide
目录 简单的例子 Colorbars Suptitle Legends Padding and Spacing spacing with colobars rcParams Use with Grid ...
- matplotlib 入门之Usage Guide
文章目录 Usage Guide plotting函数的输入 matplotlib, pyplot, pylab, 三者的联系 Coding style Backends 后端 matplotlib教 ...
- 【Python学习笔记】调整matplotlib的图例legend的位置
有时默认的图例位置不符合我们的需要,那么我们可以使用下面的代码对legend位置进行调整. plt.legend(loc='String or Number', bbox_to_anchor=(num ...
- 【转】matplotlib制图——图例legend
转自:https://www.cnblogs.com/alimin1987/p/8047833.html import matplotlib.pyplot as pltimport numpy as ...
- matplotlib中的legend()——用于显示图例
legend()的一个用法: 当我们有多个 axes时,我们如何把它们的图例放在一起呢?? 我们可以这么做: import matplotlib.pyplot as plt import numpy ...
- 【python】matplotlib进阶
参考文章:https://liam0205.me/2014/09/11/matplotlib-tutorial-zh-cn/ 几个重要对象:图像.子图.坐标轴.记号 figure:图像, subplo ...
- matplotlib 进阶之origin and extent in imshow
目录 显示的extent Explicit extent and axes limits matplotlib教程学习笔记 import numpy as np import matplotlib.p ...
随机推荐
- Spark(一)【spark-3.0安装和入门】
目录 一.Windows安装 1.安装 2.使用 二.Linux安装 Local模式 1.安装 2.使用 yarn模式 1.安装 2.使用 3.spark的历史服务器集成yarn 一.Windows安 ...
- nodejs-Child Process模块
JavaScript 标准参考教程(alpha) 草稿二:Node.js Child Process模块 GitHub TOP Child Process模块 来自<JavaScript 标准参 ...
- echarts饼图样式
1.中间标题字体大小不一致(可分为一个title一个graphic) 2.labelLine与饼图分离(两个饼图,其中一个显示一个隐藏) function setmyChartJsgxzq(arr,d ...
- SpringBoot java配置类@Configuration 的两种写法
首先在Springboot项目中,件一个java类,使用注解@Configuration ,则这个类是SpringBoot bean的创建的配置文件类,,这种配置文件类有两种写法 1.使用包扫描 , ...
- 前端两大框架 vue 和 react 的区别
1. 设计思想 vue: vue的官网介绍说vue是一种渐进式框架,采用自底向上增量开发的设计: react: 采用函数式编程,推崇纯组件,数据不可变,单向数据流: 2. 编写语法 vue: 采用单文 ...
- Java易错小结
String 相关运算 String使用是注意是否初始化,未初始化的全部为null.不要轻易使用 string.isEmpty()等,首先确保string非空. 推荐使用StringUtils.isN ...
- ASP.NET管道模型简析
我相信在第一次听到这个名词时,有的小伙伴会一脸懵,而且还有很多疑问,其实我在第一次接触这个概念时跟很多小伙伴一样一脸懵. 接下来我将以我自己的理解来讲述什么是管道模型. 什么是管道模型 首先有没有小伙 ...
- Web容器(tomcat服务器)处理JSP文件请求的三个阶段
Web容器(tomcat服务器)处理JSP文件请求的三个阶段 翻译:编写好的jsp文件被web容器中的jsp引擎转换成java源码. 编译:翻译成java源码的jsp文件会被编译成可被计算机执行的字节 ...
- Jenkins环境变量
目录 一.环境变量 二.自定义环境变量 三.自定义全局变量 四.常用变量定义 五.常用环境变量 一.环境变量 环境变量可以被看作是pipeline与Jenkins交互的媒介.比如,可以在pipelin ...
- hooks中,useState异步问题解决方案
问题描述: 在hooks中,修改状态的是通过useState返回的修改函数实现的.它的功能类似于class组件中的this.setState().而且,这两种方式都是异步的.可是this.setSta ...