matplotlib 进阶之origin and extent in imshow
matplotlib教程学习笔记
import numpy as np

import matplotlib.pyplot as plt

from matplotlib.gridspec import GridSpec

def index_to_coordinate(index, extent, origin):

    """Return the pixel center of an index."""

    left, right, bottom, top = extent

    hshift = 0.5 * np.sign(right - left)

    left, right = left + hshift, right - hshift

    vshift = 0.5 * np.sign(top - bottom)

    bottom, top = bottom + vshift, top - vshift

    if origin == 'upper':

        bottom, top = top, bottom

    return {

        "[0, 0]": (left, bottom),

        "[M', 0]": (left, top),

        "[0, N']": (right, bottom),

        "[M', N']": (right, top),

    }[index]

def get_index_label_pos(index, extent, origin, inverted_xindex):

    """

    Return the desired position and horizontal alignment of an index label.

    """

    if extent is None:

        extent = lookup_extent(origin)

    left, right, bottom, top = extent

    x, y = index_to_coordinate(index, extent, origin)

    is_x0 = index[-2:] == "0]"

    halign = 'left' if is_x0 ^ inverted_xindex else 'right'

    hshift = 0.5 * np.sign(left - right)

    x += hshift * (1 if is_x0 else -1)

    return x, y, halign

def get_color(index, data, cmap):

    """Return the data color of an index."""

    val = {

        "[0, 0]": data[0, 0],

        "[0, N']": data[0, -1],

        "[M', 0]": data[-1, 0],

        "[M', N']": data[-1, -1],

    }[index]

    return cmap(val / data.max())

def lookup_extent(origin):

    """Return extent for label positioning when not given explicitly."""

    if origin == 'lower':

        return (-0.5, 6.5, -0.5, 5.5)

    else:

        return (-0.5, 6.5, 5.5, -0.5)

def set_extent_None_text(ax):

    ax.text(3, 2.5, 'equals\nextent=None', size='large',

            ha='center', va='center', color='w')

def plot_imshow_with_labels(ax, data, extent, origin, xlim, ylim):

    """Actually run ``imshow()`` and add extent and index labels."""

    im = ax.imshow(data, origin=origin, extent=extent)

    # extent labels (left, right, bottom, top)

    left, right, bottom, top = im.get_extent()

    if xlim is None or top > bottom:

        upper_string, lower_string = 'top', 'bottom'

    else:

        upper_string, lower_string = 'bottom', 'top'

    if ylim is None or left < right:

        port_string, starboard_string = 'left', 'right'

        inverted_xindex = False

    else:

        port_string, starboard_string = 'right', 'left'

        inverted_xindex = True

    bbox_kwargs = {'fc': 'w', 'alpha': .75, 'boxstyle': "round4"}

    ann_kwargs = {'xycoords': 'axes fraction',

                  'textcoords': 'offset points',

                  'bbox': bbox_kwargs}

    ax.annotate(upper_string, xy=(.5, 1), xytext=(0, -1),

                ha='center', va='top', **ann_kwargs)

    ax.annotate(lower_string, xy=(.5, 0), xytext=(0, 1),

                ha='center', va='bottom', **ann_kwargs)

    ax.annotate(port_string, xy=(0, .5), xytext=(1, 0),

                ha='left', va='center', rotation=90,

                **ann_kwargs)

    ax.annotate(starboard_string, xy=(1, .5), xytext=(-1, 0),

                ha='right', va='center', rotation=-90,

                **ann_kwargs)

    ax.set_title('origin: {origin}'.format(origin=origin))

    # index labels

    for index in ["[0, 0]", "[0, N']", "[M', 0]", "[M', N']"]:

        tx, ty, halign = get_index_label_pos(index, extent, origin,

                                             inverted_xindex)

        facecolor = get_color(index, data, im.get_cmap())

        ax.text(tx, ty, index, color='white', ha=halign, va='center',

                bbox={'boxstyle': 'square', 'facecolor': facecolor})

    if xlim:

        ax.set_xlim(*xlim)

    if ylim:

        ax.set_ylim(*ylim)

def generate_imshow_demo_grid(extents, xlim=None, ylim=None):

    N = len(extents)

    fig = plt.figure(tight_layout=True)

    fig.set_size_inches(6, N * (11.25) / 5)

    gs = GridSpec(N, 5, figure=fig)

    columns = {'label': [fig.add_subplot(gs[j, 0]) for j in range(N)],

               'upper': [fig.add_subplot(gs[j, 1:3]) for j in range(N)],

               'lower': [fig.add_subplot(gs[j, 3:5]) for j in range(N)]}

    x, y = np.ogrid[0:6, 0:7]

    data = x + y

    for origin in ['upper', 'lower']:

        for ax, extent in zip(columns[origin], extents):

            plot_imshow_with_labels(ax, data, extent, origin, xlim, ylim)

    for ax, extent in zip(columns['label'], extents):

        text_kwargs = {'ha': 'right',

                       'va': 'center',

                       'xycoords': 'axes fraction',

                       'xy': (1, .5)}

        if extent is None:

            ax.annotate('None', **text_kwargs)

            ax.set_title('extent=')

        else:

            left, right, bottom, top = extent

            text = ('left: {left:0.1f}\nright: {right:0.1f}\n' +

                    'bottom: {bottom:0.1f}\ntop: {top:0.1f}\n').format(

                        left=left, right=right, bottom=bottom, top=top)

            ax.annotate(text, **text_kwargs)

        ax.axis('off')

    return columns
generate_imshow_demo_grid(extents=[None]);

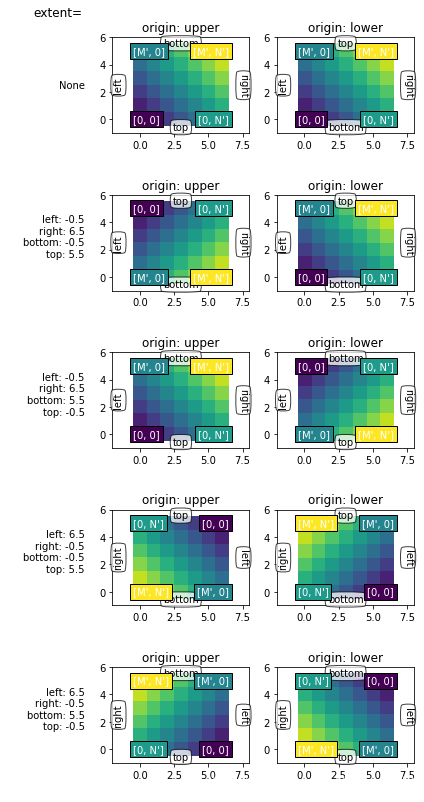
通常来说,对于shape(M, N)来讲,M是沿着竖直方向的,而N是沿着水平方向的。
origin参数觉得了其实位置:
对于 origin="lower":
[0, 0] 在 (left, bottom)位置
[M, 0] 在 (left, upper)位置
[0, N] 在 (right, bottom)位置
[M, N] 在 (right, top) 位置
实际上就是,从左下角往右上角发展
而对于orgin="upper",则是从左上角往右下角发展
显示的extent
extent是控制图片的坐标轴的工具,为(left, right, bottom, top)
就是控制x轴为: left -> right
y轴为: bottom -> top
extents = [(-0.5, 6.5, -0.5, 5.5),

           (-0.5, 6.5, 5.5, -0.5),

           (6.5, -0.5, -0.5, 5.5),

           (6.5, -0.5, 5.5, -0.5)]

columns = generate_imshow_demo_grid(extents)

set_extent_None_text(columns['upper'][1])

set_extent_None_text(columns['lower'][0])

Explicit extent and axes limits
搞不懂了啊,为什么加了limits之后,可以随便转来转去了啊不知道,就这样吧
generate_imshow_demo_grid(extents=[None] + extents,

                          xlim=(-2, 8), ylim=(-1, 6));
matplotlib 进阶之origin and extent in imshow的更多相关文章
- matplotlib 进阶之Tight Layout guide
目录 简单的例子 Use with GridSpec Legend and Annotations Use with AxesGrid1 Colorbar 函数链接 matplotlib教程学习笔记 ...
- 【python】matplotlib进阶
参考文章:https://liam0205.me/2014/09/11/matplotlib-tutorial-zh-cn/ 几个重要对象:图像.子图.坐标轴.记号 figure:图像, subplo ...
- matplotlib 进阶之Constrained Layout Guide
目录 简单的例子 Colorbars Suptitle Legends Padding and Spacing spacing with colobars rcParams Use with Grid ...
- matplotlib 进阶之Customizing Figure Layouts Using GridSpec and Other Functions
目录 对Gridspec的一些精细的调整 利用SubplotSpec fig.add_grdispec; gs.subgridspec 一个利用Subplotspec的复杂例子 函数链接 matplo ...
- matplotlib 进阶之Legend guide
目录 matplotlib.pyplot.legend 方法1自动检测 方法2为现有的Artist添加 方3显示添加图例 控制图例的输入 为一类Artist设置图例 Legend 的位置 loc, b ...
- matplotlib 进阶之Artist tutorial(如何操作Atrist和定制)
目录 基本 plt.figure() fig.add_axes() ax.lines set_xlabel 一个完整的例子 定制你的对象 obj.set(alpha=0.5, zorder=2), o ...
- 基于matplotlib的数据可视化 - 热图imshow
热图: Display an image on the axes. 可以用来比较两个矩阵的相似程度 mp.imshow(z, cmap=颜色映射,origin=垂直轴向) imshow( X, cma ...
- 『Python』matplotlib的imshow用法
热力图是一种数据的图形化表示,具体而言,就是将二维数组中的元素用颜色表示.热力图之所以非常有用,是因为它能够从整体视角上展示数据,更确切的说是数值型数据. 使用imshow()函数可以非常容易地制作热 ...
- matplotlib 入门之Sample plots in Matplotlib
文章目录 Line Plot One figure, a set of subplots Image 展示图片 展示二元正态分布 A sample image Interpolating images ...
随机推荐
- 日常Java 2021/9/26 (二柱升级版)
package m; import java.util.Scanner;import java.util.Random; public class di_er { static int number= ...
- abide, able, abnormal
abide 近/反义词:1. 忍受: bear, endure, put up with, stand, tolerate2. 遵守(abide by): accept, comply, confor ...
- nodejs-Cluster模块
JavaScript 标准参考教程(alpha) 草稿二:Node.js Cluster模块 GitHub TOP Cluster模块 来自<JavaScript 标准参考教程(alpha)&g ...
- 字节面试问我如何高效设计一个LRU,当场懵
首发公众号:bigsai 转载请放置作者和原文(本文)链接 前言 大家好,我是bigsai,好久不见,甚是想念! 最近有个小伙伴跟我诉苦,说他没面到LRU,他说他很久前知道有被问过LRU的但是心想自己 ...
- Sharding-JDBC 实现水平分库分表
1.需求分析
- CSS系列,清除浮动方法总结
在非IE浏览器(如Firefox)下,当容器的高度为auto,且容器的内容中有浮动(float为left或right)的元素.在这种情况下,容器的高度不能自动伸长以适应内容的高度,使得内容溢出到容器外 ...
- 容器之分类与各种测试(四)——unordered-multiset
unordered-multiset是不定序关联式容器,其底部是通过哈希表实现功能. (ps:黑色框就是bucket,白色框即为bucket上挂载的元素) 为了提高查找效率,bucket(篮子)的数量 ...
- ClassLoad类加载器与双亲委派模型
1. 类加载器 Class类描述的是整个类的信息,在Class类中提供的方法getName()是根据ClassPath配置的路径来进行类加载的.若类加载的路径为文件.网络等时则必须进行类加载这是就需要 ...
- JConsole可视化工具
JConsole基本介绍 Jconsole (Java Monitoring and Management Console),一种基于JMX的可视化监视.管理工具.JConsole 基本包括以下基本功 ...
- sqlserver 删除表分区
我们都知道,SQL server2008R2企业版以及一些其它的版本支持分区函数,当你在这些数据库备份后想在一些不支持分区函数的数据库做还原时,就会失败. 下面我们来解决这个问题. 1.备份数据库!备 ...