使用Promethues和Grafana监控Flink
之前使用Influxdb储存Metrics经常会出现数据写不进去的问题,当Influxdb重启之后又能写进去,遂将数据存储部分换成Promethues,因为Flink采用PutGateway的方式,需要先将PutGateway安装好
flink1.10.0使用prometheus版本是0.3.0,我们在这里使用0.9.1的版本,如果使用最新版1.2.0会出现不兼容的问题
第一步:安装PutGateway
cd /usr/local/
wget https://github.com/prometheus/pushgateway/releases/download/v0.9.1/pushgateway-0.9.1.linux-amd64.tar.gz
tar -zxvf pushgateway-0.9.1.linux-amd64.tar.gz
nohup ./pushgateway &
第二步:配置prometheus
vi /usr/local/prometheus-2.1.0.linux-amd64/prometheus.yml 增加以下配置
  - job_name: 'flink'

    scrape_interval: 10s

    scrape_timeout: 10s

    static_configs:

      - targets: ['localhost:9091']

        labels:

          instance: 'pushgateway'
第三步:配置Flink
nohup /usr/local/prometheus-2.1.0.linux-amd64/prometheus --config.file=/usr/local/prometheus-2.1.0.linux-amd64/prometheus.yml & 启动prometheus
metrics.reporter.promgateway.class: org.apache.flink.metrics.prometheus.PrometheusPushGatewayReporter

metrics.reporter.promgateway.host: xx.xx.xx.xx

metrics.reporter.promgateway.port: 9091

metrics.reporter.promgateway.jobName: flink

metrics.reporter.promgateway.randomJobNameSuffix: true

metrics.reporter.promgateway.deleteOnShutdown: true
cd flink
cp opt/flink-metrics-prometheus-1.10.0.jar lib/
第四步:配置Grafana
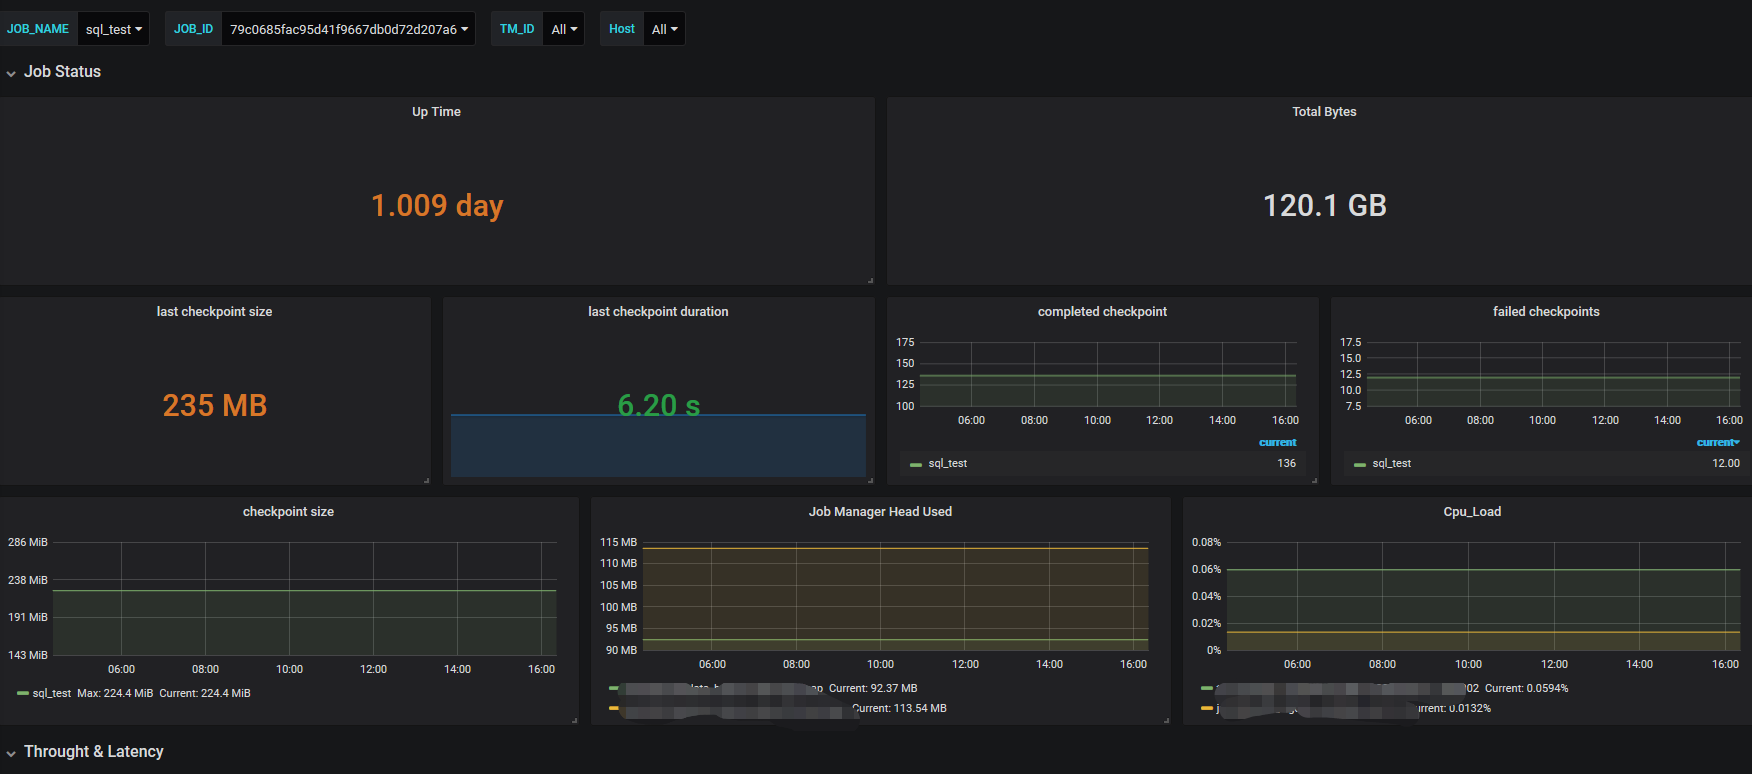
配置grafana过程比较痛苦,根据需要监控的指标进行配置,最后展示的页面和之前配置的一样
参考
https://ci.apache.org/projects/flink/flink-docs-release-1.8/monitoring/metrics.html#prometheus-orgapacheflinkmetricsprometheusprometheusreporter
https://github.com/prometheus/pushgateway/releases
https://www.cnblogs.com/huandada/p/10932953.html
使用Promethues和Grafana监控Flink的更多相关文章
- promethues exporter+ grafana 监控pg+mysql
这篇文章本来是打算使用pmm 进行数据库监控的,但是居然参考官方文档使用docker 运行起来有点问题,所以直接改用 exporter 进行处理,但是比pmm 弱好多 pmm 的参考架构 说明,以上图 ...
- 部署Prometheus+Grafana监控
Prometheus 1.不是很友好,各种配置都手写 2.对docker和k8s监控有成熟解决方案 Prometheus(普罗米修斯) 是一个最初在SoudCloud上构建的监控系统,开源项目,拥有非 ...
- Docker部署Zabbix+Grafana监控
Docker部署Zabbix+Grafana监控 环境 centos 7 ; Docker 17.12.0-ce ; docker-compose version 1.20.1 2018-4-1 当前 ...
- cAdvisor+Prometheus+Grafana监控docker
cAdvisor+Prometheus+Grafana监控docker 一.cAdvisor(需要监控的主机都要安装) 官方地址:https://github.com/google/cadvisor ...
- [转帖]Prometheus+Grafana监控Kubernetes
原博客的位置: https://blog.csdn.net/shenhonglei1234/article/details/80503353 感谢原作者 这里记录一下自己试验过程中遇到的问题: . 自 ...
- 使用Telegraf + Influxdb + Grafana 监控SQLserver服务器的运行状况
使用Telegraf + Influxdb + Grafana 监控SQLserver服务器的运行状况 前言 本文在Debian9下采用Docker的方式安装Telegraf + Influxdb + ...
- 快速接入业务监控体系,grafana监控的艺术
做一个系统,如果不做监控,是不完善的. 如果为做一个快速系统,花力气去做监控,是不值得的. 因为,我们有必要具备一个能够快速建立监控体系的能力.即使你只是一个普通开发人员! 个人觉得,做监控有三个核心 ...
- prometheus+grafana监控redis
prometheus+grafana监控redis redis安装配置 https://www.cnblogs.com/autohome7390/p/6433956.html redis_export ...
- prometheus+grafana监控mysql
prometheus+grafana监控mysql 1.安装配置MySQL官方的 Yum Repository(有mysql只需设置监控账号即可) [root@localhost ~]# wget - ...
- [转帖]安装prometheus+grafana监控mysql redis kubernetes等
安装prometheus+grafana监控mysql redis kubernetes等 https://www.cnblogs.com/sfnz/p/6566951.html plug 的模式进行 ...
随机推荐
- linux/windows解决/关闭端口占用
Linux 找到占用端口的进程信息: netstat -lnp|grep 端口号 例如:netstat -lnp|grep 8080 就是找到正在使用8080端口的进程 关闭进程: kill -9 进 ...
- git02 IDEA使用git
1 定位 Git 程序 2 初始化本地库 选择要创建 Git 本地仓库的工程. 3 添加项目到暂存区 右键点击项目选择 Git -> Add 将项目添加到暂存区 4 提交到本地库 5 切换版本 ...
- .NET为什么推荐它作为RabbitMQ消息队列的首选开发工具
支持.Net Core(2.0及以上)/.Net Framework(4.5及以上),可以部署在Docker, Windows, Linux, Mac. RabbitMQ作为一款主流的消息队列工具早已 ...
- Linux基础之用户、组和权限管理
用户类别分为:普通用户.系统用户.登陆用户 用户标识:UserID, UID 是16bits二进制数字: 0-65535管理员:0普通用户:0-65536系统用户:1-499(CentOS6)1-99 ...
- Python自动合并Word文件同时添加分页符的方法
本文介绍基于Python,实现对多个Word文档加以自动合并,并在每次合并时按要求增添一个分页符的方法. 现有多个Word文档文件,需将其按名称顺序合并为一个新的Word文件,且需保证每一次合 ...
- JZOJ 1967.【2011集训队出题】聪聪可可
题目 [2011集训队出题]聪聪可可 思路 看看做做 阴阳 这道题 极力推荐 自从做了这道题后,这些题就变成秒切的题了 很容易想到求节点到分治中心的距离,然后 \(\bmod 3\) 那么在求根节点一 ...
- JZOJ 5460. 士兵训练
题目 \(1\le n,q \le 2\cdot {10}^5,0\le b_i,l_i \le {10}^9,b_i \ge 1,1 \le S_i \le n\) \(Solution\) 这题很 ...
- [POI2011]MET-Meteors 解题报告
语言系统紊乱了 QAQ 这道题感觉不是很难鸭 qwq. 先只考虑一个国家,怎么做?很显然,就直接二分一下就行了.判定答案可以维护一个差分数组,然后最后对它做一个前缀和,再求一下这个国家的流行数量就好了 ...
- 通过 Blob 创建下载文件
Blob 如上图所示,Blob 对象有三个部分组成,data:image/jpeg 表示该 Blob 是什么类型的文件.base64 是一个二进制到文本的编码,更多细节查看Base64 编码/解码.其 ...
- RocketMQ - 消费者Rebalance机制
客户端是通过Rebalance服务做到高可靠的.当发生Broker掉线.消费者实例掉线.Topic 扩容等各种突发情况时,消费者组中的消费者实例是怎么重平衡,以支持全部队列的正常消费的呢? Rebal ...