使用Promethues和Grafana监控Flink
之前使用Influxdb储存Metrics经常会出现数据写不进去的问题,当Influxdb重启之后又能写进去,遂将数据存储部分换成Promethues,因为Flink采用PutGateway的方式,需要先将PutGateway安装好
flink1.10.0使用prometheus版本是0.3.0,我们在这里使用0.9.1的版本,如果使用最新版1.2.0会出现不兼容的问题
第一步:安装PutGateway
cd /usr/local/
wget https://github.com/prometheus/pushgateway/releases/download/v0.9.1/pushgateway-0.9.1.linux-amd64.tar.gz
tar -zxvf pushgateway-0.9.1.linux-amd64.tar.gz
nohup ./pushgateway &
第二步:配置prometheus
vi /usr/local/prometheus-2.1.0.linux-amd64/prometheus.yml 增加以下配置
  - job_name: 'flink'

    scrape_interval: 10s

    scrape_timeout: 10s

    static_configs:

      - targets: ['localhost:9091']

        labels:

          instance: 'pushgateway'
第三步:配置Flink
nohup /usr/local/prometheus-2.1.0.linux-amd64/prometheus --config.file=/usr/local/prometheus-2.1.0.linux-amd64/prometheus.yml & 启动prometheus
metrics.reporter.promgateway.class: org.apache.flink.metrics.prometheus.PrometheusPushGatewayReporter

metrics.reporter.promgateway.host: xx.xx.xx.xx

metrics.reporter.promgateway.port: 9091

metrics.reporter.promgateway.jobName: flink

metrics.reporter.promgateway.randomJobNameSuffix: true

metrics.reporter.promgateway.deleteOnShutdown: true
cd flink
cp opt/flink-metrics-prometheus-1.10.0.jar lib/
第四步:配置Grafana
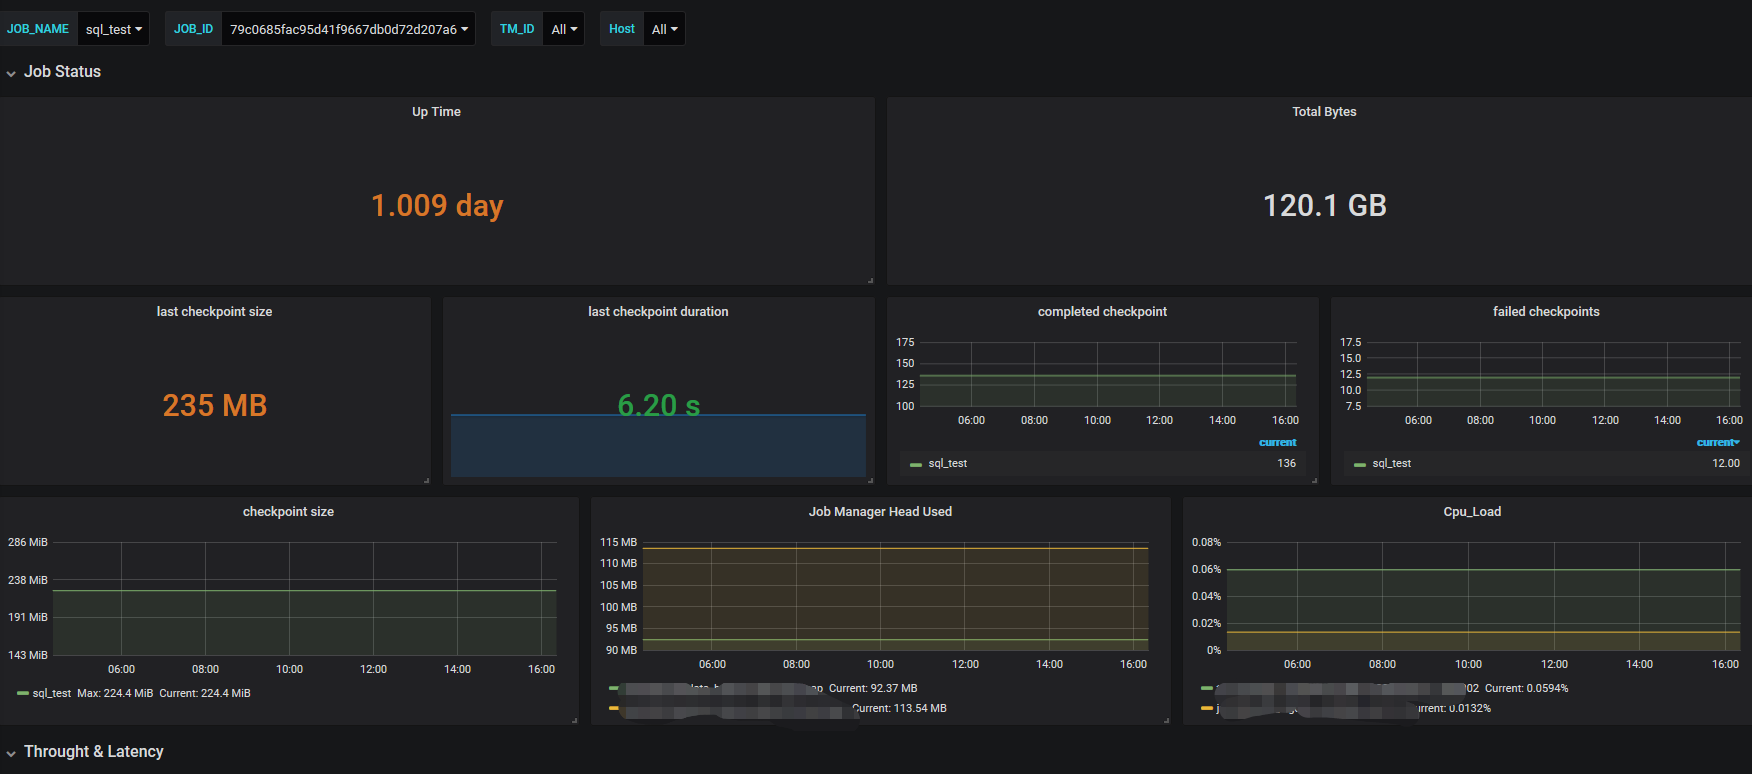
配置grafana过程比较痛苦,根据需要监控的指标进行配置,最后展示的页面和之前配置的一样
参考
https://ci.apache.org/projects/flink/flink-docs-release-1.8/monitoring/metrics.html#prometheus-orgapacheflinkmetricsprometheusprometheusreporter
https://github.com/prometheus/pushgateway/releases
https://www.cnblogs.com/huandada/p/10932953.html
使用Promethues和Grafana监控Flink的更多相关文章
- promethues exporter+ grafana 监控pg+mysql
这篇文章本来是打算使用pmm 进行数据库监控的,但是居然参考官方文档使用docker 运行起来有点问题,所以直接改用 exporter 进行处理,但是比pmm 弱好多 pmm 的参考架构 说明,以上图 ...
- 部署Prometheus+Grafana监控
Prometheus 1.不是很友好,各种配置都手写 2.对docker和k8s监控有成熟解决方案 Prometheus(普罗米修斯) 是一个最初在SoudCloud上构建的监控系统,开源项目,拥有非 ...
- Docker部署Zabbix+Grafana监控
Docker部署Zabbix+Grafana监控 环境 centos 7 ; Docker 17.12.0-ce ; docker-compose version 1.20.1 2018-4-1 当前 ...
- cAdvisor+Prometheus+Grafana监控docker
cAdvisor+Prometheus+Grafana监控docker 一.cAdvisor(需要监控的主机都要安装) 官方地址:https://github.com/google/cadvisor ...
- [转帖]Prometheus+Grafana监控Kubernetes
原博客的位置: https://blog.csdn.net/shenhonglei1234/article/details/80503353 感谢原作者 这里记录一下自己试验过程中遇到的问题: . 自 ...
- 使用Telegraf + Influxdb + Grafana 监控SQLserver服务器的运行状况
使用Telegraf + Influxdb + Grafana 监控SQLserver服务器的运行状况 前言 本文在Debian9下采用Docker的方式安装Telegraf + Influxdb + ...
- 快速接入业务监控体系,grafana监控的艺术
做一个系统,如果不做监控,是不完善的. 如果为做一个快速系统,花力气去做监控,是不值得的. 因为,我们有必要具备一个能够快速建立监控体系的能力.即使你只是一个普通开发人员! 个人觉得,做监控有三个核心 ...
- prometheus+grafana监控redis
prometheus+grafana监控redis redis安装配置 https://www.cnblogs.com/autohome7390/p/6433956.html redis_export ...
- prometheus+grafana监控mysql
prometheus+grafana监控mysql 1.安装配置MySQL官方的 Yum Repository(有mysql只需设置监控账号即可) [root@localhost ~]# wget - ...
- [转帖]安装prometheus+grafana监控mysql redis kubernetes等
安装prometheus+grafana监控mysql redis kubernetes等 https://www.cnblogs.com/sfnz/p/6566951.html plug 的模式进行 ...
随机推荐
- 【分析笔记】Linux gpio_wdt.c 看门狗设备驱动源码分析
基本原理 该看门狗的设备驱动实现原理很简单,比较主要的有两点: 一.定时器喂狗 通过定时器根据配置文件配置的喂狗方式(如脉冲切换.电平切换),对指定的 gpio 进行脉冲切换或电平切换实现喂狗. 脉冲 ...
- 用户行为分析模型实践(三)——H5通用分析模型
作者:vivo 互联网大数据团队- Zhao Wei.Tian Fengbiao.Li Xiong 本文从提升用户行为分析效率角度出发,详细介绍了H5埋点方案规划,埋点数据采集流程,提供可借鉴的用户行 ...
- 面试必问:JVM 如何确定死亡对象?
在 JVM 中,有两个非常重要的知识点,一个是 JVM 的内存布局(JVM 运行时的数据区域),另一个就是垃圾回收.而垃圾回收中又有两个重要的知识点,一个是如何确定 JVM 中的垃圾对象,另一个是使用 ...
- 懂九转大肠的微软New Bing 内测申请教程
最近微软的New Bing开放内测了,网上已经有拿到内测资格的大佬们对比了ChatGPT和New Bing.对比结果是New Bing比ChatGPT更强大.来看看具体对比例子吧 1.时效性更强 Ch ...
- IoT 边缘集群基于 Kubernetes Events 的告警通知实现(二):进一步配置
上一篇文章 IoT 边缘集群基于 Kubernetes Events 的告警通知实现 目标 告警恢复通知 - 经过评估无法实现 原因: 告警和恢复是单独完全不相关的事件, 告警是 Warning 级别 ...
- 使用brew安装历史版本的几种方式
背景 在 mac osx 下, 大部分的软件都是使用 homebrew 进行管理的, 可以方便的进行软件的安装,更新,删除等等, 大部分情况下 homebrew 的仓库只会存在一份最新的软件版本, 有 ...
- java基础(完整版)
java javaSE 注释: block块级 line 行 标识符和关键字 组成部分.变量名.类名.方法名--------标识符 $\数字._\字母 数据类型 强类型语言---安全性高--速度会慢 ...
- vue3+element表格数据导出
实现效果 导出后的效果: 步骤 第一步:安装依赖 npm install --save xlsx file-saver 第二步:给表格添加id,导出的时候需要用到 <!-- 导出按钮 --> ...
- [USACO06NOV] Round Numbers S
题目 \(\texttt{[USACO06NOV] Round Numbers S}\) 分析 数位 \(dp\) 入门题 一般我们需要当前位置 \(pos\),有无前导零 \(lead\),高位标记 ...
- XAMPP环境下数据库密码保存文件目录(数据库密码忘记)
转自百度经验: https://jingyan.baidu.com/article/09ea3ede4e2523c0afde3943.html ---------------------------- ...