ELK 二进制安装并收集nginx日志
对于日志来说,最常见的需求就是收集、存储、查询、展示,开源社区正好有相对应的开源项目:logstash(收集)、elasticsearch(存储+搜索)、kibana(展示),我们将这三个组合起来的技术称之为ELKStack,所以说ELKStack指的是Elasticsearch(java)、Logstash(jruby)、Kibana技术栈的结合,
ELK5.X搭建并收集Nginx日志
ELK
- ELK5.X搭建并收集Nginx日志一、基础环境配置及软件包下载
- 二、安装Elasticsearch
- 三、安装logstash
- 四、安装Kibana
- 五、安装并配置Nginx收集日志
- 六、Elasticsearch Head插件安装
ELK Stack 是 Elasticsearch、Logstash、Kibana 三个开源软件的组合。在实时数据检索和分析场合,三者通常是配合共用,而且又都先后归于 Elastic.co 公司名下,故有此简称。
ELK Stack 在最近两年迅速崛起,成为机器数据分析,或者说实时日志处理领域,开源界的第一选择。和传统的日志处理方案相比,ELK Stack 具有如下几个优点:
• 处理方式灵活。Elasticsearch 是实时全文索引,不需要像 storm 那样预先编程才能使用;
• 配置简易上手。Elasticsearch 全部采用 JSON 接口,Logstash 是 Ruby DSL 设计,都是目前业界最通用的配置语法设计;
• 检索性能高效。虽然每次查询都是实时计算,但是优秀的设计和实现基本可以达到全天数据查询的秒级响应;
• 集群线性扩展。不管是 Elasticsearch 集群还是 Logstash 集群都是可以线性扩展的;
• 前端操作炫丽。Kibana 界面上,只需要点击鼠标,就可以完成搜索、聚合功能,生成炫丽的仪表板。
ELK地址:https://www.elastic.co/
Logstash 最佳实践:http://udn.yyuap.com/doc/logstash-best-practice-cn/index.html
更多ELK文章:https://www.i4t.com/category/elkstack/
对于日志来说,最常见的需求就是收集、存储、查询、展示,开源社区正好有相对应的开源项目:logstash(收集)、elasticsearch(存储+搜索)、kibana(展示),我们将这三个组合起来的技术称之为ELKStack,所以说ELKStack指的是Elasticsearch(java)、Logstash(jruby)、Kibana技术栈的结合,一个通 用的架构如下图所示:
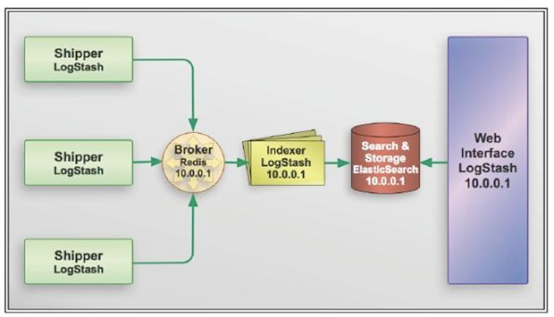
图片解释:elk 前面主要靠logstash来进行收集日志,logstash将日志上传到broker上,后面还有一个logstash用来读取broker中的日志,在将日志存储到es里面,最后用kibana练到es上进行展示
提示:我们可以将Elasticsearch简称为es
1.Elasticsearch介绍
ElasticSearch是一个基于Lucene的搜索服务器。它提供了一个分布式多用户能力的全文搜索引擎,基于RESTful web接口。Elasticsearch是用Java开发的,并作为Apache许可条款下的开放源码发布,是第二流行的企业搜索引擎。设计用于云计算中,能够达到实时搜索,稳定,可靠,快速,安装使用方便。
2.Logstash介绍
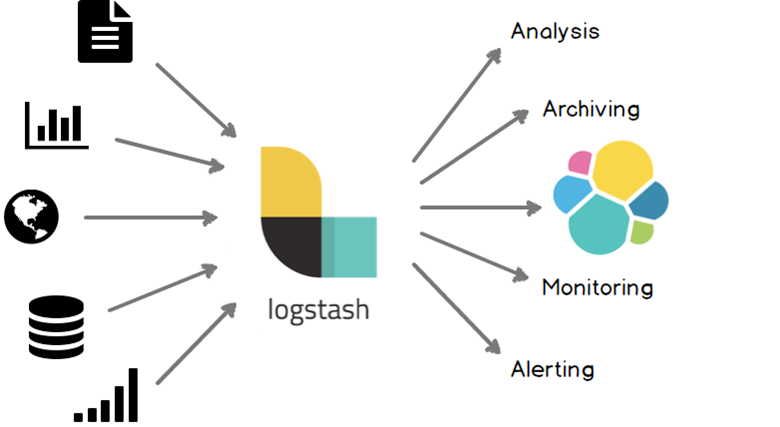
Logstash是一个完全开源的工具,他可以对你的日志进行收集、分析,并将其存储供以后使用(如,搜索),您可以使用它。说到搜索,logstash带有一个web界面,搜索和展示所有日志。
kibana也是一个开源和免费的工具,他可以帮助您汇总、分析和搜索重要数据日志并提供友好的web界面。他可以为 Logstash 和 ElasticSearch 提供的日志分析的 Web 界面。
提示:logstash与es没有任何关系
ELK几个概念
INPUT  进

FILTER  (支持过滤的功能)

OUTPUT 出
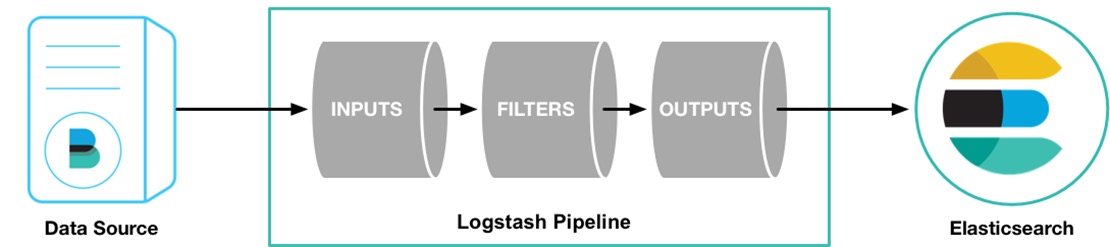
首先LogStash是收集日志,它收集完日志就需要把日志存储下来,所以我们可以用运输者的身份来表示LogStash(INPUT or OUTPUT)LogStash可以在日志发送之前做一个过滤(OUTPUT之前)
3.Kibana简介
Kibana是为 Elasticsearch 设计的开源分析和可视化平台。你可以使用 Kibana 来搜索,查看存储在 Elasticsearch 索引中的数据并与之交互。你可以很容易实现高级的数据分析和可视化,以图表的形式展现出来。
Kibana版本使用php、ruby、js、jruby、node.js等不同语言编写
Kibana 4使用nodejs进行编写(nodejs号称全栈,什么都可以干)
本段文章截取https://www.i4t.com/category/elkstack/

温馨提示:本次搭建属于单点,不算是集群。集群搭建只需要改相关的配置文件重启即可
环境 CentOS Linux release 7.4.1708 (Core)

版本

elasticsearch-5.5.0.tar.gz

kibana-5.5.0-linux-x86_64.tar.gz

logstash-5.5.0.tar.gz

主机

10.4.11.11   Elasticsearch  Kibana

10.4.11.12   logstash nginx

如果Nginx和elk都在一台,可以都安装在一台服务器上!

环境配置

#时间同步

#关闭selinux 及防火墙

#内核优化
一、基础环境配置及软件包下载
 1.设置yum源

 curl -o /etc/yum.repos.d/CentOS-Base.repo http://mirrors.aliyun.com/repo/Centos-7.repo

 wget -O /etc/yum.repos.d/epel.repo http://mirrors.aliyun.com/repo/epel-7.repo

 yum makecache

 yum install wget vim lsof net-tools lrzsz -y

 2.时间同步

 yum -y install ntp

 systemctl enable ntpd

 systemctl start ntpd

 ntpdate -u cn.pool.ntp.org

 hwclock --systohc

 timedatectl set-timezone Asia/Shanghai

 3.关闭Selinux && 防火墙

 systemctl stop firewalld

 systemctl disable firewalld

 setenforce 0

 sed -i '/SELINUX/s/enforcing/disabled/' /etc/selinux/config

4.内核优化

echo '

* hard nofile 65536

* soft nofile 65536

* soft nproc  65536

* hard nproc  65536

'>>/etc/security/limit.conf

echo '

vm.max_map_count = 262144

net.core.somaxconn=65535

net.ipv4.ip_forward = 1

'>>/etc/sysctl.conf

sysctl -p
下载软件包
mkdir /root/elk

Elasticsearch:

wget https://artifacts.elastic.co/downloads/elasticsearch/elasticsearch-5.5.0.tar.gz

Kibana:

wget https://artifacts.elastic.co/downloads/kibana/kibana-5.5.0-linux-x86_64.tar.gz

Logstash:

wget https://artifacts.elastic.co/downloads/logstash/logstash-5.5.0.tar.gz
安装Jdk环境
1.源码安装

下载安装http://www.oracle.com/technetwork/java/javase/downloads/jdk8-downloads-2133151.html

配置Java环境

tar zxf jdk-8u91-linux-x64.tar.gz -C /usr/local/

ln –s /usr/local/jdk1.8.0_91 /usr/local/jdk

vim /etc/profile

export JAVA_HOME=/usr/local/jdk

export CLASSPATH=.:$JAVA_HOME/lib/dt.jar:$JAVA_HOME/lib/tools.jar

export PATH=$JAVA_HOME/bin:$PATH

source /etc/profile

看到如下信息,java环境配置成功

# java -version

java version "1.8.0_91"

Java(TM) SE Runtime Environment (build 1.8.0_91-b14)

Java HotSpot(TM) 64-Bit Server VM (build 25.91-b14, mixed mode)

2.yum安装

yum install -y java

[root@i4t.com ~]# java -version

openjdk version "1.8.0_65"

OpenJDK Runtime Environment (build 1.8.0_65-b17)

OpenJDK 64-Bit Server VM (build 25.65-b01, mixed mode)
二、安装Elasticsearch
我们elk都使用普通用户进行启动管理
新建持久化目录及logo目录

mkdir /data1/{es-data,es-logs} -p

tar xf elasticsearch-5.5.0.tar.gz -C /usr/local/

ln -s /usr/local/elasticsearch-5.5.0 /usr/local/elasticsearch

修改配置文件,修改后如下

grep -Ev "^$|#" /usr/local/elasticsearch-5.5.0/config/elasticsearch.yml

node.name: my-es

path.data: /data1/es-data

path.logs: /data1/es-logs

http.host: "10.4.82.217"

http.cors.enabled: true

http.cors.allow-origin: "*"

第一次安装需要注释config.reload参数

配置说明

node.name: my-es          #设置节点名称,一般写主机名

path.data: /data1/es-data    #创建logstash 和插件使用的持久化目录

path.logs: /data1/es-logs   #创建es日志路径

http.host: "10.4.82.217"    #定义访问主机名,一般为域名或IP

http.cors.enabled: true     #使用head插件需要开启

http.cors.allow-origin: "*"

更多配置说明:https://blog.csdn.net/ma_shou_feng/article/details/83783213
在运行es之前,我们需要创建用户,设置属主属组
useradd elk

chown -R elk /data1/es-*

[root@i4t.com ~]# ll /data1/

总用量 32

drwxr-xr-x  2 elk  root  4096 1月  25 04:48 es-data

drwxr-xr-x  2 elk  root  4096 1月  25 04:48 es-logs

drwxr-xr-x  3 root root  4096 8月  24 20:17 etcd

drwxr-xr-x  2 root root  4096 8月  16 11:41 kubelet

drwx------. 2 root root 16384 7月  13 2018 lost+found

设置es服务

chown -R elk /usr/local/elasticsearch-5.5.0/

[root@i4t.com local]# ll /usr/local/elasticsearch-5.5.0/

总用量 236

drwxr-xr-x  2 elk root   4096 1月  25 04:49 bin

drwxr-xr-x  2 elk root   4096 1月  25 04:54 config

drwxr-xr-x  2 elk root   4096 7月   1 2017 lib

-rw-r--r--  1 elk root  11358 7月   1 2017 LICENSE.txt

drwxr-xr-x 13 elk root   4096 7月   1 2017 modules

-rw-r--r--  1 elk root 194187 7月   1 2017 NOTICE.txt

drwxr-xr-x  2 elk root   4096 7月   1 2017 plugins

-rw-r--r--  1 elk root   9548 7月   1 2017 README.textile
启动es服务
启动之前需要su到普通用户上

[root@i4t.com ~]# su - elk

[elk@i4t.com ~]$ /usr/local/elasticsearch/bin/elasticsearch -d

# -d 参数为后台启动,第一次安装好可以不加-d先启动测试,查看是否有error或者报错
前台查看启动成功,我们就可以加上-d参数让它后台运行
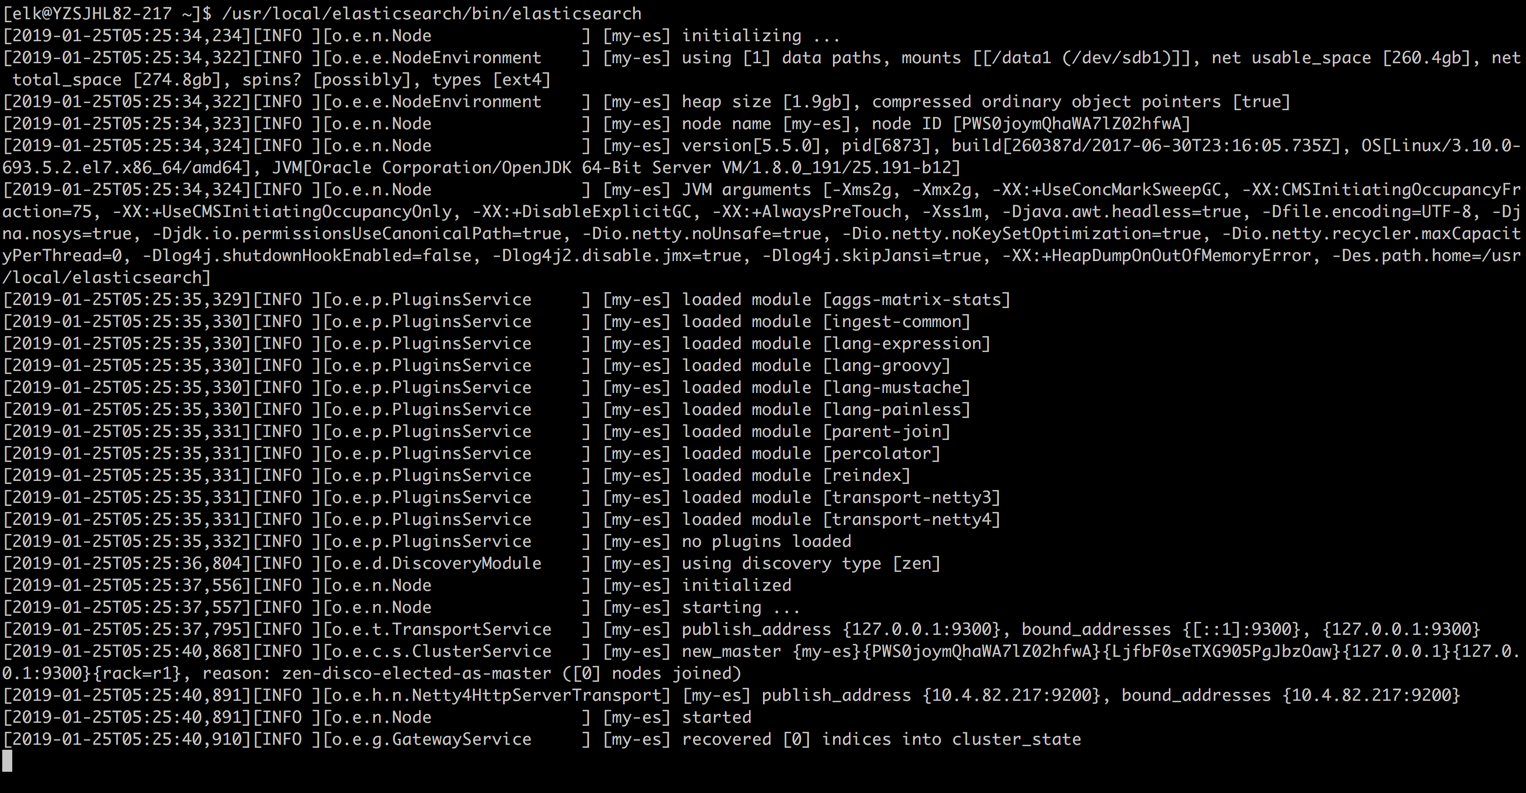
检查是否启动成功
[elk@i4t ~]$ /usr/local/elasticsearch/bin/elasticsearch -d

[elk@i4t~]$ lsof -i:9200

COMMAND  PID USER   FD   TYPE    DEVICE SIZE/OFF NODE NAME

java    7157  elk  312u  IPv6 391237534      0t0  TCP node1:wap-wsp (LISTEN)

[elk@i4t ~]$ curl 10.4.82.217:9200

{

  "name" : "my-es",

  "cluster_name" : "elasticsearch",

  "cluster_uuid" : "tXBJMwRhQUyPNrwKETCWgg",

  "version" : {

    "number" : "5.5.0",

    "build_hash" : "260387d",

    "build_date" : "2017-06-30T23:16:05.735Z",

    "build_snapshot" : false,

    "lucene_version" : "6.6.0"

  },

  "tagline" : "You Know, for Search"

}
Elasticsearch常用命令
curl -XDELETE 'http://host.IP.address:9200/logstash-*'  删除索引(后面为索引名称)

curl -XGET 'host.IP.address:9200/_cat/health?v&pretty'  查看集群状态

curl -XGET 'host.IP.address:9200/_cat/indices?v&pretty'    查看索引
三、安装logstash
logstash安装的Nginx服务器上,并非es服务器
1.解压安装logstash

tar xf logstash-5.5.0.tar.gz -C /usr/local/

ln -s /usr/local/logstash-5.5.0 /usr/local/logstash

一般情况下,我们可以不配置logstash直接就可以启动,logstash下有一个叫logstash.yml的文件,里面可以对logstash做一些简单的优化

vim /usr/local/logstash/config/logstash.yml

config.reload.automatic: true    #开启配置文件自动加载

config.reload.interval: 10    #定义配置文件重载时间周期

可以添加也可以不添加!

2.创建配置文件

mkdir /usr/local/logstash/conf/

vim /usr/local/logstash/conf/nginx.conf

input {

    file {

        path => "/usr/local/nginx/logs/access.log"

        start_position => "beginning"

        }

}

filter {

}

output {

        #stdout { codec=> rubydebug }

    elasticsearch {

        hosts => ["10.4.82.118:9200"]

        index => "static_nginx_access-%{+YYYY.MM.dd}"

 }

}

#这里面实际只是定义了一个nginx log路径

#stdout { codec=> rubydebug }  将内容打印出来,方便测试

#host 填写es主机

index 索引名称
四、安装Kibana
wget https://artifacts.elastic.co/downloads/kibana/kibana-5.5.0-linux-x86_64.tar.gz

tar xf kibana-5.5.0-linux-x86_64.tar.gz -C /usr/local/

chown -R elk.elk kibana-5.5.0-linux-x86_64

kibana配置文件修改

[root@YZSJHL82-217 ~]# vim /usr/local/kibana-5.5.0-linux-x86_64/config/kibana.yml

server.port: 5601

server.host: "10.4.82.217"

elasticsearch.url: "http:/10.4.82.203:9200"

[root@i4t ~]# grep -Ev "^$|#" /usr/local/kibana-5.5.0-linux-x86_64/config/kibana.yml

server.port: 5601             #kibana端口

server.host: "10.4.82.217"    #kibana主机

elasticsearch.url: "http://127.0.0.1:9200"   #ES服务器端口,ES配置写的IP是那个这里就要连接哪个ip

启动

[root@i4t ~]# su - elk

前台启动

[elk@i4t kibana-5.5.0-linux-x86_64]$ /usr/local/kibana-5.5.0-linux-x86_64/bin/kibana

后台启动

[elk@i4t kibana-5.5.0-linux-x86_64]$ /usr/local/kibana-5.5.0-linux-x86_64/bin/kibana &

温馨提示:可以先前台启动查看日志,正常之后在后台启动

查看端口

[root@i4t ~]# lsof -i:5601

COMMAND   PID USER   FD   TYPE    DEVICE SIZE/OFF NODE NAME

node    30297  elk   12u  IPv4 420317733      0t0  TCP node1:esmagent (LISTEN)

[root@i4t ~]# netstat -lntup|grep 5601

tcp        0      0 10.4.82.217:5601        0.0.0.0:*               LISTEN      30297/node
访问kibana
因为现在没有数据,我们现在配置Nginx进行Nginx的日志收集
五、安装并配置Nginx收集日志
安装Nginx
wget http://nginx.org/download/nginx-1.10.3.tar.gz

yum install -y gcc glibc gcc-c++ prce-devel openssl-devel pcre-devel

useradd -s /sbin/nologin www -M

tar xf nginx-1.10.3.tar.gz && cd nginx-1.10.3

./configure --prefix=/usr/local/nginx-1.10.3 --user=www --group=www --with-http_ssl_module --with-http_stub_status_module

make && make install

ln -s /usr/local/nginx-1.10.3 /usr/local/nginx

手动启动

/usr/local/nginx/sbin/nginx

设置开机启动

echo "/usr/local/nginx/sbin/nginx" >>/etc/rc.local

查看服务器是否启动

netstat -lntp|grep nginx

    tcp        0      0 0.0.0.0:80              0.0.0.0:*               LISTEN      7058/nginx: master
需要配置在我们要收集的服务器上
vim /usr/local/nginx/conf/nginx.conf

worker_processes  1;

events {

    worker_connections  1024;

}

http {

    include       mime.types;

    default_type  application/octet-stream;

    #log_format  main  '$remote_addr - $remote_user [$time_local] "$request" '

    #                  '$status $body_bytes_sent "$http_referer" '

    #                  '"$http_user_agent" "$http_x_forwarded_for"';

    log_format json '{"@timestamp":"$time_iso8601",'

                  '"host":"$server_addr",'

                  '"clientip":"$remote_addr",'

                  '"remote_user":"$remote_user",'

                  '"request":"$request",'

                  '"http_user_agent":"$http_user_agent",'

                  '"size":$body_bytes_sent,'

                  '"responsetime":$request_time,'

                  '"upstreamtime":"$upstream_response_time",'

                  '"upstreamhost":"$upstream_addr",'

                  '"http_host":"$host",'

                  '"requesturi":"$request_uri",'

                  '"url":"$uri",'

                  '"domain":"$host",'

                  '"xff":"$http_x_forwarded_for",'

                  '"referer":"$http_referer",'

                  '"status":"$status"}';

    access_log logs/access.log json;

    sendfile        on;

    keepalive_timeout  65;

    server {

        listen       80;

        server_name  localhost;

        location / {

            root   html;

            index  index.html index.htm;

        }

    }

}

###########################

实际上就是添加了json格式的日志

    log_format json '{"@timestamp":"$time_iso8601",'

                  '"host":"$server_addr",'

                  '"clientip":"$remote_addr",'

                  '"remote_user":"$remote_user",'

                  '"request":"$request",'

                  '"http_user_agent":"$http_user_agent",'

                  '"size":$body_bytes_sent,'

                  '"responsetime":$request_time,'

                  '"upstreamtime":"$upstream_response_time",'

                  '"upstreamhost":"$upstream_addr",'

                  '"http_host":"$host",'

                  '"requesturi":"$request_uri",'

                  '"url":"$uri",'

                  '"domain":"$host",'

                  '"xff":"$http_x_forwarded_for",'

                  '"referer":"$http_referer",'

                  '"status":"$status"}';

    access_log logs/access.log json;

日志保存在/usr/local/nginx/logs/下
配置完成后,访问nginx。查看日志是否修改为json
[root@i4tnginx]# tail -f logs/access.log

{"@timestamp""host":"10.4.82.203","clientip":"10.2.52.15","remote_user":"-","request":"GET / HTTP/1.1","http_user_agent":"Mozilla/5.0 (Macintosh; Intel Mac OS X 10.13; rv:60.0) Gecko/20100101 Firefox/60.0","size":0,"responsetime":0.000,"upstreamtime":"-","upstreamhost":"-","http_host":"10.4.82.203","requesturi":"/","url":"/index.html","domain":"10.4.82.203","xff":"-","referer":"-","status":"304"}

{"@timestamp""host":"10.4.82.203","clientip":"10.2.52.15","remote_user":"-","request":"GET / HTTP/1.1","http_user_agent":"Mozilla/5.0 (Macintosh; Intel Mac OS X 10.13; rv:60.0) Gecko/20100101 Firefox/60.0","size":0,"responsetime":0.000,"upstreamtime":"-","upstreamhost":"-","http_host":"10.4.82.203","requesturi":"/","url":"/index.html","domain":"10.4.82.203","xff":"-","referer":"-","status":"304"}
测试logstash配置文件是否正常
我们尽量都是用elk用户,所以需要提前将logstash设置为elk的属主属组

chown -R elk.elk /usr/local/logstash

/usr/local/logstash/bin/logstash -f /usr/local/logstash/conf/nginx.conf  -t

ERROR StatusLogger No log4j2 configuration file found. Using default configuration: logging only errors to the console.

Sending Logstash's logs to /usr/local/logstash/logs which is now configured via log4j2.properties

Configuration OK

[2019-01-28T11:54:38,481][INFO ][logstash.runner          ] Using config.test_and_exit mode. Config Validation Result: OK. Exiting Logstash
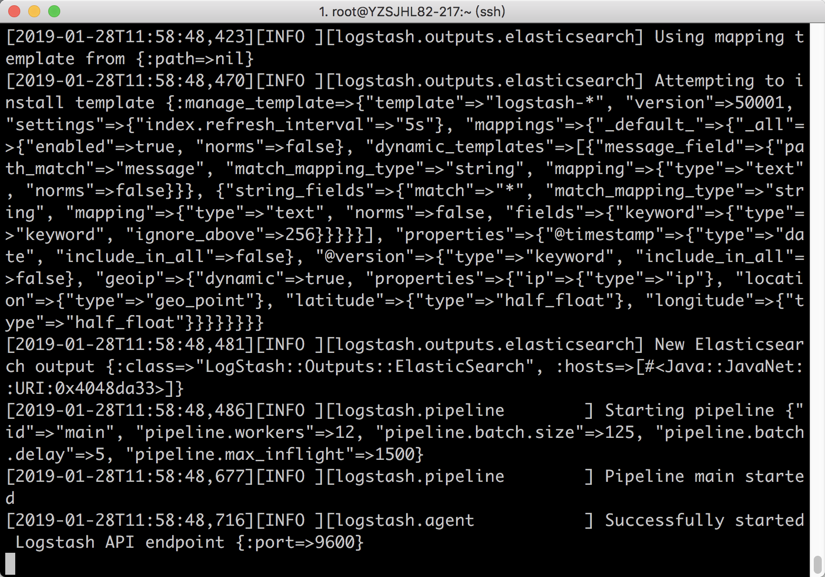
在Nginx服务器上启动logstash
[root@abcdocker logstash]# su - elk

[elk@abcdocker ~]$ /usr/local/logstash/bin/logstash -f /usr/local/logstash/conf/nginx.conf

温馨提示,一定要确保logs目录elk有权限写入,建议我们在启动elk之前在执行一次chown -R elk.elk /usr/local/logstash
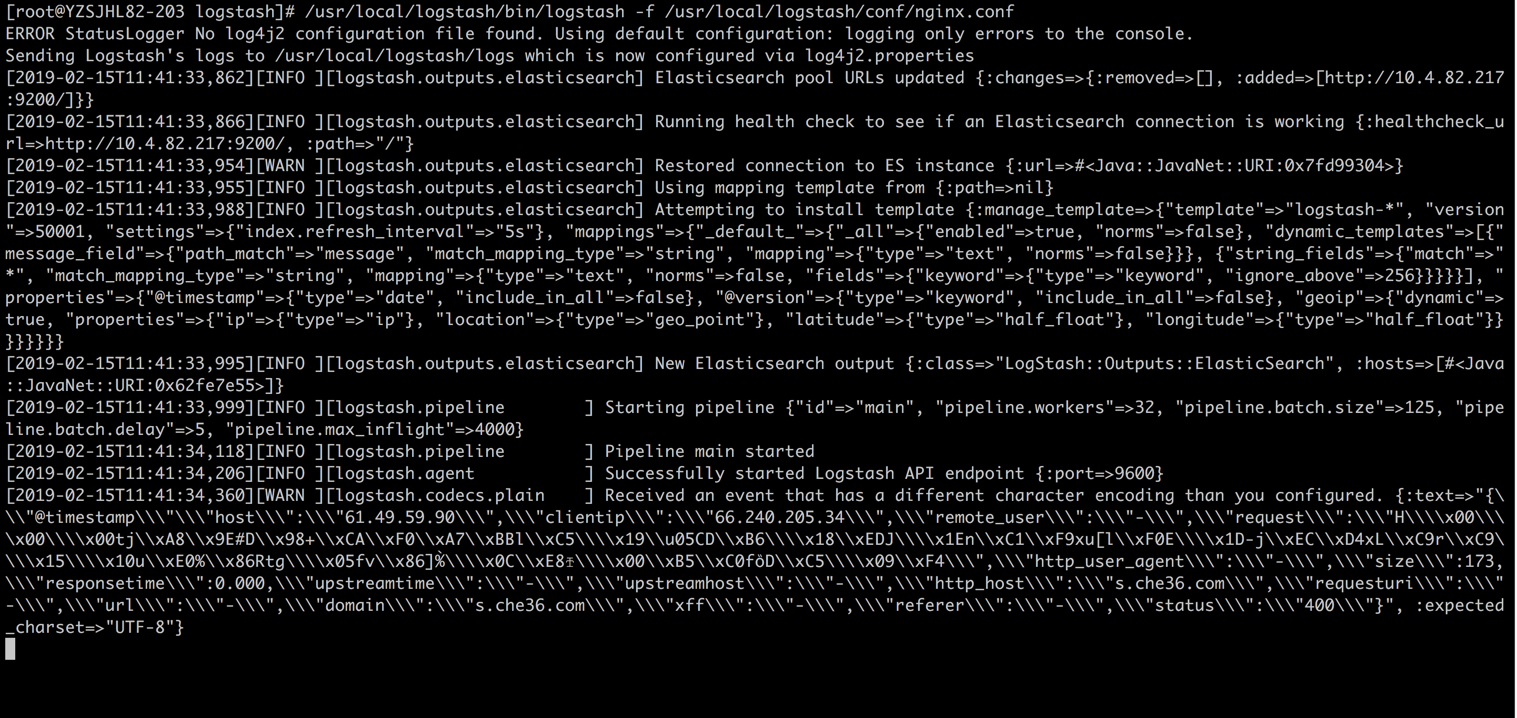
请确保logstash中的file文件有读取权限,否则无法在ES中创建索引!
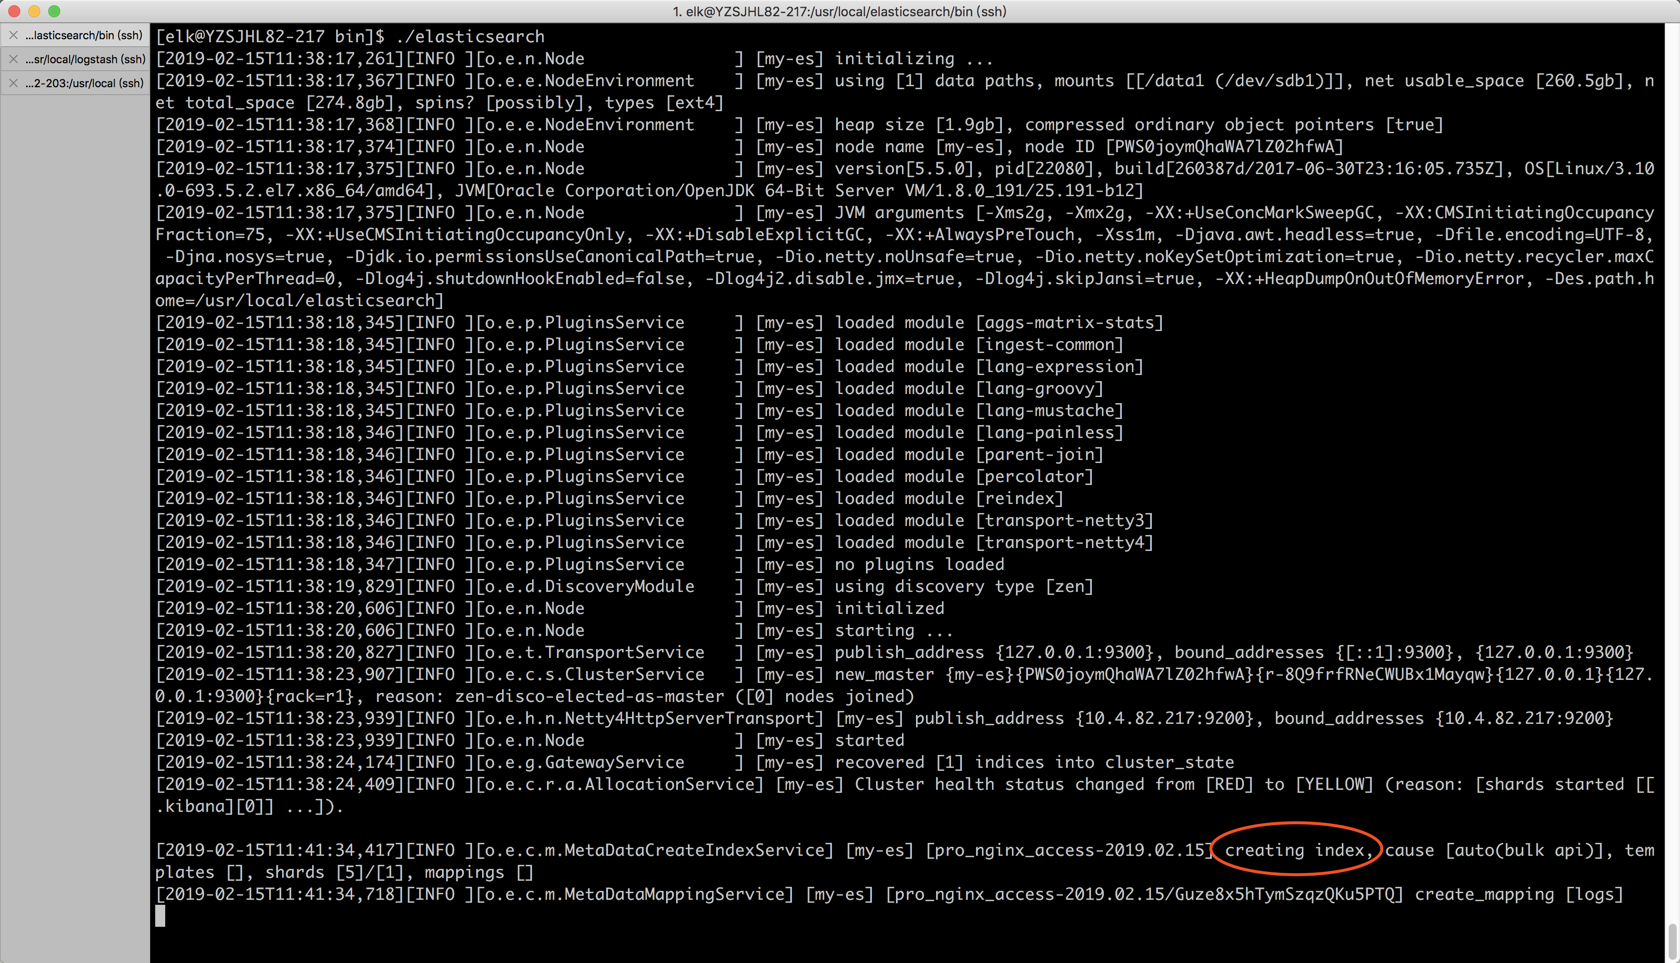
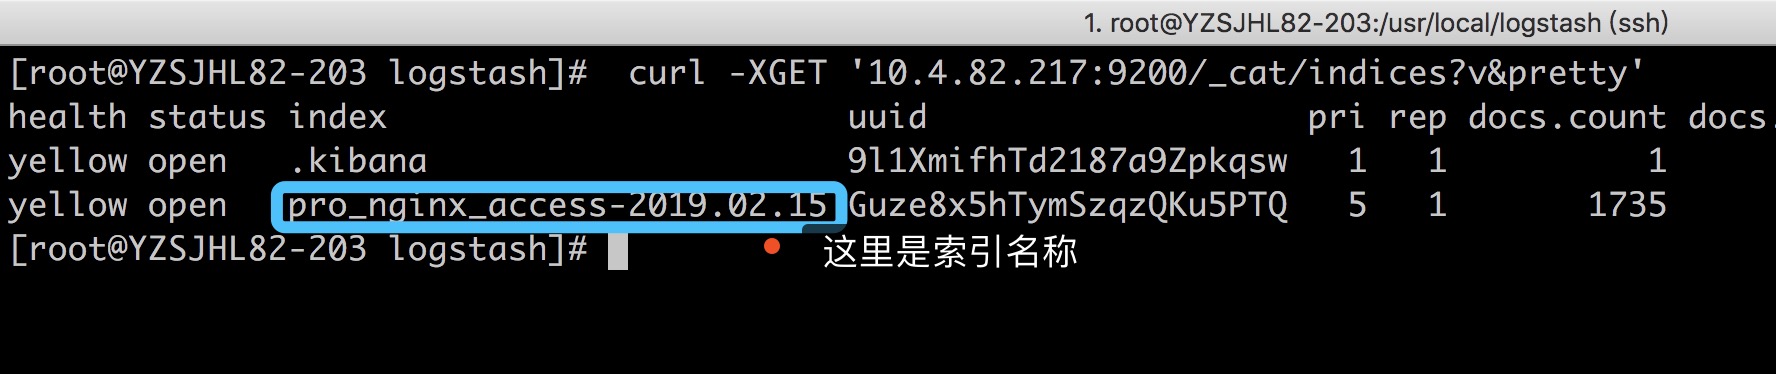
我们可以查一下索引
[root@YZSJHL82-203 local]# curl -XGET '10.4.82.217:9200/_cat/indices?v&pretty'

health status index                       uuid                   pri rep docs.count docs.deleted store.size pri.store.size

yellow open   .kibana                     9l1XmifhTd2187a9Zpkqsw   1   1          1            0      3.2kb          3.2kb

yellow open   pro_nginx_access-2019.02.15 Guze8x5hTymSzqzQKu5PTQ   5   1       1315            0      1.3mb          1.3mb
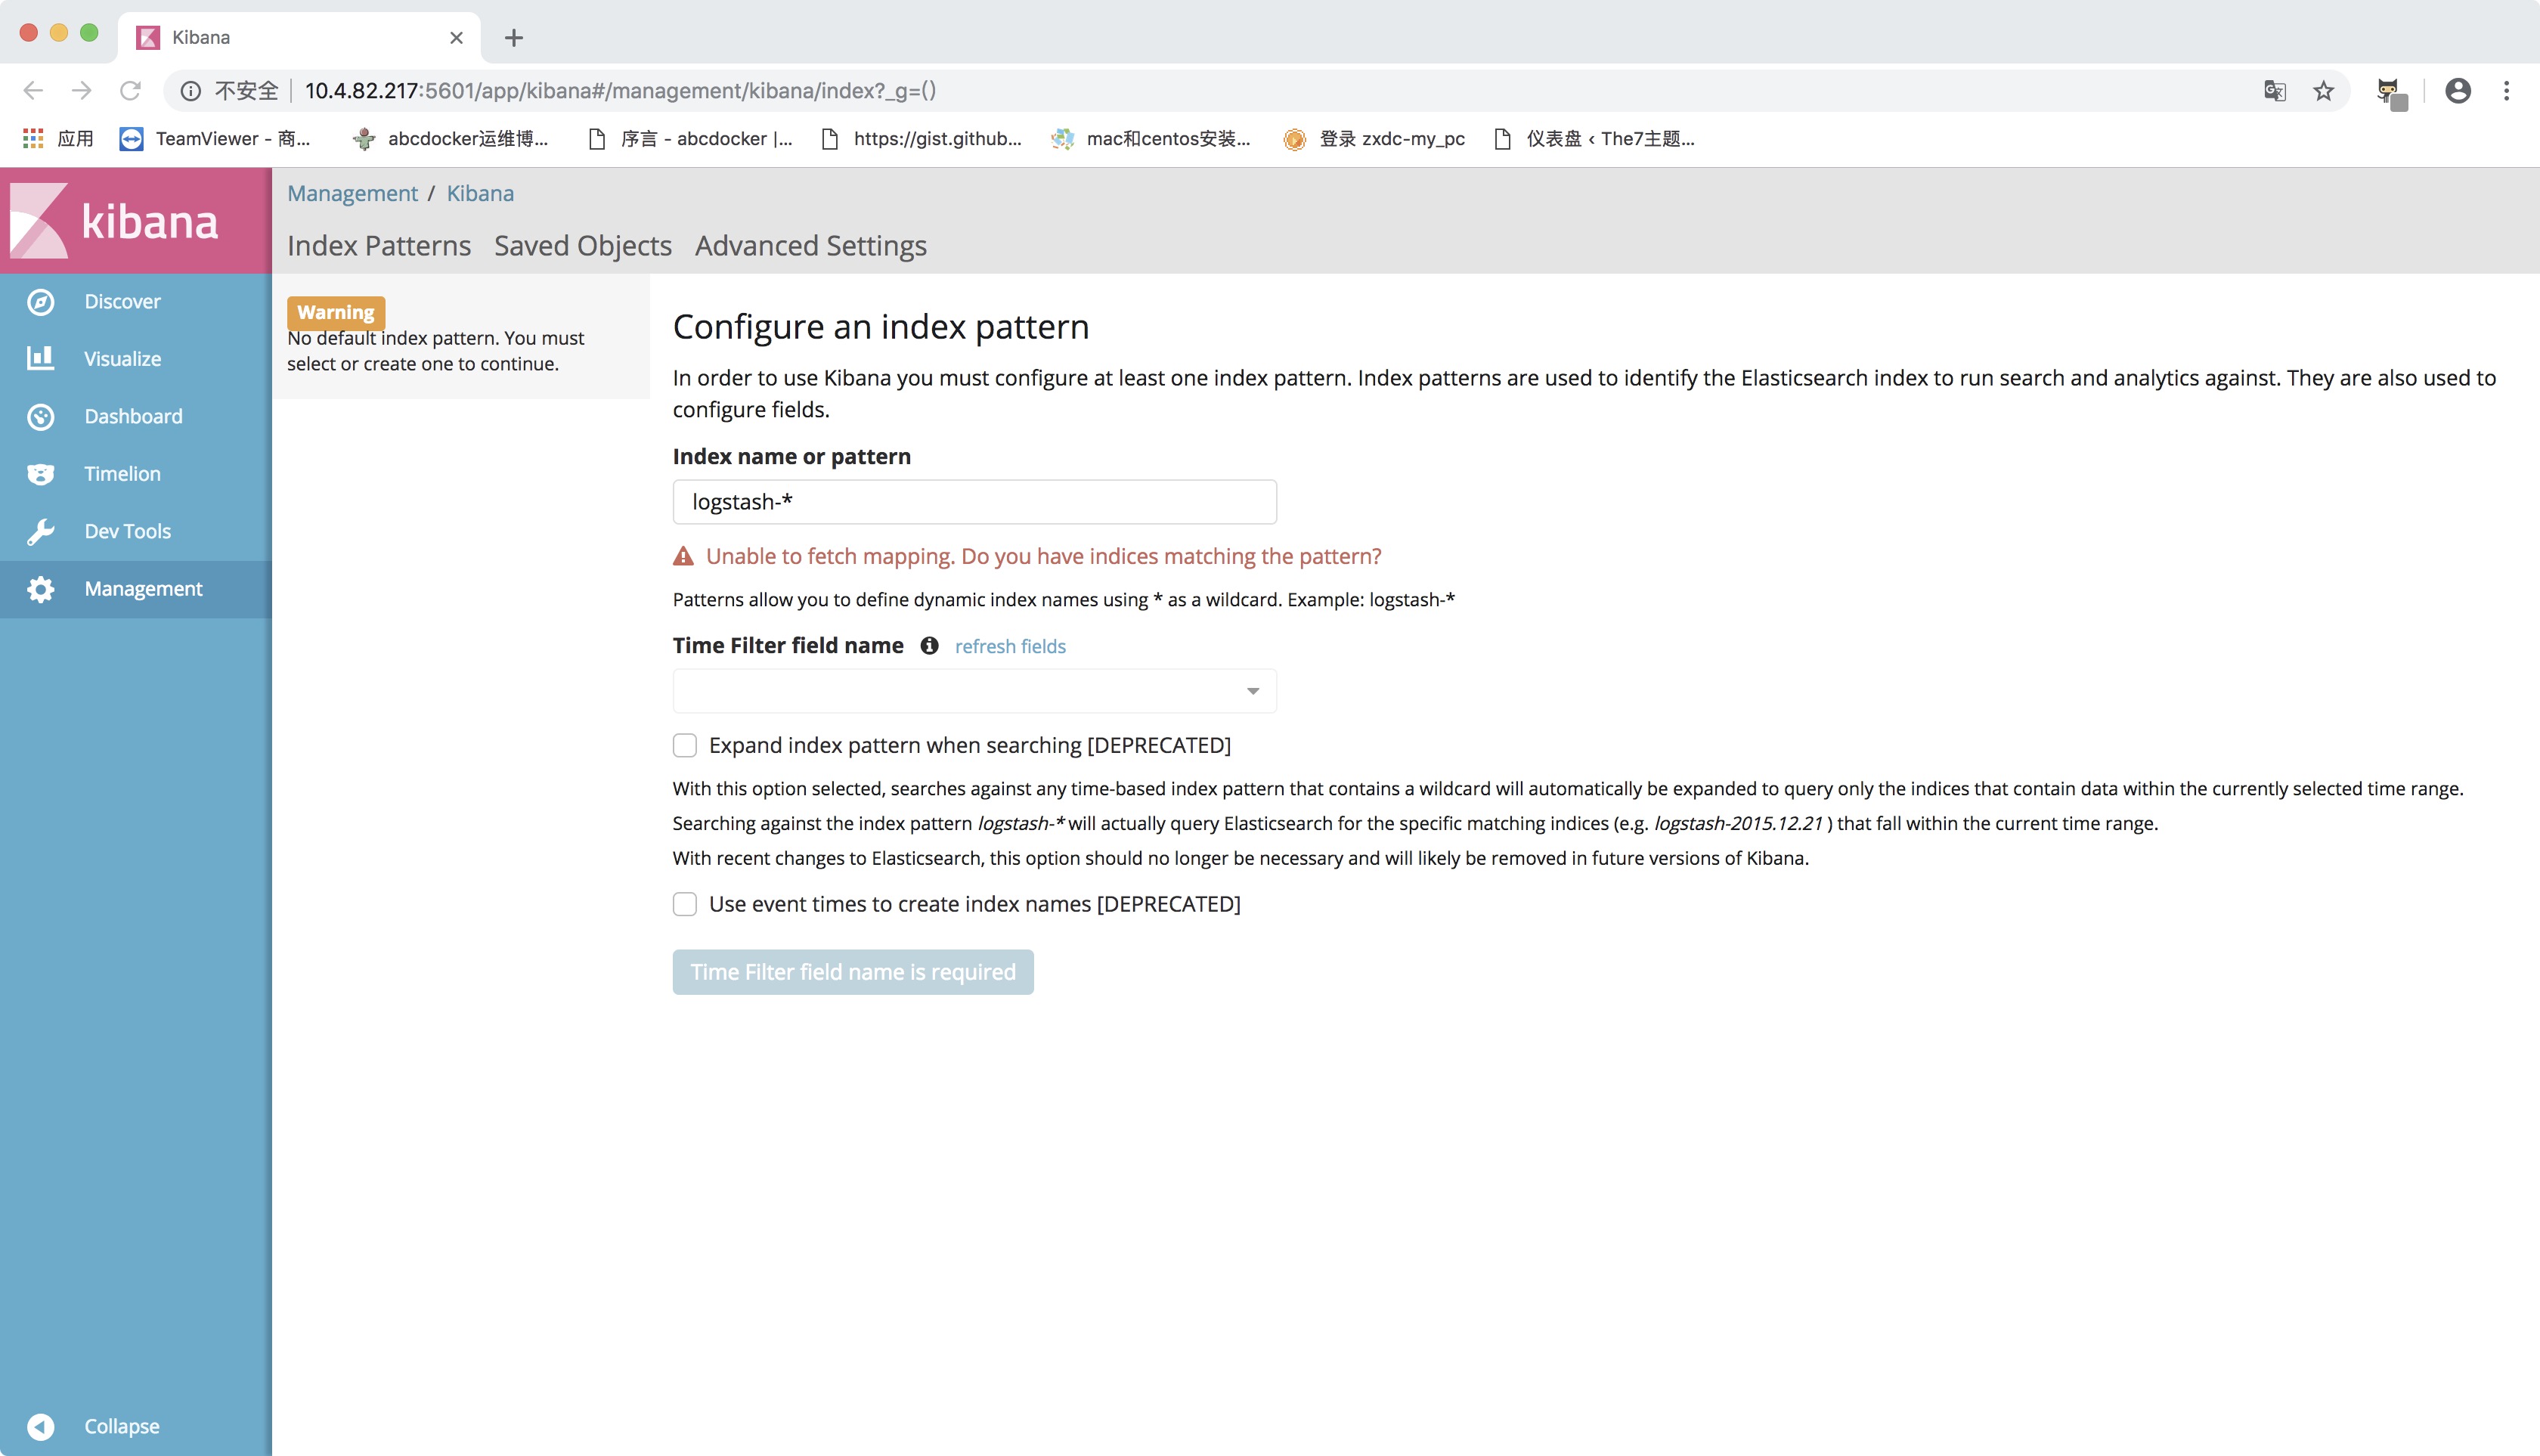
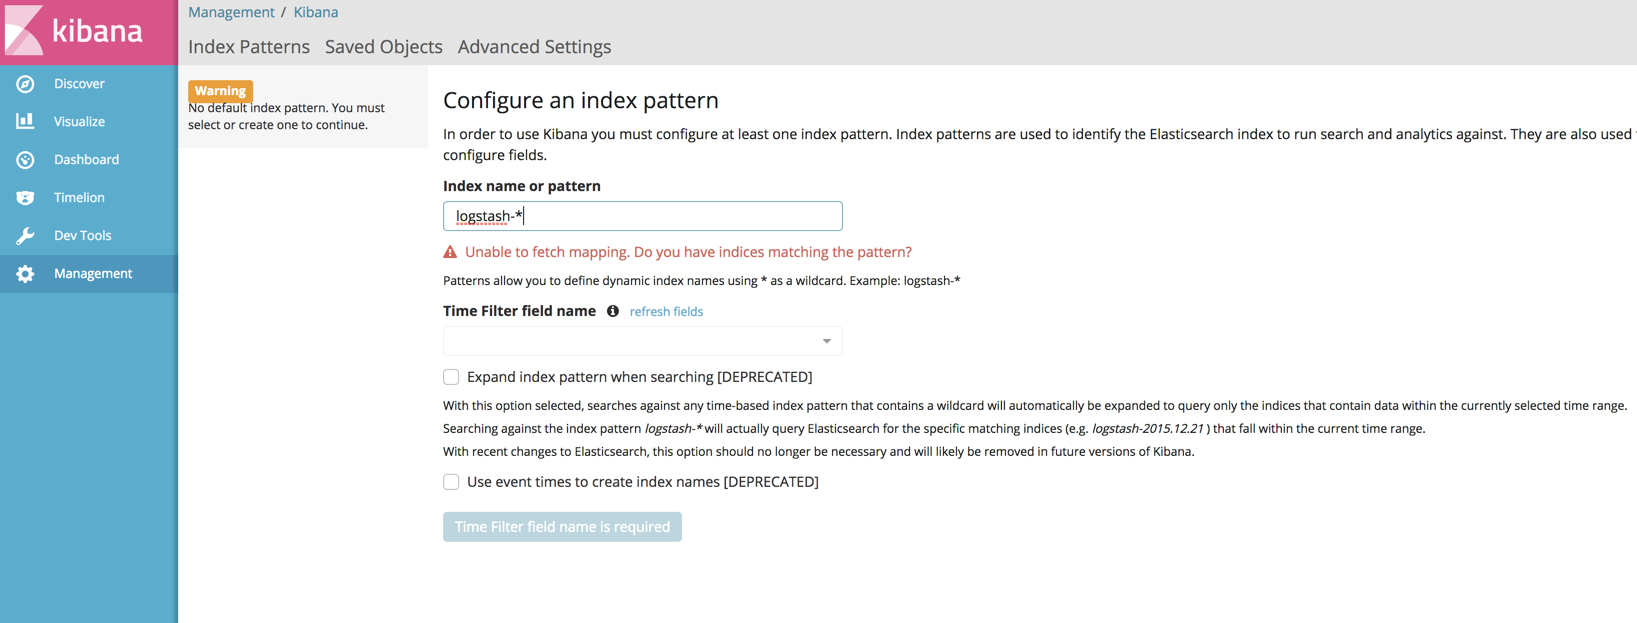
Kibana 配置
目前logstash已经将收集的日志存储在es里面,我们需要用kibana进行展示
查看索引命令
[root@YZSJHL82-203 local]# curl -XGET '10.4.82.217:9200/_cat/indices?v&pretty'

health status index                       uuid                   pri rep docs.count docs.deleted store.size pri.store.size

yellow open   .kibana                     9l1XmifhTd2187a9Zpkqsw   1   1          1            0      3.2kb          3.2kb

yellow open   pro_nginx_access-2019.02.15 Guze8x5hTymSzqzQKu5PTQ   5   1       1315            0      1.3mb          1.3mb
Kibana创建索引
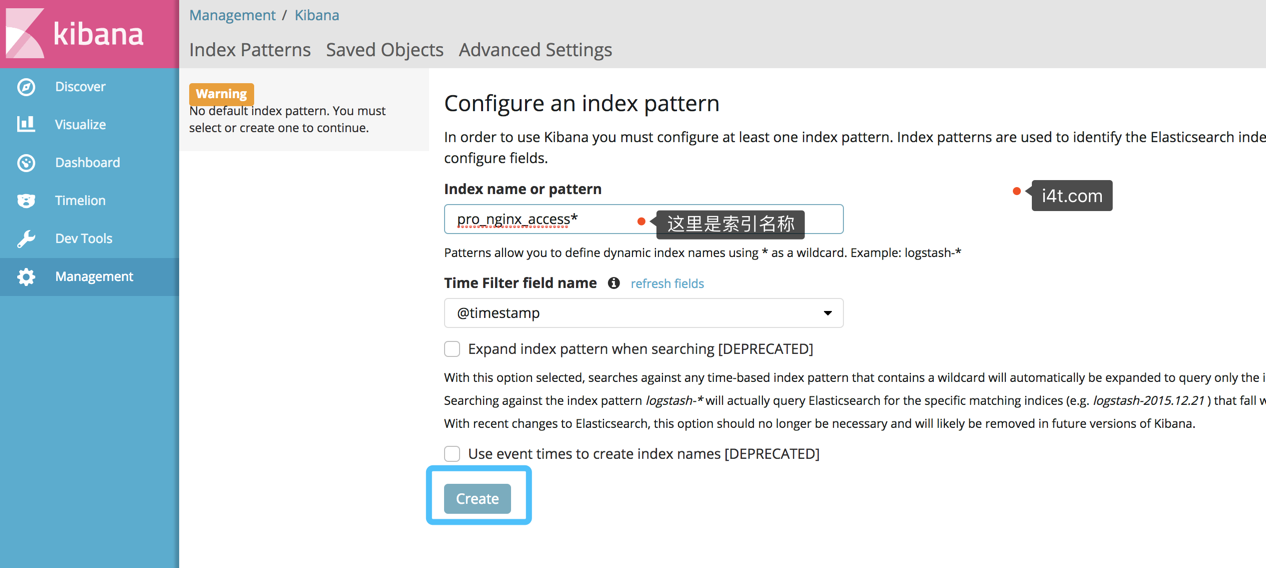
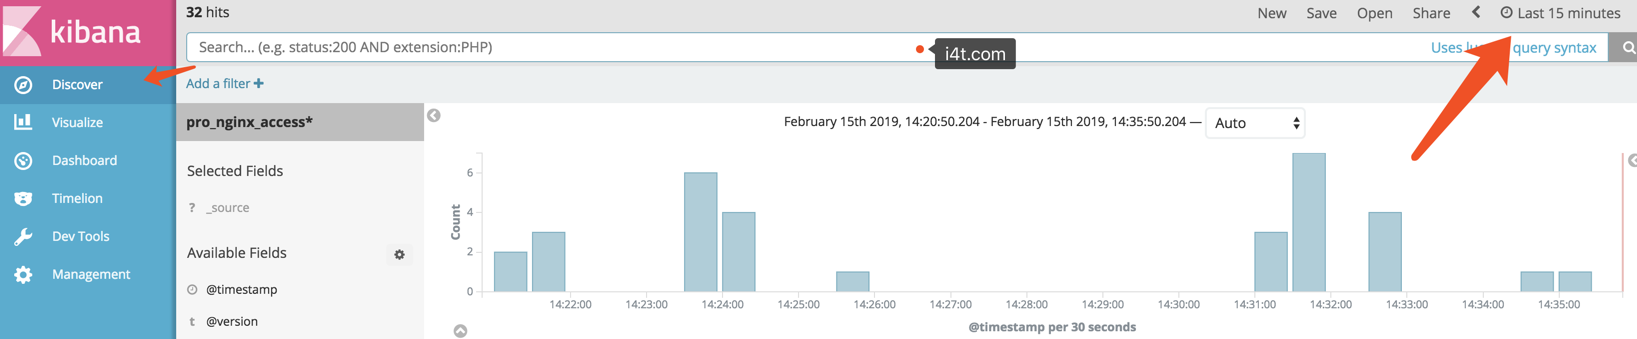
创建完毕后查看索引
六、Elasticsearch Head插件安装

elasticsearch-head是一个界面化的集群操作和管理工具,可以对集群进行傻瓜式操作。你可以通过插件把它集成到es(首选方式),也可以安装成一个独立webapp。
- 显示集群的拓扑,并且能够执行索引和节点级别操作
- 搜索接口能够查询集群中原始json或表格格式的检索数据
- 能够快速访问并显示集群的状态
- 有一个输入窗口,允许任意调用RESTful API。这个接口包含几个选项,可以组合在一起以产生有趣的结果;
- 请求方法(get、put、post、delete),查询json数据,节点和路径
- 支持JSON验证器
- 支持重复请求计时器
- 支持使用javascript表达式变换结果
- 收集结果的能力随着时间的推移(使用定时器),或比较的结果
- 能力图表转换后的结果在一个简单的条形图(包括时间序列)
官方的文档:
关于Head插件安装有2中,如果使用的yum安装es可以直接用es中的plugin install mobz/elasticsearch-head另一种就是需要安装Node环境
ELKStack 实战之 Elasticsearch [一]
安装插件时使用到了npm,所以我们需要安装npm
二进制安装npm https://www.i4t.com/2840.html
[root@i4t ~]# yum install git npm #安装git和npm
[root@i4t ~]# cd /usr/local/
[root@i4t elasticsearch-head]# git clone https://github.com/mobz/elasticsearch-head.git #克隆代码
[root@i4t local]# cd elasticsearch-head/ #需要注意的是执行以下命令需要在elasticsearch-head目录下执行
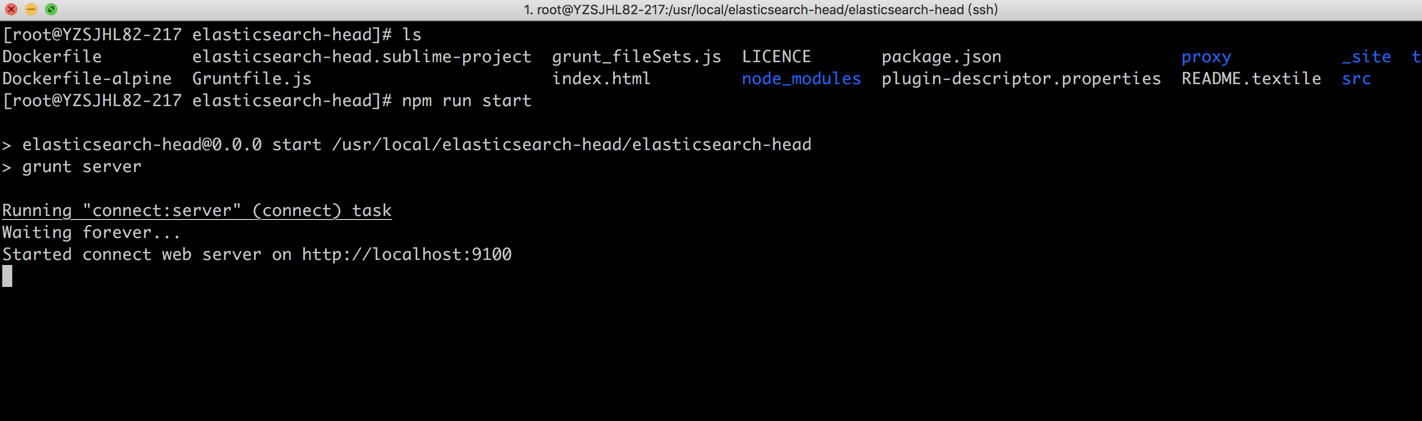
npm install
npm run start ##这是在前台运行,如果想让它在后台运行npm run start & #如果npm install 有error奥错,大部分就是网络的原因,可以参考https://i4t.com/2840.html 使用cpm install 需要提前在elasticsearch.yml配置如下,如果安装我的文档安装都是已经配置好了
vim /usr/local/elasticsearch/elasticsearch.yml
http.cors.enabled: true # elasticsearch中启用CORS
http.cors.allow-origin: "*" #允许访问的IP地址段,* 为所有IP都可以访问
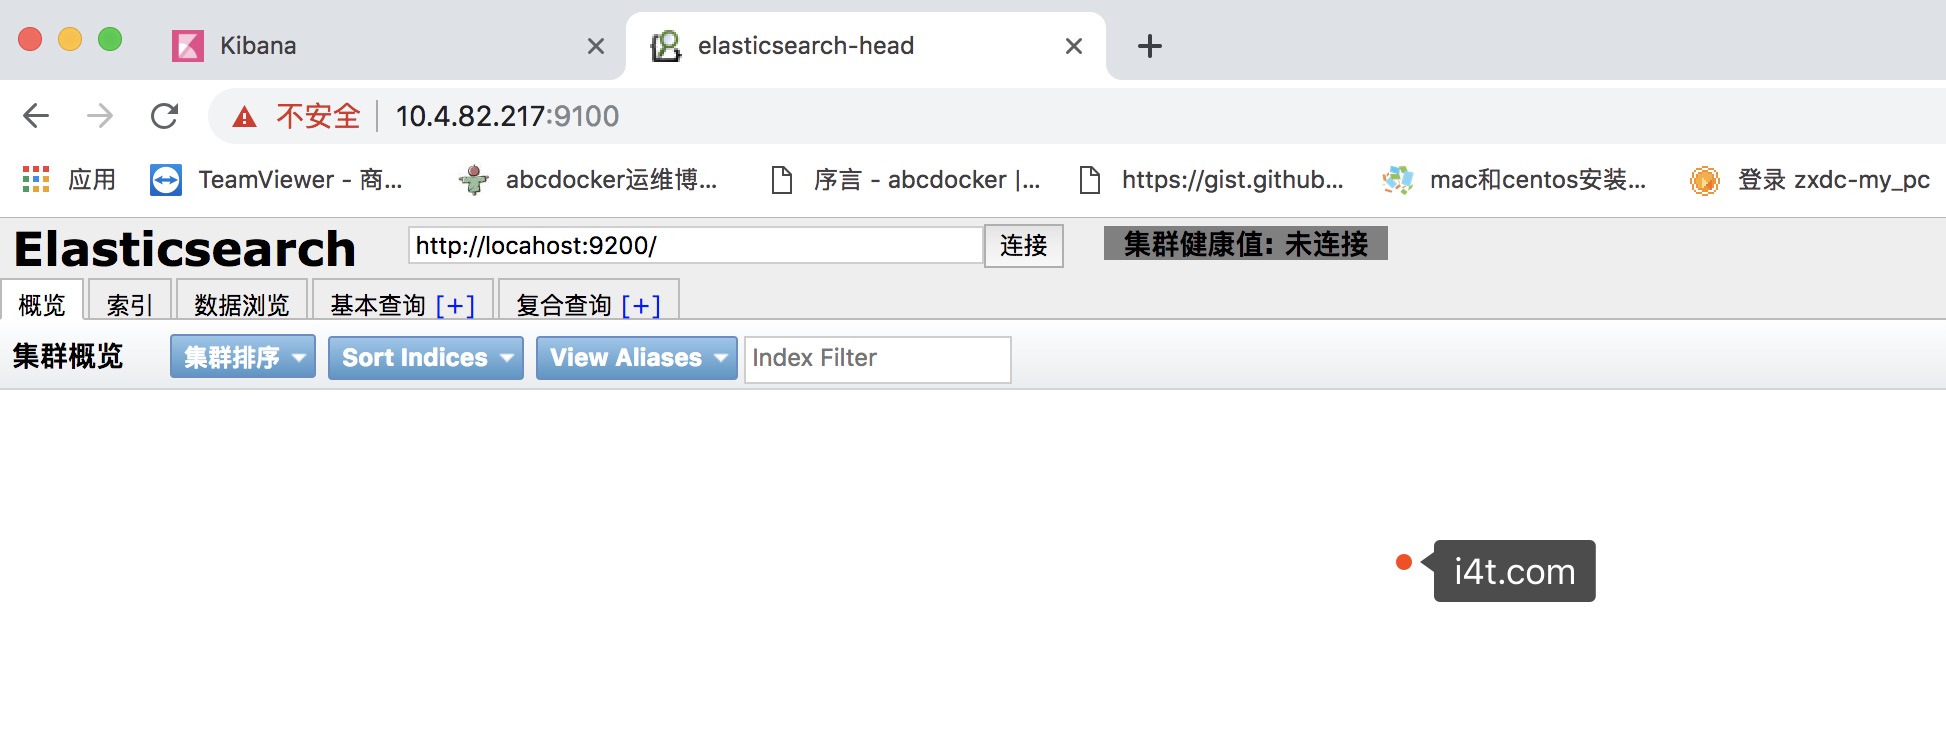
默认端口是9100,默认监控的主机也是localhost
请目录结构和我保持一致
修改默认端口以及默认连接ES地址
vim elasticsearch-head/Gruntfile.js
修改默认的端口

因为head插件默认打开是连接localhost的,我们需要将localhost修改为我们的ip
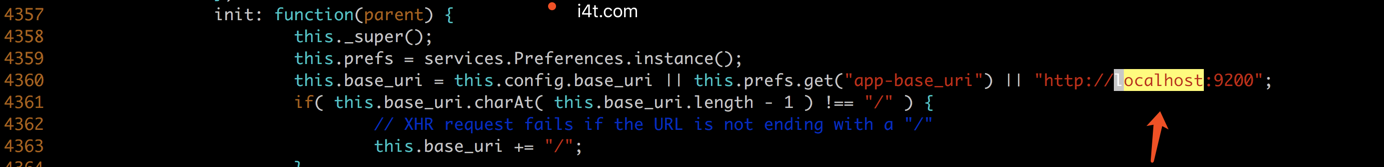
vim elasticsearch-head/_site/app.js
将localhost换成es的ip即可
修改完成后直接要npm run start &即可,不需要build
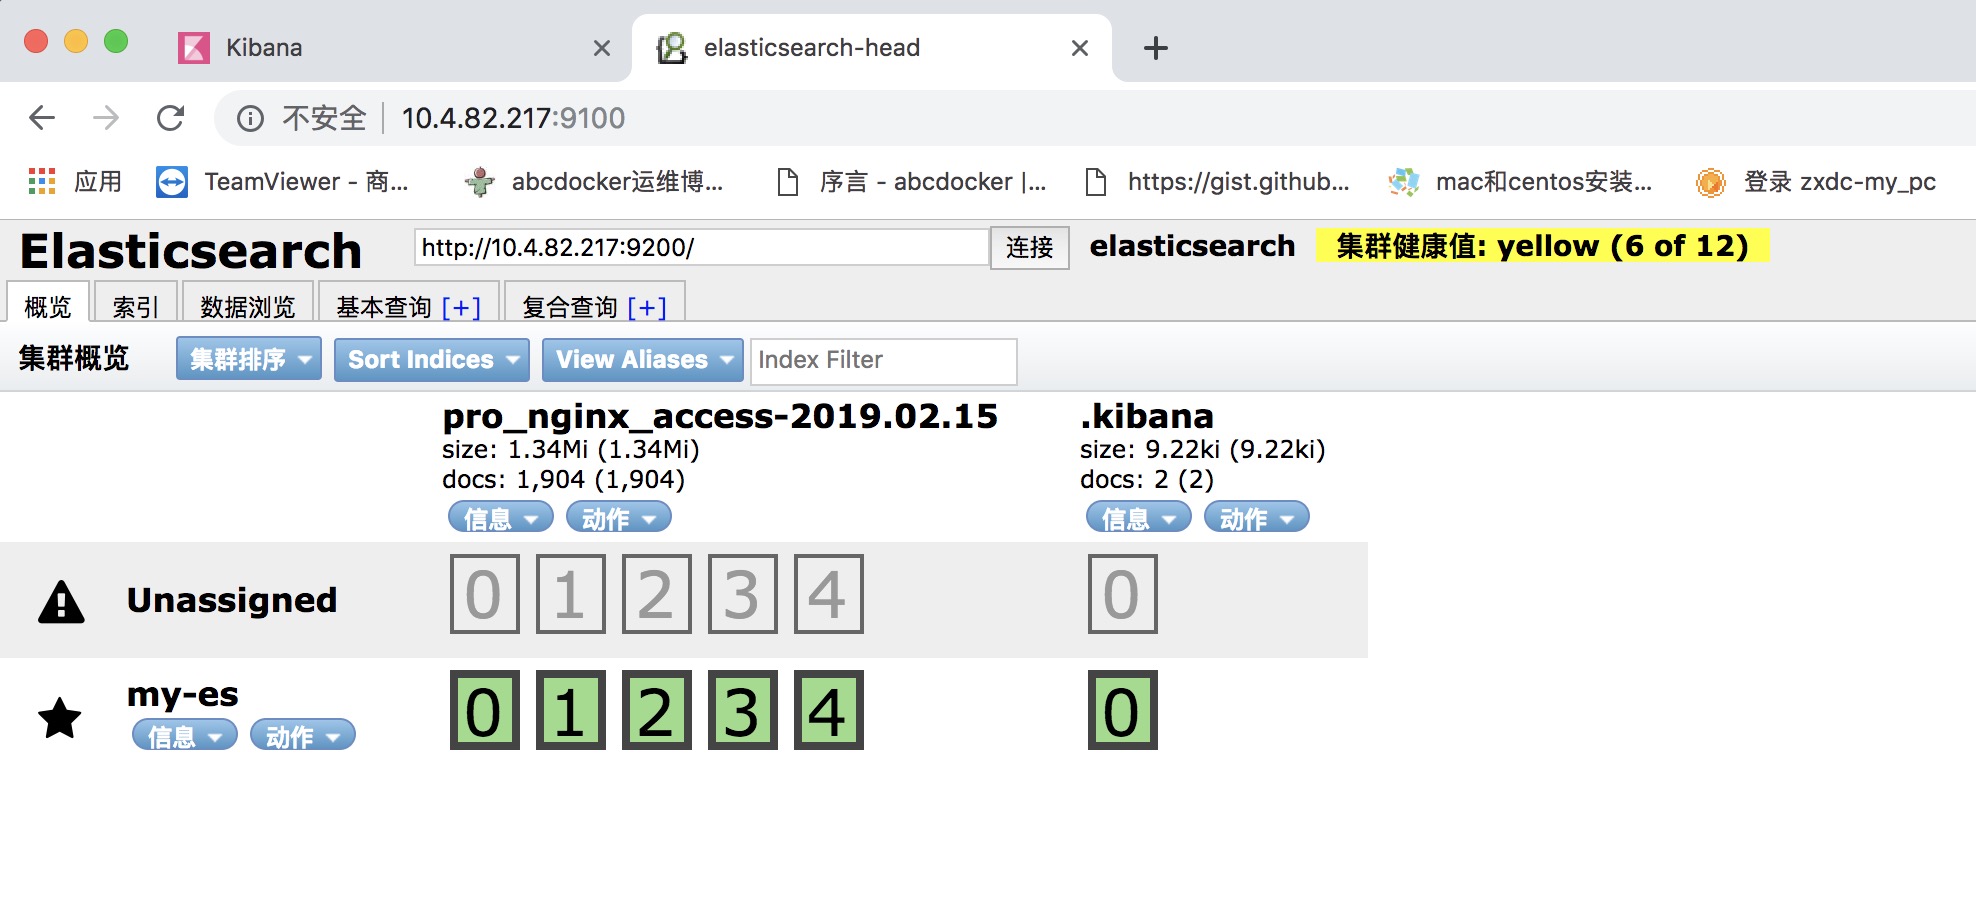
因为是单点,所以是Yellow状态
ELK 二进制安装并收集nginx日志的更多相关文章
- ELK filter过滤器来收集Nginx日志
前面已经有ELK-Redis的安装,此处只讲在不改变日志格式的情况下收集Nginx日志. 1.Nginx端的日志格式设置如下: log_format access '$remote_addr - $r ...
- ELK日志系统之使用Rsyslog快速方便的收集Nginx日志
常规的日志收集方案中Client端都需要额外安装一个Agent来收集日志,例如logstash.filebeat等,额外的程序也就意味着环境的复杂,资源的占用,有没有一种方式是不需要额外安装程序就能实 ...
- ELK Stack (2) —— ELK + Redis收集Nginx日志
ELK Stack (2) -- ELK + Redis收集Nginx日志 摘要 使用Elasticsearch.Logstash.Kibana与Redis(作为缓冲区)对Nginx日志进行收集 版本 ...
- 安装logstash5.4.1,并使用grok表达式收集nginx日志
关于收集日志的方式,最简单性能最好的应该是修改nginx的日志存储格式为json,然后直接采集就可以了. 但是实际上会有一个问题,就是如果你之前有很多旧的日志需要全部导入elk上查看,这时就有两个问题 ...
- 第七章·Logstash深入-收集NGINX日志
1.NGINX安装配置 源码安装nginx 因为资源问题,我们先将nginx安装在Logstash所在机器 #安装nginx依赖包 [root@elkstack03 ~]# yum install - ...
- ELK安装配置及nginx日志分析
一.ELK简介1.组成ELK是Elasticsearch.Logstash.Kibana三个开源软件的组合.在实时数据检索和分析场合,三者通常是配合使用,而且又都先后归于 Elastic.co 公司名 ...
- Docker 部署 ELK 收集 Nginx 日志
一.简介 1.核心组成 ELK由Elasticsearch.Logstash和Kibana三部分组件组成: Elasticsearch是个开源分布式搜索引擎,它的特点有:分布式,零配置,自动发现,索引 ...
- ELK实践(二):收集Nginx日志
Nginx访问日志 这里补充下Nginx访问日志使用的说明.一般在nginx.conf主配置文件里需要定义一种格式: log_format main '$remote_addr - $remote_u ...
- ELK学习实验014:Nginx日志JSON格式收集
1 Kibana的显示配置 https://demo.elastic.co/app/kibana#/dashboard/welcome_dashboard 环境先处理干净 安装nginx和httpd- ...
随机推荐
- syzkaller安装
初始环境配置 sudo apt-get install subversion sudo apt-get install g++ sudo apt-get install git sudo apt in ...
- 虚拟dom应用
vdom如何应用,核心api是什么 1.介绍snabbdom(开源社区用的多,vue2用的是他) 首先回顾下之前的vdom格式 真实的dom <body> <ul id=" ...
- TAITherm — 专业热管理工具
TAITherm 是美国ThermoAnalytics 公司开发的专业三维热仿真分析工具RadTherm 的升级产品,在继承RadTherm特征的基础上,开发了新型高效求解器Multigrid Sol ...
- Prometheus+Grafana监控
什么是Prometheus? Prometheus是由SoundCloud开发的开源监控报警系统和时序列数据库(TSDB).Prometheus使用Go语言开发,是Google BorgMon监控系统 ...
- Nutch2.1+mysql+solr3.6.1+中文网站抓取
1.mysql 数据库配置 linux mysql安装步骤省略. 在首先进入/etc/my.cnf (mysql为5.1的话就不用修改my.cnf,会导致mysql不能启动)在[mysqld] 下添加 ...
- 47、[源码]-Spring容器创建-初始化MessageSource
47.[源码]-Spring容器创建-初始化MessageSource 7.initMessageSource();初始化MessageSource组件(做国际化功能:消息绑定,消息解析): 获取Be ...
- XML建模实列
XML建模 建模的由来: 就是将指定的xml字符串当作对象来操作 好处在于,只需要调用指定的方法就可以完成预定的字符串获取: 建模的一个思路: 1.分析需要被建模的文件中有那几个对 ...
- HTML 008 head
HTML <head> 查看在线实例 <title> - 定义了HTML文档的标题使用 <title> 标签定义HTML文档的标题 <base> - 定 ...
- 提高React组件的复用性
1. 使用props属性和组合 1. props.children 在需要自定义内容的地方渲染props.children function Dialog(props) { //通用组件 return ...
- Spring第四天
顾问包装通知 通知(advice)是Spring中的一种比较简单的切面,只能将切面织入到目标类的所有方法中,而无法对指定方法进行增强 顾问(advisor)是Spring提供的另外一种切面,可以织入到 ...