Prometheus Grafana监控全方位实践
这次就不用 docker 部署服务了,这样大家会更容易接受。欢迎阅读。
引言
Prometheus 是一个监控系统,也是一个时间序列数据库,用Go语言开发的,官方文档。通过从某些特定的目标如主机,Mysql,Redis等,收集带有时间标记的一些指标(metrics),比如服务器内存情况,数据库连接数量等数据,经过一定的处理,按照时间序列顺序进行显示。
你可以配置规则,对这些指标进行处理,当某些指标符合某种规则,会触发报警等。项目地址: https://github.com/prometheus/prometheus。Prometheus现在已经成为Kubernetes的官方监控方案,真棒。
为什么要用这个工具,因为我们有好多机器需要监控,我们要运维!而且雷锋们造了好多收集不同软件服务监控指标的工具,所以还是要用的。
这个工具号称:
- 多维数据模型(由指标名称和键/值维度的集合定义的时间序列)
- 灵活的查询语言
- 不依赖于分布式存储;单服务器节点是自治的
- 拉取数据都是通过HTTP
- 通过中间网关支持推送时间序列
- 通过服务发现或静态配置发现目标
- 多种图形和仪表板支持模式
- 支持集群联邦
说那么多,就是这个工具,你可以把它配置成单机器服务,也可以配置成分布式集群。
你可以去某些地方拉数据,也可以推数据给它,所有的请求都是HTTP协议,这样方便你定义自己的数据格式,制造一个造数据的服务,提供给Prometheus去拉或推。
你可以为Prometheus配置数据来源的静态地址,或者配置服务发现(啥是服务发现,就是现在我的数据提供的服务名是ServiceABC,它在A机器也可能在B机器,就是不知道它在哪里,服务发现会告诉你它现在在哪里),它就知道去哪里把指标数据拉下来。而且,它有各种可视化贼漂亮的UI组件支持。
Grafana是什么呢?是一个跨平台的开源的度量分析和可视化工具,用Go语言开发的,官网文档,可以通过将采集的数据查询然后可视化的展示。数据源可以来自Graphite,InfluxDB,OpenTSDB,Prometheus,Elasticsearch,CloudWatch和KairosDB等。项目地址:https://github.com/grafana/grafana
Prometheus的UI界面还是很丑,Grafana很漂亮,嗯,这很好,所以大家一起搭配干活,当然Grafana其实有时候并不需要Prometheus,它自己可以配置去监控各种数据库,Prometheus只是它的数据源。
小试牛刀
时间序列的数据从哪里来,Prometheus 只是收集数据的,它要去某些地方拉数据,所以要有一些可以提供数据的服务。当然,你可以自己制作自己的数据服务。
官网提供了一些造数据的服务。先来看一个最基本的:机器节点指标导出服务:node_exporter,可以导出机器CPU,内存等使用情况。
我们来进行尝试。
你可以在这里下载合适你操作系统的最新node_exporter。
我是Mac苹果系统,所以下载了https://github.com/prometheus/node_exporter/releases/download/v0.18.1/node_exporter-0.18.1.darwin-amd64.tar.gz。
解压后就可以用了:
tar xvf node_exporter-0.18.1.darwin-amd64.tar.gz

cd node_exporter-0.18.1.darwin-amd64

./node_exporter

INFO[0000] Starting node_exporter (version=0.18.1, branch=HEAD, revision=3db77732e925c08f675d7404a8c46466b2ece83e)  source="node_exporter.go:156"

INFO[0000] Build context (go=go1.11.10, user=root@4a30727bb68c, date=20190604-16:47:36)  source="node_exporter.go:157"

INFO[0000] Enabled collectors:                           source="node_exporter.go:97"

INFO[0000]  - boottime                                   source="node_exporter.go:104"

INFO[0000]  - cpu                                        source="node_exporter.go:104"

INFO[0000]  - diskstats                                  source="node_exporter.go:104"

INFO[0000]  - filesystem                                 source="node_exporter.go:104"

INFO[0000]  - loadavg                                    source="node_exporter.go:104"

INFO[0000]  - meminfo                                    source="node_exporter.go:104"

INFO[0000] Listening on :9100                            source="node_exporter.go:170"
这个数据服务暴露了 9100 端口给 Prometheus 取数据。
打开 http://127.0.0.1:9100/metrics可以看到这个node_exporter提供的数据指标是怎么样的:
# HELP node_network_receive_bytes_total Network device statistic receive_bytes.

# TYPE node_network_receive_bytes_total counter  这个counter表示只增长的类型,也就是只会增加不会减少的值,且数值只能是正整数。大数值会启用科学计数法。

node_network_receive_bytes_total{device="XHC20"} 0

node_network_receive_bytes_total{device="awdl0"} 3072

node_network_receive_bytes_total{device="bridge0"} 0

node_network_receive_bytes_total{device="en0"} 0

node_network_receive_bytes_total{device="en1"} 4.133417984e+09

# HELP node_cpu_seconds_total Seconds the cpus spent in each mode.

# TYPE node_cpu_seconds_total counter

node_cpu_seconds_total{cpu="0",mode="idle"} 42696.99

node_cpu_seconds_total{cpu="0",mode="nice"} 0

node_cpu_seconds_total{cpu="0",mode="system"} 9593.58

node_cpu_seconds_total{cpu="0",mode="user"} 27073.77
上面两行是注释说明,HELP是指标说明,TYPE是值类型。指标定义是这种格式的:指标名{key1="value1",key2="value2"} value,大括号里是指标下面的细分,你可以认为是二级指标。
说明node_network_receive_bytes_total这个大指标是统计机器网络接收字节数的,大指标下面有小指标,如网卡en0,en1等,后面的数字表示具体的值:接收字节数。
参考一下架构图说清楚Prometheus怎么用这些数据:
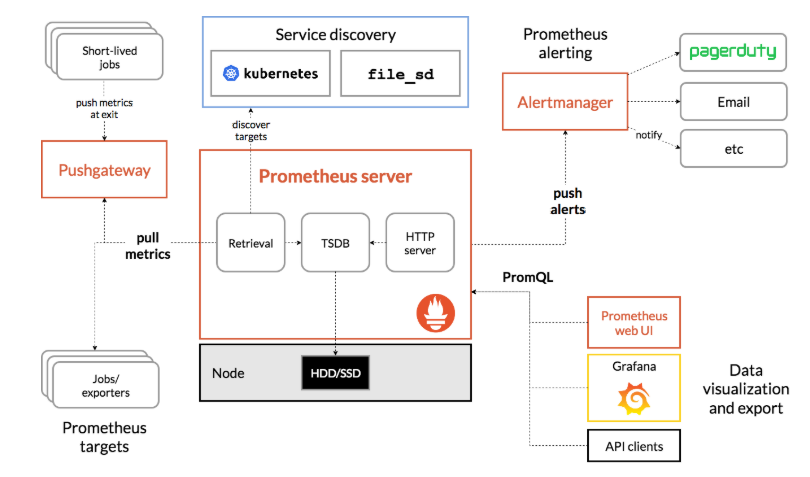
jobs/exporter称之为导出器,上面我们使用的node_exporter就是属于这部分,是Prometheus主要的指标来源。Prometheus Server是服务核心组件,存储使用时序数据库TSDB将数据保存在硬盘上,由于官方对SSD做了专门的优化,所以使用SSD性能会更优。Service dicovery服务发现,配置Prometheus可以直接在写在yaml文件中,但如果配置较长也可以写入其他文件并启用文件发现(file_sd)功能让其自行侦听配置文件变化,甚至可以使用consul或者kubernetes这样的服务发现来动态更新配置以适应频繁的节点变更。Prometheus使用pull模型从节点暴露出来的端口拉取配置,这相比push方式更容易避免节点异常带来的干扰和繁琐的工作。Pushgateway类似于一个中转站,Prometheus的服务端只会使用pull方式拉取数据,但是某些节点因为某些原因只能使用push方式推送数据,所以这是一个存放推送数据的中转站。Alertmanager是一个告警系统,可以通过在配置文件中添加规则的方式,计算并发出警报,它支持多种发送方式比如Email等。- 对于已经存储的历史数据,
Prometheus提供了PromQL语言进行查询,并自带了一个简易的UI界面,可以在界面上进行查询、绘图、查看配置、告警等等。当然,现在都用Grafana这个更漂亮的工具来查了。
一句话,Prometheus可以从某些地方获取到监控数据,并且存起来,配套Grafana等客户端工具,你可以轻松监控,无烦恼。
下面我们进行集成,首先到官网下载Prometheus,我是Mac苹果系统,所以下载了https://github.com/prometheus/prometheus/releases/download/v2.12.0/prometheus-2.12.0.darwin-amd64.tar.gz。
解压后就可以用了:
tar xvfz prometheus-*.tar.gz

cd prometheus-*

./prometheus
默认情况下,Prometheus监控自己,我们需要让它监控其他的人,编辑配置文件prometheus.yml:
vim prometheus.yml

# my global config

global:

  scrape_interval:     15s # Set the scrape interval to every 15 seconds. Default is every 1 minute. 每15秒抓一次数据

  evaluation_interval: 15s # Evaluate rules every 15 seconds. The default is every 1 minute.

  # scrape_timeout is set to the global default (10s).

# Alertmanager configuration

alerting:

  alertmanagers:

  - static_configs:

    - targets:

      # - alertmanager:9093

# Load rules once and periodically evaluate them according to the global 'evaluation_interval'.

rule_files:

  # - "first_rules.yml"

  # - "second_rules.yml"

# A scrape configuration containing exactly one endpoint to scrape:

# Here it's Prometheus itself.

scrape_configs:

  # The job name is added as a label `job=<job_name>` to any timeseries scraped from this config.

  - job_name: 'prometheus'

    # metrics_path defaults to '/metrics'

    # scheme defaults to 'http'.

    static_configs:

    - targets: ['localhost:9090']

  # 我们加了这个,填入node_exporter暴露出的端口

  - job_name: "node"

    static_configs:

    - targets: ["127.0.0.1:9100"]
然后执行:
# By default, Prometheus stores its database in ./data (flag --storage.tsdb.path).

./prometheus --config.file=prometheus.yml

level=info ts=2019-09-11T06:41:06.459Z caller=main.go:740 msg="Loading configuration file" filename=prometheus.yml

level=info ts=2019-09-11T06:41:46.492Z caller=main.go:768 msg="Completed loading of configuration file" filename=prometheus.yml

level=info ts=2019-09-11T06:41:46.492Z caller=main.go:623 msg="Server is ready to receive web requests."
默认指标数据会保存在当前目录./data下。我们打开 http://127.0.0.1:9090查看Prometheus。
在http://127.0.0.1:9090/targets可以看到我们监控的模板,State绿色表示是健康的。
在http://127.0.0.1:9090/graph点击选择insert metric at cursor可以下拉指标,查看具体数据,如下图:
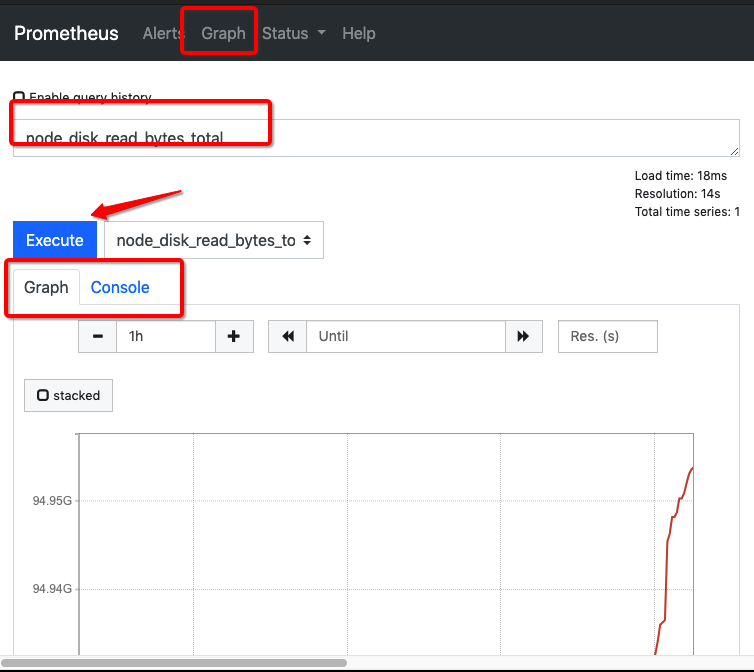
当然你也可以自己输入:node_cpu_seconds_total{cpu="0",mode="idle"},查出 CPU0每一次空闲的秒数,Console会显示出 node_cpu_seconds_total{cpu="0",instance="127.0.0.1:9100",job="node",mode="idle"} 46541.04。
计算出CPU所有核数的busy状态总和在整个CPU时间的占比可以用更复杂的表达式:
(((count(count(node_cpu_seconds_total) by (cpu))) - avg(sum by (mode)(irate(node_cpu_seconds_total{mode='idle'}[5m])))) * 100) / count(count(node_cpu_seconds_total) by (cpu))
学习PromQL (Prometheus Query Language)。但我们并不关心这些复杂的表达式,因为有人帮我们把这些都做好了,上Grafana!!里面有好多插件帮你集成了。
先到https://grafana.com/grafana/download/6.3.5下载我们想要的包。
我是Mac方式安装,其他操作系统请参考其他安装方法,我这样做:
brew update

brew install grafana

brew tap homebrew/services

brew services start grafana
我们打开 http://127.0.0.1:3000查看Grafana,第一次账号密码:admin/admin。
- Open the side menu by clicking the Grafana icon in the top header.
- In the side menu under the Dashboards link you should find a link named Data Sources.
- Click the + Add data source button in the top header.
- Select Prometheus from the Type dropdown.
添加数据源,点击 Add data source,选择Prometheus,在URL输入框键入http://127.0.0.1:9090,点击save & test,如果出现下图中的绿色提示,则表示配置有效,否则可能是地址或者端口等其他错误,需要自行修改。
点击左侧的Home回到首页,创建Dashboard,搜索相应的 Node Exporter,有一堆东西出来,跟着他们的提示做,最后就出来很漂亮的监控画面了。
可以参考这个文章:Book
实战
Prometheus官方推荐了一些监控导出器:EXPORTERS。
Grafana官方推荐了一些数据源Data Source。
搭配这两个一起干活,可以组合出很多种监控方案。具体请查看官方文档。
感谢您的阅读,再见
Prometheus Grafana监控全方位实践的更多相关文章
- 使用Prometheus+Grafana监控MySQL实践
一.介绍Prometheus Prometheus(普罗米修斯)是一套开源的监控&报警&时间序列数据库的组合,起始是由SoundCloud公司开发的.随着发展,越来越多公司和组织接受采 ...
- Prometheus+Grafana监控部署实践
参考文档: Prometheus github:https://github.com/prometheus grafana github:https://github.com/grafana/graf ...
- cAdvisor+Prometheus+Grafana监控docker
cAdvisor+Prometheus+Grafana监控docker 一.cAdvisor(需要监控的主机都要安装) 官方地址:https://github.com/google/cadvisor ...
- [转帖]Prometheus+Grafana监控Kubernetes
原博客的位置: https://blog.csdn.net/shenhonglei1234/article/details/80503353 感谢原作者 这里记录一下自己试验过程中遇到的问题: . 自 ...
- prometheus+grafana监控redis
prometheus+grafana监控redis redis安装配置 https://www.cnblogs.com/autohome7390/p/6433956.html redis_export ...
- prometheus+grafana监控mysql
prometheus+grafana监控mysql 1.安装配置MySQL官方的 Yum Repository(有mysql只需设置监控账号即可) [root@localhost ~]# wget - ...
- [转帖]安装prometheus+grafana监控mysql redis kubernetes等
安装prometheus+grafana监控mysql redis kubernetes等 https://www.cnblogs.com/sfnz/p/6566951.html plug 的模式进行 ...
- 【Springboot】用Prometheus+Grafana监控Springboot应用
1 简介 项目越做越发觉得,任何一个系统上线,运维监控都太重要了.关于Springboot微服务的监控,之前写过[Springboot]用Springboot Admin监控你的微服务应用,这个方案可 ...
- Prometheus + Grafana 监控系统搭
本文主要介绍基于Prometheus + Grafana 监控Linux服务器. 一.Prometheus 概述(略) 与其他监控系统对比 1 Prometheus vs. Zabbix Zabbix ...
随机推荐
- Java 面向对象(七)
枚举 枚举的引入(模拟枚举) class Student { private int restDay; public int getRestDay() { return restDay; } publ ...
- 关于Kernel的思考
学习播客_KLDA(推导得很通俗,下面的推导就是源于此篇博客) 第一部分:按照自己的理解,模仿抄!学习播客来完成一下KLDA的推导. 第二部分:对于Kernel的思考 KLDA:顾名思义,就是把Ker ...
- 激活函数,Batch Normalization和Dropout
神经网络中还有一些激活函数,池化函数,正则化和归一化函数等.需要详细看看,啃一啃吧.. 1. 激活函数 1.1 激活函数作用 在生物的神经传导中,神经元接受多个神经的输入电位,当电位超过一定值时,该神 ...
- JAVA RDD 介绍
RDD 介绍 RDD,全称Resilient Distributed Datasets(弹性分布式数据集),是Spark最为核心的概念,是Spark对数据的抽象. RDD是分布式的元素集合,每个RDD ...
- HTTP请求客户端工具类
1.maven 引入依赖 <dependency> <groupId>commons-httpclient</groupId> <artifactId> ...
- ISO/IEC 9899:2011 条款6.4.6——标点符号
6.4.6 标点符号 语法 1.以下之一 [ ] ( ) { } . -> ++ -- & * + - ...
- 浅析angular,react,vue.js jQuery-1
作者:尚春链接:https://www.zhihu.com/question/38989845/answer/79201080来源:知乎著作权归作者所有.商业转载请联系作者获得授权,非商业转载请注明出 ...
- Qt编写自定义控件46-树状导航栏
一.前言 树状导航栏控件是所有控件中最牛逼最经典最厉害的一个,在很多购买者中,使用频率也是最高,因为该导航控件集合了非常多的展示效果,比如左侧图标+右侧箭头+元素前面的图标设置+各种颜色设置等,全部涵 ...
- python 运算符和小数据池
计算机可以进行的运算有很多种,可不只加减乘除这么简单,运算按种类可分为算数运算.比较运算.逻辑运算.赋值运算.成员运算.身份运算.位运算,今天我们暂只学习算数运算.比较运算.逻辑运算.赋值运算 算数运 ...
- MySQL安装时出现Apply Security Settings错误的解决办法(转)
最近在学习MySQL时,下载了MySQL5.5版本的安装包,在配置向导的最后的页面却出现了Apply Security Settings的错误.第一次安装时比较顺利,中途卸载了一下,结果第二次安装的时 ...