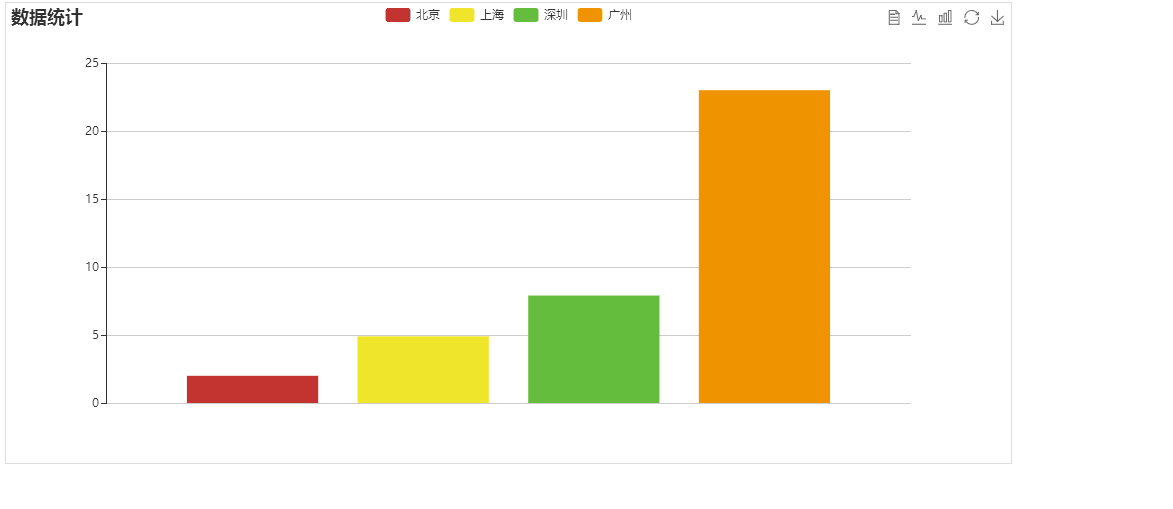
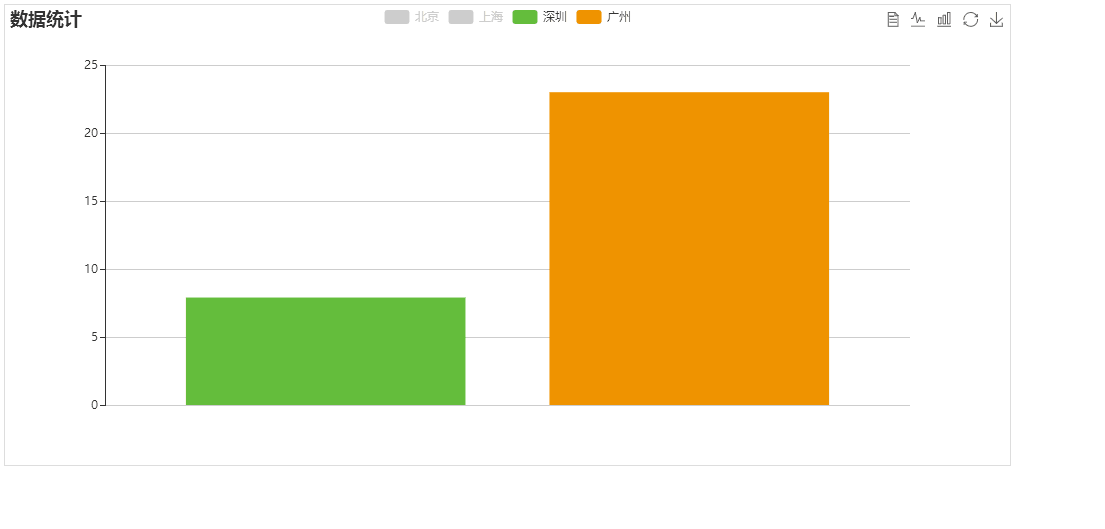
echarts柱状图每个柱子显示不同颜色,并且能够实现点击每种颜色影藏对应柱子的功能

---------------------------------------------------------代码区---------------------------------------------------------------
<!DOCTYPE html>
<html>
<head>
<base href="<%=basePath%>">
<title>测试</title>
<meta http-equiv="pragma" content="no-cache">
<meta http-equiv="cache-control" content="no-cache">
<meta http-equiv="expires" content="0">
<meta http-equiv="keywords" content="keyword1,keyword2,keyword3">
<meta http-equiv="description" content="This is my page">
<link rel="stylesheet" href="admin/css/bootstrap.min.css">
</head>
<body>
<section class="hj-second-page-section">
<div class="container-fluid">
<div class="rows">
<div class="col-xs-12 col-sm-12 col-md-12 col-lg-12">
<div class="rows">
<div class="col-xs-12 col-sm-12 col-md-12 col-lg-12 hj-jumbotron-div">
<div class="panel panel-primary ng-scope">
<!-- pannel start -->
<div class="panel-body vc-pannel-body-toggle">
<div class="rows ng-scope">
<div class="panel-body vc-msg-panel-body">
<div class="row">
<div class="col-xs-12 col-sm-12 col-md-6 col-lg-6">
<div id="rt_chart1" style=""></div>
</div>
</div>
</div>
</div>
</div>
<!-- pannel end -->
</div>
</div>
</div>
</div>
</div>
</div>
</section>
<script src="echarts.js"></script>
<script src="jquery-2.2.3.min.js"></script>
<script>
/**
* @description 绘制柱状图
* @author luohan
* @date 2017-7-28
* @param
*/
function initChart1() {
$("#rt_chart1").height(460);
$("#rt_chart1").width(1005);
$("#rt_chart1").css("border","1px solid #ddd");
var myChart1 = echarts.init(document.getElementById("rt_chart1"));
var option1 = {
title : {
text: '数据统计',
subtext: ''
},
tooltip : {
trigger: 'axis'
},
legend: {
data:['北京','上海','深圳','广州']
},
toolbox: {
show : true,
feature : {
mark : {show: true},
dataView : {show: true, readOnly: false},
magicType : {show: true, type: ['line', 'bar']},
restore : {show: true},
saveAsImage : {show: true}
}
},
calculable : true,
xAxis : [
{
type : 'category',
show:false,
data : ['横坐标自定义']
}
],
yAxis : [
{
type : 'value'
}
],
series : [
{
name:'北京',
type:'bar',
itemStyle: {
normal: {
color: function(params) {
//首先定义一个数组
var colorList = [
'#C33531'
];
return colorList[params.dataIndex]
},
//以下为是否显示
label: {
show: false
}
}
},
data:[2.0],
},
{
name:'上海',
type:'bar',
itemStyle: {
normal: {
color: function(params) {
//首先定义一个数组
var colorList = [
'#EFE42A'
];
return colorList[params.dataIndex]
},
//以下为是否显示
label: {
show: false
}
}
},
data:[4.9],
},
{
name:'深圳',
type:'bar',
itemStyle: {
normal: {
color: function(params) {
//首先定义一个数组
var colorList = [
'#64BD3D'
];
return colorList[params.dataIndex]
},
//以下为是否显示
label: {
show: false
}
}
},
data:[7.9],
},
{
name:'广州',
type:'bar',
itemStyle: {
normal: {
color: function(params) {
//首先定义一个数组
var colorList = [
'#EE9201'
];
return colorList[params.dataIndex]
},
//以下为是否显示
label: {
show: false
}
}
},
data:[23.0],
}
]
};
// 为echarts对象加载数据
myChart1.setOption(option1);
}
initChart1();
</script>
</body>
</html>
echarts柱状图每个柱子显示不同颜色,并且能够实现点击每种颜色影藏对应柱子的功能的更多相关文章
- echarts彩虹柱状图 每个bar显示不同颜色, 标题在不同位置 ,工具中有可以直接保存为图片下载,平均线的添加
可以参考: https://echarts.baidu.com/echarts2/doc/example.html https://echarts.baidu.com/echarts2/doc/doc ...
- echarts柱状图坐标文字显示不完整解决方式
echarts柱状图坐标文字显示不完整解决方式 本文转载自:https://jingyan.baidu.com/article/ab69b2707a9aeb2ca7189f0c.html echart ...
- echarts 柱状图,每根柱子显示不同颜色(随机显示和定制显示)
1,定制显示 option = { title: { text: '某地区降水量', subtext: '纯属虚构' }, tooltip: { trigger: 'axis' }, grid: { ...
- echarts 默认柱状图每根柱子显示不同颜色(随机显示和定制显示)
series: [{ name: '请求数', type: 'bar', //barGap: 60, barWidth: 140,//柱图宽度 //stack: 'sum',//堆叠效果 itemSt ...
- echarts柱状图图例不显示的问题
如果想要图例有效果,legend中数据要和series中name的值保持一致,切记切记,这是我曾经遇到的坑,不保持一致是没有效果的
- echarts以地图形式显示中国疫情情况实现点击省份下钻
首先要导入对应的包.下钻用到各个省份的json文件等内容导入之后进行相关的操作. 首先是从数据库中读取相应的数据文件.通过list方式.只有在ser出转化为json文件.在jsp页面通过ajax来进行 ...
- Echarts柱状图实现不同颜色渐变色
第一次写文,只是想记录一下自己平时发现的小功能,这篇主要是实现echarts柱状图,每个柱子实现不同颜色的渐变色,也是第一次接触echarts,后台使用ssm,前台是extjs,直接上效果图 直接上j ...
- echarts如何给柱形图的每个柱子设置不同颜色
总结下这几日用echarts库作基本图形遇到的一些问题. echarts快速上手可参考官网: http://echarts.baidu.com/tutorial.html#5%20%E5%88%86% ...
- ajax导致Echarts不显示饼图数据、柱状图数据只显示气泡的问题。
1.ajax导致Echarts不显示饼图数据.柱状图数据只显示气泡的问题. ajax的同步.这个同步的意思是当JS代码加载到当前ajax的时候会把页面里所有的代码停止加载,页面出去假死状态,当这个aj ...
随机推荐
- python向数据库插入中文乱码问题
1.python向数据库插入中文乱码问题 直接手动insert into 中文 不乱码,但是用程序跑起来就乱码. conn =MySQLdb.connect(host="127.0.0.1& ...
- C++结构体成员列表初始化
C++关于struct和class的区别,可以看上一篇文章:c ++ class和struct[转] 结构体成员列表初始化,来个例子: #include <iostream> #inclu ...
- New Concept English three (48)
23w/m 76errors In this much-travelled world, there are still thousands of places which are inaccessi ...
- Gym - 100502G Outing (强连通缩点+树形依赖背包)
题目链接 问题:有n个人,最多选k个,如果选了某个人就必须选他指定的另一个人,问最多能选多少个人. 将每个人所指定的人向他连一条单向边,则每一个点都有唯一的前驱,形成的图是个基环树森林,在同一个强连通 ...
- Til the Cows Come Home (最短路模板题)
个人心得:模板题,不过还是找到了很多问题,真的是头痛,为什么用dijkstra算法book[1]=1就错了..... 纠结中.... Bessie is out in the field and wa ...
- LeetCode Perfect Number
原题链接在这里:https://leetcode.com/problems/perfect-number/#/description 题目: We define the Perfect Number ...
- Linux终端录屏与播放 script 命令
本文由Suzzz原创,发布于 http://www.cnblogs.com/Suzzz/p/4107700.html ,转载请保留此声明. 有时候可能想要记录在终端的所有操作包括输出等,将来作为视频播 ...
- BZOJ4195:[NOI2015]程序自动分析
浅谈并查集:https://www.cnblogs.com/AKMer/p/10360090.html 题目传送门:https://lydsy.com/JudgeOnline/problem.php? ...
- Chroma Oracle 安装宝典,吐血整理
尼玛,太坑爹!安装: 1.Chroma Application Service 2. PL SQL 安装Oracle 11g 的步骤和过程: 第一步:只能安装 Oracle 11g 64 bit 数据 ...
- 开启VMSS Autoscale的报警功能
VMSS可以自动的实现Scale Out和Scale in.在VMSS做自动操作的时候,可以通过配置通知服务,通知VMSS的状态. 具体实现方式: 1, 在portal中选择"监视器&quo ...