SQL Server Debugging with WinDbg – an Introduction
Klaus Aschenbrenner
SQL Server Debugging with WinDbg – an Introduction
 Briefcase
 Print
Print(Be sure to checkout the FREE SQLpassion Performance Tuning Training Plan – you get a weekly email packed with all the essential knowledge you need to know about performance tuning on SQL Server.)
In today’s blog posting I want to dig into a completely different area in SQL Server: how to debug SQL Server with WinDbg – the debugger that comes with the Debugging Tools for Windows. Before we go into the nasty details, I want to explain in a bit in more detail why I have chosen such an obscure topic to blog about.
Why?
Why on earth do you ever need a debugger like WinDbg when working with SQL Server? The short answer: NEVER! SQL Server is a stable product and you should be always fine with the troubleshooting techniques (Extended Events, DMVs/DMFs) provided by it, without ever having a need for WinDbg. And if you are in doubt, you should always contact PSS first, before trying to debug a nasty SQL Server problem yourself. What are the reasons for using a debugger like WinDbg? For me it’s mainly about education, and learning *how* things are working internally in SQL Server, and *how* relational database engines are implemented. When I’m dealing with customer problems, I sometimes see crazy things happening within SQL Server, which I have to explain. Therefore the more I know about SQL Server, and how SQL Server works, the better it is for me and my customers.
I’m using WinDbg ONLY for educational purposes on non-production test systems to get a better understanding of what happens within SQL Server when executing queries. And as a side-effect I’m learning a bunch of additional concepts about the Windows OS, about user-mode debugging, the X64 assembly language, and the x64 machine architecture. Over the last 6 months I have also read a huge amount of books, and research whitepapers that describe *how* relational database engines are implemented. With WinDbg I can have a look into SQL Server, in which way some things are implemented, and how things are working together. And the most important thing: using a debugger like WinDbg is just geeky, and everyone loves it ![]()
Let’s get started
Before we go into the details how to setup WinDbg for SQL Server debugging, I first want to give you a high level overview about the most important SQL Server DLL files, that you will use during debugging. Let’s have a look on the following figure.

As you know, SQL Server itself is implemented in the executable sqlservr.exe. During startup, sqlservr.exe load multiple DLL files into its process space. The most important ones – from a debugging perspective – are the following ones:
- The DLL file sqldk.dll (SQL Server Development Kit) implements by far the largest part of SQL OS – the OS that is part of SQL Server which handles thread scheduling and memory management.
- sqlmin.dll implements everything regarding the relational engine itself, including the Storage Engine, Data Access Methods, Lock Manager, Log Manager, LazyWriter, and other components. This file is one of the most important ones for debugging, because it contains the major well-known components of SQL Server.
- In addition you will also have the DLL file sqllang.dll that contains everything regarding the T-SQL language, and the Query Processor itself.
To use WinDbg you have to install the Debugging Tools for Windows, which can be downloaded for free from Microsoft. After you have installed them, you get in the folder
C:\Program Files (x86)\Windows Kits\8.1\Debuggers\x64
the executable windbg.exe that is the debugger itself. When you start WinDbg, you have to make sure that you start it with administrative privileges, because otherwise you have no chance to attach to a process like sqlservr.exe. To use WinDbg effectively, you also have to configure so-called symbols. The symbol files are used to decode memory addresses to their corresponding function names for easier debugging and understanding. When you are working with symbols, you have to distinguish between public and private symbols. Every person outside of Microsoft *only* has access to the public symbols. The public symbols are just a subset of the private symbols, excluding more interesting things like:
- Data type definitions
- Local variable definitions
- Function parameters
The public symbols provide you only with function names – almost nothing more! That’s a huge restriction that we have to live with (compared to the private symbols). But on the other hand Microsoft wants to protect their intellectual property. But getting complete function names for call-stacks, setting breakpoints on them, and debugging through them will greatly help you get a better understanding of what happens within SQL Server. As long as you have configured WinDbg correctly, you will get automatically the correct public symbols for your specific SQL Server build that you are debugging. You can also try local Kernel Mode Debugging, and you will even get the correct symbols for the kernel mode – but that’s a different (long) story… Within WinDbg you just have to configure the internet address of the public symbol server of Microsoft, where WinDbg can download them. The address is
http://msdl.microsoft.com/download/symbols
I’m using a simple batch file, which launches WinDbg, sets the correct address of the symbol server, and attaches directly to the process sqlservr.exe. The used command line is as follows:
windbg -y srv*g:\symbols*http://msdl.microsoft.com/download/symbols -pn sqlservr.exe
You must make sure that only one instance is SQL Server is running, because WinDbg is attached by the process name sqlservr.exe. If you have multiple instances of SQL Server running, you have to specify the correct PID, which you can get from Task Manager. The path g:\symbols is the location on your computer where the downloaded symbol will be stored. Size that location accordingly, because you can download a huge amount of symbol files over the time. My local symbol store has currently a size of around 1 GB… If everything went fine, you should by now be attached to sqlservr.exe:
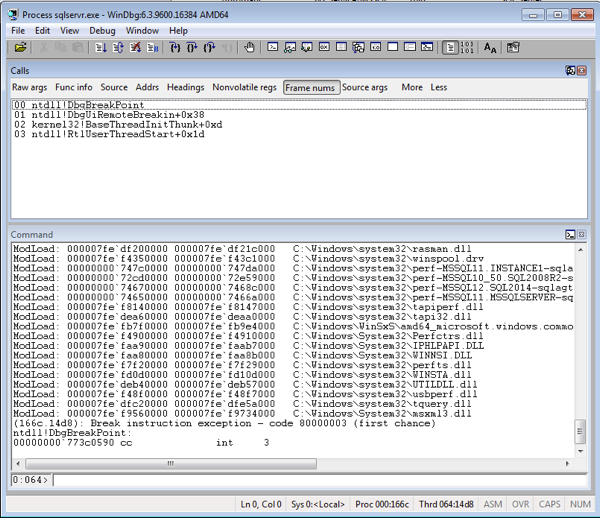
The program execution has currently stopped, because you hit a breakpoint in the module ntdll. ntdll is a simple wrapper DLL provided by the OS, which performs the transition from user mode into the kernel mode. This means also that now *every* thread within SQL Server is stopped, and no more work is done anymore!!! NEVER EVER try to attach WinDbg to sqlservr.exe in a production environment! If you want to resume the execution of sqlservr.exe just hit the F5 key on your keyboard – SQL Server is running again. If you want to break the program execution again, you have to set a specific breakpoint somewhere in the process space of sqlservr.exe, or you can also break the current execution by the keyboard shortcut CTRL + BREAK.
If you break the execution with that shortcut, WinDbg just puts you onto a specific thread, somewhere within sqlservr.exe. That’s only recommended if you want to analyze a specific memory address, or if you want to set a more concrete breakpoint for further troubleshooting. One very important command in WinDbg is the x command: it returns you all symbols that are defined in a specific module. Let’s have a look at the following command:
x sqlmin!*BTree*
This WinDbg command returns you all function names that have the word “BTree” in their name. You are just able to analyze and return the various function names on which you can set a breakpoint. The format of the returned function names is as follows: module_name!class_name::function_name, like sqlmin!BTreeMgr::Seek. If you want to return all functions defined by the class BTreeMgr, you can use the following command:
x sqlmin!BTreeMgr::*
The x command is a very powerful one to explore the various classes that SQL Server implements. To give you some home work, try to answer the following questions:
- In which class is the Lock Manager implemented?
- What functions are used to acquire and release latches?
- What’s the name of the class that implements the SQLOS Scheduler?
Please feel free to post your answers as a comment.
Summary
In this blog posting I have given you a brief introduction to WinDbg, and how you can use this debugger to attach it to SQL Server. As you have seen, the process space of sqlservr.exe consists of multiple DLL files, where every DLL implements a larger set of components of SQL Server. When you have configured the path to the public symbols in the correct way, you are able to retrieve a lot of meta data information about the various classes and functions that are part of SQL Server. The WinDbg command x is here your friend.
I hope that you have enjoyed this very specific blog posting, and next week I will show you, how you can debug and execute a SQL Server query instruction by instruction within WinDbg.
Thanks for reading!
-Klaus
SQL Server Debugging with WinDbg – an Introduction的更多相关文章
- Debugging a SQL Server query with WinDbg
Debugging a SQL Server query with WinDbg May 13, 2014 · Klaus Aschenbrenner · 5 Comments (Be sure to ...
- 使用WinDbg调试SQL Server——入门
这篇文章我想探究下SQL Server里完全不同的领域:如果使用WinDbg(来自针对Windows的调试工具)调试SQL Server.在我们进入枯涩细节之前,我想详细解释下为什么选择这样晦涩的话题 ...
- SQL Server on Linux: How? Introduction: SQL Server Blog
SQL Server Blog Official News from Microsoft’s Information Platform https://blogs.technet.microsoft. ...
- 使用WinDbg调试SQL Server查询
上一篇文章我给你介绍了WinDbg的入门,还有你如何能附加到SQL Server.今天的文章,我们继续往前一步,我会向你展示使用WinDbg调试SQL Server查询需要的步骤.听起来很有意思?我们 ...
- 无法Debug SQL: Unable to start T-SQL Debugging. Could not attach to SQL Server process on
今天SSMS debug SQL当脚本,突然错误: Unable to start T-SQL Debugging. Could not attach to SQL Server process on ...
- Quick Introduction to SQL Server Profiler
Introduction to Profiler SQL Server Profiler — or just Profiler — is a tool that can help monitor al ...
- 如何设断点????-----使用WinDbg调试SQL Server查询
http://www.cnblogs.com/woodytu/p/4665427.html http://www.sqlservercentral.com/blogs/aschenbrenner/20 ...
- 《Pro SQL Server Internals, 2nd edition》的CHAPTER 3 Statistics中的Introduction to SQL Server Statistics、Statistics and Execution Plans、Statistics Maintenance(译)
<Pro SQL Server Internals> 作者: Dmitri Korotkevitch 出版社: Apress出版年: 2016-12-29页数: 804定价: USD 59 ...
- Introduction to Locking in SQL Server
Locking is a major part of every RDBMS and is important to know about. It is a database functionalit ...
随机推荐
- phpstorm将本地代码传递到远程服务器
由于对vim不太熟悉,效率比较低,作为过渡阶段,采用本地编写代码,然后上传到开发机上,进行调试 前提是服务器开启了ftp服务:http://www.cnblogs.com/redirect/p/693 ...
- laravel5.2总结--软删除
当模型被软删除时,它们并不会真的从数据库中被移除.而是会在模型上设置一个 deleted_at 属性并将其添加到数据库.如果对应模型被软删除,则deleted_at字段的值为删除时间,否则该值为空. ...
- dcpromo(server2012不支持)
dcpromo 编辑 dcpromo命令是一个“开关”命令.如果Windows 2000 Server计算机是成员服务器,则 运行dcpromo命令会安装活动目录,将其升级为域控制器:如果Window ...
- 深入浅出Hyper-V网络虚拟化(序)
服务器虚拟化已经越来越普及,很多企业也都在尝试着将现有业务转换成虚拟化的方式来运行,即在一个物理服务器上虚拟出多个实例,而每个实例彼此隔离,就好像在使用一台真实主机一样:网络虚拟化也同样如此,在同一条 ...
- STL学习笔记3--deque
看这一节,是为了下一节的使用,在ogre3d里有些操作要使用到deque. C++ Deque(双向队列) 的使用 Deque结合了vector 和list 优缺点,是一种使用简单的容器. deq ...
- sql注入过滤了#,--+怎么办
题目是NCTF2018的web题目 第一段是错误的思路,第二段是晚上有思考后发现的直接看第二段吧. ① ?id=1'会直接出来报错提示. 猜测使用单引号保护id. 另外一打空格就提示you hacke ...
- python-侦测系统
大概就是这样 要求 告警需要一定之间内出现多次 然后才报警一次 如果恢复 必须发送恢复的信息
- Unity3D_异步加载场景(进度条)
创建两个场景:现在的场景“NowScene”,要加载的场景“LoadScene”: “NowScene”如图所示,“LoadScene”任意: 创建脚本“AsyncLoadScene”,复制如下代码, ...
- javascript原生360 开机小动画
<!DOCTYPE html> <html> <head lang="en"> <meta charset="UTF-8&quo ...
- java 数据库连接 驱动相关参数
mysql: driverClass=com.mysql.jdbc.Driver connectionURL=jdbc:mysql://localhost:3306/shiro userId=root ...