《DSP using MATLAB》示例 Example 9.14
代码:
%% ------------------------------------------------------------------------

%%            Output Info about this m-file

fprintf('\n***********************************************************\n');

fprintf('        <DSP using MATLAB> Exameple 9.14 \n\n');

time_stamp = datestr(now, 31);

[wkd1, wkd2] = weekday(today, 'long');

fprintf('      Now is %20s, and it is %7s  \n\n', time_stamp, wkd2);

%% ------------------------------------------------------------------------

% Given Parameters:

D = 2; Rp = 0.1; As = 50; wxp = pi/8; wxs = pi/D; wp = wxp; ws = (2*pi/D)-wxs;

% Filter Design:

[delta1, delta2] = db2delta(Rp, As);

[N, F, A, weights] = firpmord([wp, ws]/pi, [1, 0], [delta1, delta2], 2); N = ceil(N/2)*2;

h = firpm(N, F, A, weights);

delay = N/2;                        % delay imparted by the filter

%% -----------------------------------------------------------------

%%                             Plot

%% -----------------------------------------------------------------

% Input signal x(n) = cos(2*pi*n/16)

n = [0:256]; x = cos(pi*n/8);

n1 = n(1:33); x1 = x(33:65);            % for plotting purposes

Hf1 = figure('units', 'inches', 'position', [1, 1, 8, 6], ...

	'paperunits', 'inches', 'paperposition', [0, 0, 6, 4], ...

	'NumberTitle', 'off', 'Name', 'Exameple 9.14');

set(gcf,'Color','white');

TF = 10;

subplot(2, 2, 1);

Hs1 = stem(n1, x1, 'filled'); set(Hs1, 'markersize', 2, 'color', 'g');

axis([-2, 34, -1.2, 1.2]); grid on;

xlabel('n', 'vertical', 'middle'); ylabel('Amplitude', 'vertical', 'middle');

title('Input Singal: x(n) = cos(\pin/8) ', 'fontsize', TF, 'vertical', 'baseline');

set(gca, 'xtick', [0:8:32]);

set(gca, 'ytick', [-1, 0, 1]);

% Decimation of x(n): D = 2

y = upfirdn(x, h, 1, D);

m = delay+1:1:128/D+delay+1; y1 = y(m); m = 0:16; y1 = y1(14:30);

subplot(2, 2, 3);

Hs2 = stem(m, y1, 'filled'); set(Hs2, 'markersize', 2, 'color', 'm');

axis([-1, 17, -1.2, 1.2]); grid on;

xlabel('m', 'vertical', 'middle'); ylabel('Amplitude', 'vertical', 'middle');

title('Output Singal: y(n): D=2', 'fontsize', TF, 'vertical', 'baseline');

set(gca, 'xtickmode', 'manual', 'xtick', [0:8:32]/D);

set(gca, 'ytickmode', 'manual', 'ytick', [-1, 0, 1]);

% Filter Design Plots

[Hr, w, a, L] = Hr_Type1(h); Hr_min = min(Hr); w_min = find(Hr == Hr_min);

H = abs(freqz(h, 1, w)); Hdb = 20*log10(H/max(H)); min_attn = Hdb(w_min);

subplot(2, 2, 2);

plot(w/pi, Hr, 'm', 'linewidth', 1.0); axis([0, 1, -0.1, 1.1]); grid on;

xlabel('Frequency in \pi units', 'fontsize', TF, 'vertical', 'middle');

ylabel('Amplitude', 'vertical', 'cap');

title('Amplitude Response', 'fontsize', TF, 'vertical', 'baseline');

set(gca, 'xtick', [0, wp/pi, ws/pi, 1], 'ytick', [0, 1]);

subplot(2, 2, 4);

plot(w/pi, Hdb, 'm', 'linewidth', 1.0); axis([0, 1, -60, 10]); grid on;

xlabel('Frequency in \pi units', 'fontsize', TF, 'vertical', 'middle');

ylabel('Decibels', 'vertical', 'cap');

title('Log-magnitude Response', 'fontsize', TF, 'vertical', 'baseline');

set(gca, 'xtick', [0, wp/pi, ws/pi, 1], 'ytick', [-60, round(min_attn), 0]);
运行结果:
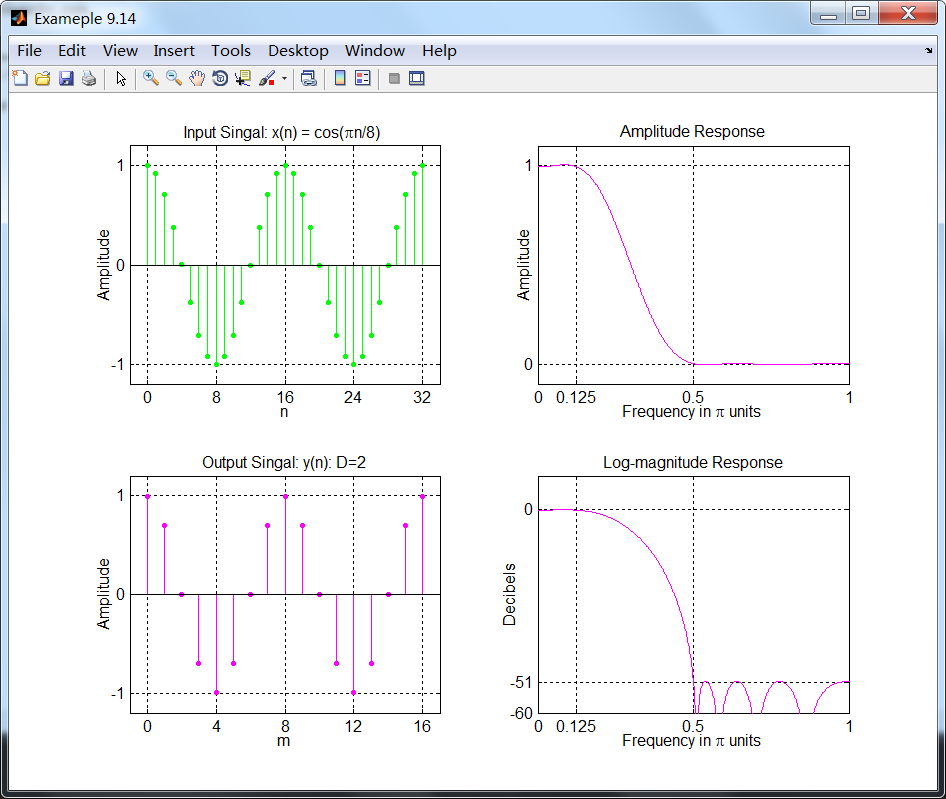
设计的滤波器达到51dB的衰减,并且减采样的信号是正确的。
《DSP using MATLAB》示例 Example 9.14的更多相关文章
- 《DSP using MATLAB》Problem 7.14
代码: %% ++++++++++++++++++++++++++++++++++++++++++++++++++++++++++++++++++++++++++++++++ %% Output In ...
- 《DSP using MATLAB》Problem 6.14
代码: %% ++++++++++++++++++++++++++++++++++++++++++++++++++++++++++++++++++++++++++++++++ %% Output In ...
- 《DSP using MATLAB》Problem 5.14
说明:这两个小题的数学证明过程都不会,欢迎博友赐教. 直接上代码: %% +++++++++++++++++++++++++++++++++++++++++++++++++++++++++++++++ ...
- 《DSP using MATLAB》Problem 4.14
代码: %% ---------------------------------------------------------------------------- %% Output Info a ...
- 《DSP using MATLAB》Problem 2.14
代码: %% ------------------------------------------------------------------------ %% Output Info about ...
- 《DSP using MATLAB》Problem 8.14
代码: %% ------------------------------------------------------------------------ %% Output Info about ...
- DSP using MATLAB 示例Example3.21
代码: % Discrete-time Signal x1(n) % Ts = 0.0002; n = -25:1:25; nTs = n*Ts; Fs = 1/Ts; x = exp(-1000*a ...
- DSP using MATLAB 示例 Example3.19
代码: % Analog Signal Dt = 0.00005; t = -0.005:Dt:0.005; xa = exp(-1000*abs(t)); % Discrete-time Signa ...
- DSP using MATLAB示例Example3.18
代码: % Analog Signal Dt = 0.00005; t = -0.005:Dt:0.005; xa = exp(-1000*abs(t)); % Continuous-time Fou ...
- DSP using MATLAB 示例Example3.23
代码: % Discrete-time Signal x1(n) : Ts = 0.0002 Ts = 0.0002; n = -25:1:25; nTs = n*Ts; x1 = exp(-1000 ...
随机推荐
- Console 窗口
Console窗口 记住,即是在GUI程序中你也可以拥有一个Console窗口.----这意味着你可以再GUI程序中使用printf.puts. Console窗口由系统的驱动设备程序负责,即是你的程 ...
- php \r \n 和 <br/> \t
利用\r \n 和 <br/> \t做了个实验,话不多说,看代码就很清楚的知道
- 22. Generate Parentheses(回溯)
Given n pairs of parentheses, write a function to generate all combinations of well-formed parenthes ...
- EditPlus 4.3.2487 中文版已经发布(11月12日更新)
新的版本修复了粘贴多重选择文本的问题,以及增加了横向扩展列选模式选择范围的快捷键(Ctrl+Alt+→/←).
- appium问题解决
ppium 1.4.16 版本 测试安卓7.0 提示AppiumSettings.Unlock.AndroidInputManager 安装 修改 C:\Program Files (x86)\App ...
- Vue学习笔记之Vue指令系统介绍
所谓指令系统,大家可以联想咱们的cmd命令行工具,只要我输入一条正确的指令,系统就开始干活了. 在vue中,指令系统,设置一些命令之后,来操作我们的数据属性,并展示到我们的DOM上. OK,接下来我们 ...
- Tomcat启动报错:StandardServer.await: create[8005] java.net.BindException: Cannot assign requested address
Tomcat启动报错:StandardServer.await: create[8005] java.net.BindException: Cannot assign requested addres ...
- 解决方案--duilib中edit获得鼠标焦点后右边框被覆盖
用duilib做了一个登录框,用户名的输入使用的是edit控件. XML中是这样写的: <Edit name="subdomain_edit" tipvalue=" ...
- autofac 在webapi中拿到当前request的scope
https://stackoverflow.com/questions/31321386/autofac-web-api-get-current-scope Unless you are usin ...
- [Pytorch]Pytorch加载预训练模型(转)
转自:https://blog.csdn.net/Vivianyzw/article/details/81061765 东风的地方 1. 直接加载预训练模型 在训练的时候可能需要中断一下,然后继续训练 ...