c# Winform Chart入门
额外参考链接:http://www.cnblogs.com/greenerycn/archive/2008/10/27/microsoft-chart.html
winform 仪表盘相关下载链接://download.csdn.net/download/floweroflvoe/10432601?utm_source=bbsseo
首先添加引用System.Windows.Forms.DataVisualization,添加引用后,工具面板上将在数据中显示Chart,可直接拖拽到界面上。
代码中添加UsingSystem.Windows.Forms.DataVisualization.Charting;

1. 当拖拽Chart到界面上时,一般来说Chart及其ChartAreas、Legend部分的背景为白色,我们可以分别通过各自的BackColor设置为透明或其他颜色。
通过设置Series的ChartType属性来选择图表类型,一般常用:折线Line,柱状图Column,饼状图Pie,雷达图Redar等等。
2. 设置ChartAreas属性
ct.ChartAreas.Add(new ChartArea() { Name = "ca1" }); //背景框
ct.ChartAreas[0].Axes[0].MajorGrid.Enabled = false; //X轴上网格
ct.ChartAreas[0].Axes[1].MajorGrid.Enabled = false; //y轴上网格
ct.ChartAreas[0].Axes[0].MajorGrid.LineDashStyle = ChartDashStyle.Dash; //网格类型 短横线
ct.ChartAreas[0].Axes[0].MajorGrid.LineColor = Color.Gray;
ct.ChartAreas[0].Axes[0].MajorTickMark.Enabled = false; // x轴上突出的小点
ct.ChartAreas[0].Axes[1].MajorTickMark.Enabled = false; //
ct.ChartAreas[0].Axes[1].IsInterlaced = true; //显示交错带
ct.ChartAreas[0].Axes[0].LabelStyle.Format = "#年"; //设置X轴显示样式
ct.ChartAreas[0].Axes[1].MajorGrid.LineDashStyle = ChartDashStyle.Dash; //网格类型 短横线
ct.ChartAreas[0].Axes[1].MajorGrid.LineColor = Color.Blue;
ct.ChartAreas[0].Axes[1].MajorGrid.LineWidth = 3;
ct.ChartAreas[0].BackColor = System.Drawing.Color.Transparent; //设置区域内背景透明
3. 设置值Series
//添加的两组Test数据
List<int> txData2 = new List<int>() { 2011, 2012, 2013, 2014, 2015, 2016 };
List<int> tyData2 = new List<int>() { 9, 6, 7, 4, 5, 4 };
List<int> txData3 = new List<int>() { 2012 };
List<int> tyData3 = new List<int>() { 7 };
ct.Series.Add(new Series()); //添加一个图表序列
// ct.Series[0].XValueType = ChartValueType.String; //设置X轴上的值类型
ct.Series[0].Label = "#VAL"; //设置显示X Y的值
ct.Series[0].ToolTip = "#VALX年\r#VAL"; //鼠标移动到对应点显示数值
ct.Series[0].ChartArea = ct.ChartAreas[0].Name; //设置图表背景框ChartArea
ct.Series[0].ChartType = SeriesChartType.Line; //图类型(折线)
ct.Series[0].Points.DataBindXY(txData2, tyData2); //添加数据
//折线段配置
ct.Series[0].Color = Color.Red; //线条颜色
ct.Series[0].BorderWidth = 3; //线条粗细
ct.Series[0].MarkerBorderColor = Color.Red; //标记点边框颜色
ct.Series[0].MarkerBorderWidth = 3; //标记点边框大小
ct.Series[0].MarkerColor = Color.Red; //标记点中心颜色
ct.Series[0].MarkerSize = 5; //标记点大小
ct.Series[0].MarkerStyle = MarkerStyle.Circle; //标记点类型
ct.Series.Add(new Series()); //添加一个图表序列
ct.Series[1].Label = "#VAL"; //设置显示X Y的值
ct.Series[1].ToolTip = "#VALX年\r#VAL"; //鼠标移动到对应点显示数值
ct.Series[1].ChartArea = "ca1"; //选择显示的ChartArea ,如果和其他的Series选择是同一个ChartArea,则在同一个区域中显示对比
ct.Series[1].ChartType = SeriesChartType.Line; //图类型(折线)
ct.Series[1].Points.DataBindXY(txData3, tyData3); //添加数据
//折线段配置
ct.Series[1].Color = Color.Black; //线条颜色
ct.Series[1].BorderWidth = 3; //线条粗细
ct.Series[1].MarkerBorderColor = Color.Black; //标记点边框颜色
ct.Series[1].MarkerBorderWidth = 3; //标记点边框大小
ct.Series[1].MarkerColor = Color.Black; //标记点中心颜色
ct.Series[1].MarkerSize = 5; //标记点大小
ct.Series[1].MarkerStyle = MarkerStyle.Circle; //标记点类型
4.其他ChartType的特殊设置
//饼图说明设置,这用来设置饼图每一块的信息显示在什么地方
ct.Series[0]["PieLabelStyle"] = "Outside";//将文字移到外侧
ct.Series[0]["PieLineColor"] = "Black";//绘制黑色的连线。
//柱状图其他设置
ct.Series[0]["DrawingStyle"] = "Emboss"; //设置柱状平面形状
ct.Series[0]["PointWidth"] = "0.5"; //设置柱状大小
5. 几种ChartType展示
 |
 |
 |
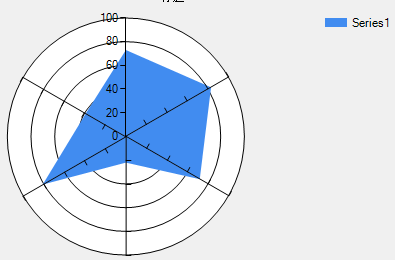 |
| 折线图-Line | 柱状图-Column | 饼状图-Pie | 雷达图-Redar |
 |
 |
 |
|
| Spline | Bar | Doughnut |
c# Winform Chart入门的更多相关文章
- c# winform Chart Pie 中若X轴数据为字符串时,#VALX取值为0
https://q.cnblogs.com/q/83848/ 在winform程序中用自带的Chart进行画图表时,若画饼图,其中X轴数据为字符串,这时候如果想设置Label值的格式为#VALX:#V ...
- Winform Chart
Chart图表解释说明: 第一步:使用VS创建Winform项目: 第二步:工具箱中拖入Chart控件: 第三步:所有控件拖入其他控件如下图所示: using System; using System ...
- WPFTookit Chart 入门
如何使用WPFToolKit Chart private void button1_Click(object sender, EventArgs e) { var s = new Series(); ...
- winform Chart控件 获取鼠标处坐标值方法
Chart控件本身功能强大,应用广泛,因此其属性.方法也很多.此处介绍在很多应用中需要查看鼠标位置处坐标值的一些方法 1,调用Chart事件 GetToolTip 利用ToolTipEventArg ...
- WPF 使用WinForm Chart控件
第一步: 页面 首先引用命名空间 xmlns:wfi="clr-namespace:System.Windows.Forms.Integration;assembly=WindowsFor ...
- 使用WinForm Chart控件 制作饼装,柱状,折线图
http://blog.csdn.net/dream2050csdn/article/details/53510340 chart控件的属性很多,主要用到Chart控件图表区域的属性有五个属性 1.A ...
- Winform开发入门集中培训系列文章
最近有个培训,写PPT不如写博客了,共享是程序猿的职业情操吧,因此,本人准备写一个Winform开发的系列文章,对于初级开发者来说,应该比较有用,写作当中不免错误或不成熟的地方,看到的朋友请留言指出, ...
- 【207】WinForm Chart类
目录: 在工具箱中找到 Chart 控件并使用 设置 Chart 属性 代码中设置属性 属性中设置属性 Chart 类说明 ChartAreas ChartAreaCollection 类 Chart ...
- C#的winform编程入门简单介绍
C#中事件.事件委托.事件的订阅 例子: using System.Timers; Timer t1 = new Timer(); t1.Tick += new EventHandler(XX); p ...
随机推荐
- Mysql复制一个数据库到另一个数据库
mysqldump -u root -p source_db > /home/db_bak.sql #导出数据库 123456 #输入数据库密码 扩展: mysqldump -u root -p ...
- volatile CAS区别
- 利用multiprocessing.managers开发跨进程生产者消费者模型
研究了下multiprocessing.managers,略有收获,随笔一篇: 核心思路是构造一个manager进程,这个进程可以通过unix socket或tcp socket与其它进程通信:因为利 ...
- java线程学习之wait方法
wait 等待方法是让线程进入等待队列,使用方法是 obj.wait(); 这样当前线程就会暂停运行,并且进入obj的等待队列中,称作“线程正在obj上等待”. 如果线程想执行 wait 方法,线程必 ...
- 关于Python的协程问题总结
协程其实就是可以由程序自主控制的线程 在python里主要由yield 和yield from 控制,可以通过生成者消费者例子来理解协程 利用yield from 向生成器(协程)传送数据# 传统的生 ...
- 手推C3算法
C3算法规则 -- 每一个类的继承顺序都是从基类向子类看 -- 形成一个指向关系的顺序[当前类] + [父类的继承顺序] -- 进行一个提取 -- 如果一个类出现从左到右的第一个顺序上,并且没有出现在 ...
- jenkins 启动被杀死
1.重设环境变量build_id 在execute shell输入框中加入BUILD_ID=DONTKILLME,即可防止jenkins杀死启动的tomcat进程 2.在启动jenkins 的时候禁止 ...
- day07数据类型的相互转化,字符编码
复习 ''' 1.深浅拷贝 ls = [1, 'a', [10]] 值拷贝:直接赋值 ls1 = ls, ls中的任何值发生改变,ls1中的值都会随之改变 浅拷贝:通过copy()方法 ls2 = l ...
- spring-IoC的配置文件applicationContext.XML
<?xml version="1.0" encoding="UTF-8"?><beans xmlns="http://www.spr ...
- HDU4514 湫湫系列故事——设计风景线 ——树的直径/树形dp+判环
中文题面,给出一个图,问能不能成环,如果可以就输出YES.否则输出该树的直径. 这里的判环我们用路径压缩的并查集就能很快的判断出来,可以在输入的同时进行判断.这题重点就是求树的直径. 树直径的性质可以 ...