《DSP using MATLAB》示例Example4.11
代码:
b = [1, 0]; a = [1, -0.9]; % %% ----------------------------------------------
%% START a determine H(z) and sketch
%% ----------------------------------------------
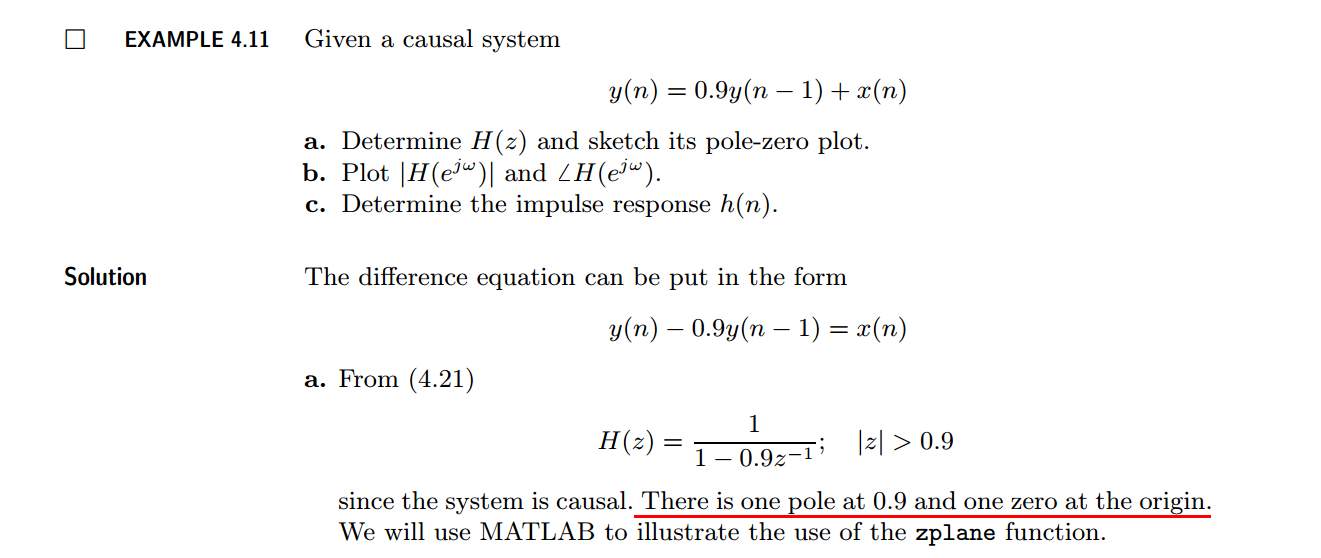
figure('NumberTitle', 'off', 'Name', 'Example4.11a H(z) its pole-zero plot')
set(gcf,'Color','white');
zplane(b,a);
title('pole-zero plot'); grid on; %% ----------------------------------------------
%% END
%% ---------------------------------------------- %% --------------------------------------------------------------
%% START b |H| <H
%% 1st form of freqz
%% --------------------------------------------------------------
[H,w] = freqz(b,a,100); % 1st form of freqz magH = abs(H); angH = angle(H); realH = real(H); imagH = imag(H); %% ================================================
%% START H's mag ang real imag
%% ================================================
figure('NumberTitle', 'off', 'Name', 'Example4.11b H its mag ang real imag');
set(gcf,'Color','white');
subplot(2,2,1); plot(w/pi,magH); grid on; %axis([0,1,0,1.5]);
title('Magnitude Response');
xlabel('frequency in \pi units'); ylabel('Magnitude |H|');
subplot(2,2,3); plot(w/pi, angH/pi); grid on; % axis([-1,1,-1,1]);
title('Phase Response');
xlabel('frequency in \pi units'); ylabel('Radians/\pi'); subplot('2,2,2'); plot(w/pi, realH); grid on;
title('Real Part');
xlabel('frequency in \pi units'); ylabel('Real');
subplot('2,2,4'); plot(w/pi, imagH); grid on;
title('Imaginary Part');
xlabel('frequency in \pi units'); ylabel('Imaginary');
%% ==================================================
%% END H's mag ang real imag
%% ================================================== %% ---------------------------------------------------------------
%% END b |H| <H
%% --------------------------------------------------------------- %% --------------------------------------------------------------
%% START b |H| <H
%% 2nd form of freqz
%% --------------------------------------------------------------
[H,w] = freqz(b,a,200,'whole'); % 2nd form of freqz magH = abs(H(1:101)); angH = angle(H(1:101)); realH = real(H); imagH = imag(H); %% ================================================
%% START H's mag ang real imag
%% ================================================
figure('NumberTitle', 'off', 'Name', 'Example4.11b using 2nd form freqz ');
set(gcf,'Color','white');
subplot(2,2,1); plot(w/pi,magH); grid on; %axis([0,1,0,1.5]);
title('Magnitude Response');
xlabel('frequency in \pi units'); ylabel('Magnitude |H|');
subplot(2,2,3); plot(w/pi, angH/pi); grid on; % axis([-1,1,-1,1]);
title('Phase Response');
xlabel('frequency in \pi units'); ylabel('Radians/\pi'); subplot('2,2,2'); plot(w/pi, realH); grid on;
title('Real Part');
xlabel('frequency in \pi units'); ylabel('Real');
subplot('2,2,4'); plot(w/pi, imagH); grid on;
title('Imaginary Part');
xlabel('frequency in \pi units'); ylabel('Imaginary');
%% ==================================================
%% END H's mag ang real imag
%% ================================================== %% ---------------------------------------------------------------
%% END b |H| <H
%% --------------------------------------------------------------- %% --------------------------------------------------------------
%% START b |H| <H
%% 3rd form of freqz
%% --------------------------------------------------------------
w = [0:1:100]*pi/100; H = freqz(b,a,w);
%[H,w] = freqz(b,a,200,'whole'); % 3rd form of freqz magH = abs(H); angH = angle(H); realH = real(H); imagH = imag(H); %% ================================================
%% START H's mag ang real imag
%% ================================================
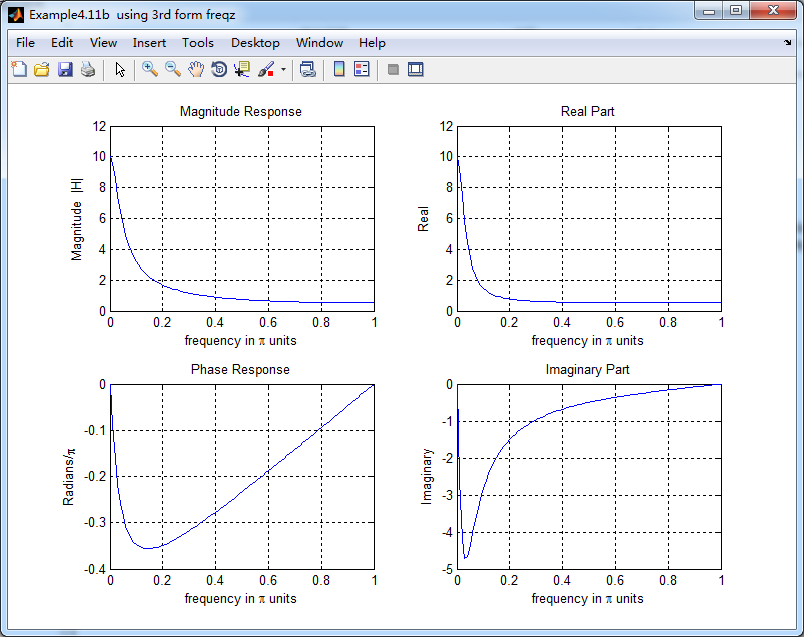
figure('NumberTitle', 'off', 'Name', 'Example4.11b using 3rd form freqz ');
set(gcf,'Color','white');
subplot(2,2,1); plot(w/pi,magH); grid on; %axis([0,1,0,1.5]);
title('Magnitude Response');
xlabel('frequency in \pi units'); ylabel('Magnitude |H|');
subplot(2,2,3); plot(w/pi, angH/pi); grid on; % axis([-1,1,-1,1]);
title('Phase Response');
xlabel('frequency in \pi units'); ylabel('Radians/\pi'); subplot('2,2,2'); plot(w/pi, realH); grid on;
title('Real Part');
xlabel('frequency in \pi units'); ylabel('Real');
subplot('2,2,4'); plot(w/pi, imagH); grid on;
title('Imaginary Part');
xlabel('frequency in \pi units'); ylabel('Imaginary');
%% ==================================================
%% END H's mag ang real imag
%% ================================================== %% ---------------------------------------------------------------
%% END b |H| <H
%% ---------------------------------------------------------------
结果:

《DSP using MATLAB》示例Example4.11的更多相关文章
- DSP using MATLAB 示例 Example3.11
用到的性质 上代码: n = -5:10; x = rand(1,length(n)); k = -100:100; w = (pi/100)*k; % freqency between -pi an ...
- DSP using MATLAB 示例Example2.11
上代码: b = [1]; a = [1, -1, 0.9]; n = [-20:120]; h = impz(b,a,n); set(gcf,'Color','white'); %subplot(2 ...
- DSP using MATLAB 示例Example3.21
代码: % Discrete-time Signal x1(n) % Ts = 0.0002; n = -25:1:25; nTs = n*Ts; Fs = 1/Ts; x = exp(-1000*a ...
- DSP using MATLAB 示例 Example3.19
代码: % Analog Signal Dt = 0.00005; t = -0.005:Dt:0.005; xa = exp(-1000*abs(t)); % Discrete-time Signa ...
- DSP using MATLAB示例Example3.18
代码: % Analog Signal Dt = 0.00005; t = -0.005:Dt:0.005; xa = exp(-1000*abs(t)); % Continuous-time Fou ...
- DSP using MATLAB 示例Example3.8
代码: x = rand(1,11); n = 0:10; k = 0:500; w = (pi/500)*k; % [0,pi] axis divided into 501 points. X = ...
- DSP using MATLAB 示例Example3.7
上代码: x1 = rand(1,11); x2 = rand(1,11); n = 0:10; alpha = 2; beta = 3; k = 0:500; w = (pi/500)*k; % [ ...
- DSP using MATlAB 示例Example2.10
上代码 % noise sequence 1 x = [3, 11, 7, 0, -1, 4, 2]; nx = [-3:3]; % given signal x(n) [y,ny] = sigshi ...
- DSP using MATLAB 示例Example3.23
代码: % Discrete-time Signal x1(n) : Ts = 0.0002 Ts = 0.0002; n = -25:1:25; nTs = n*Ts; x1 = exp(-1000 ...
随机推荐
- VC++ LoadLibrary失败,错误126(找不到指定的模块)
在VS中调用一个资源模块dll,LoadLibrary返回值为NULL,没有加载成功.GetLastError后原因为"找不到指定的模块"!代码如下: HINSTANCE hIns ...
- 仿美团外卖,饿了吗 两个ListView联动,左边点击切换右边,右边滑动切换左边
先上效果图: 实现思路: 1.先说右边标题: 首先,右边的数据源集合中的Javabean中含有三个属性name,type,title,而每个条目中会默认含有一个标题. 如果这是第一个条目,就让标题显示 ...
- php处理图片实现
<?php include("SimpleImage.php");//图片处理类在下面 $url="http://f3.v.veimg.cn/meadincms/1 ...
- IFC
IFC是设计师使用的软件,然后存储的格式. 这个适用于精细的设计.
- python基础——多重继承
python基础——多重继承 继承是面向对象编程的一个重要的方式,因为通过继承,子类就可以扩展父类的功能. 回忆一下Animal类层次的设计,假设我们要实现以下4种动物: Dog - 狗狗: Bat ...
- STL_advance distance prev next
template<class InputIterator> typename iterator_traits<InputIterator>::difference_type d ...
- 恶趣味小游戏 I'm hungry
之前学算法的时候无聊做了个游戏放松放松,现在传到了github以免电脑坏了就永远丢失了... github地址:https://github.com/BenDanChen/IamHungry I am ...
- jQuery和JS原生方法对比
- PHP中 字符串 常用函数
//strpos 查找字符串中是否含有字符 $str='abcde'; $char='a': if(strpos($str,$char) !==false){ echo '含有',$c ...
- Linux性能分析工具的安装和使用
转自:http://blog.chinaunix.net/uid-26488891-id-3118279.html Normal 0 7.8 磅 0 2 false false false EN-US ...