《DSP using MATLAB》示例Example4.11
代码:
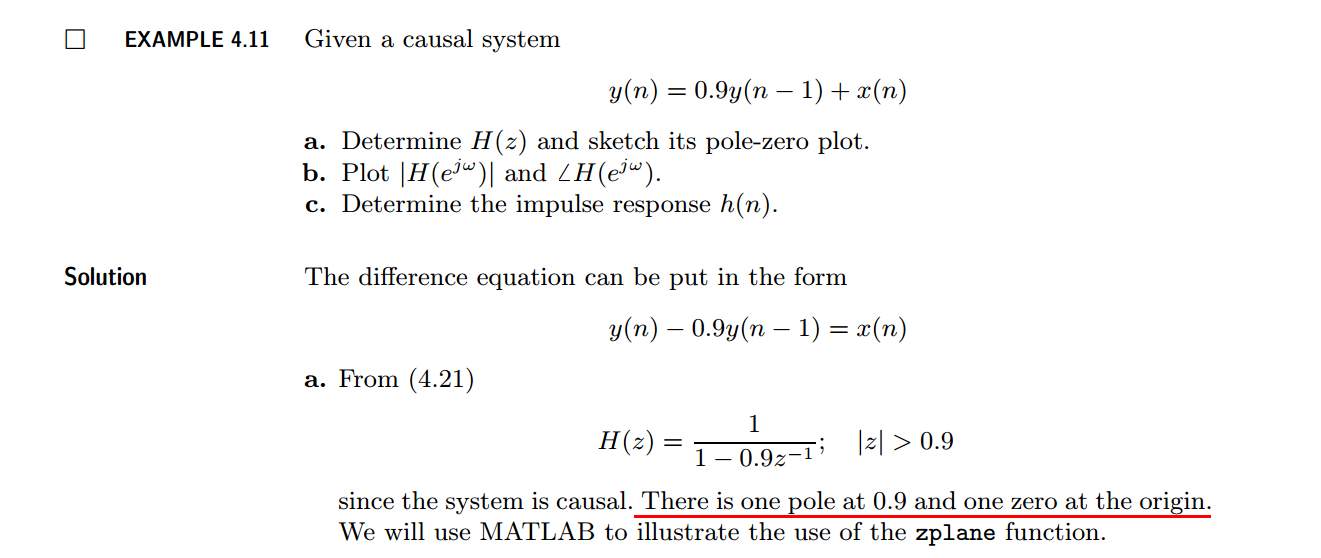
b = [1, 0]; a = [1, -0.9]; % %% ----------------------------------------------
%% START a determine H(z) and sketch
%% ----------------------------------------------
figure('NumberTitle', 'off', 'Name', 'Example4.11a H(z) its pole-zero plot')
set(gcf,'Color','white');
zplane(b,a);
title('pole-zero plot'); grid on; %% ----------------------------------------------
%% END
%% ---------------------------------------------- %% --------------------------------------------------------------
%% START b |H| <H
%% 1st form of freqz
%% --------------------------------------------------------------
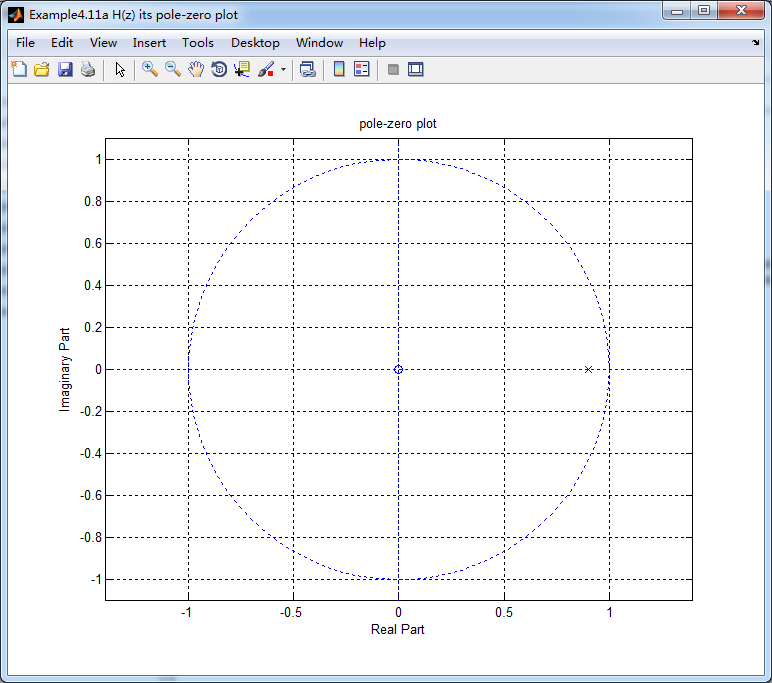
[H,w] = freqz(b,a,100); % 1st form of freqz magH = abs(H); angH = angle(H); realH = real(H); imagH = imag(H); %% ================================================
%% START H's mag ang real imag
%% ================================================
figure('NumberTitle', 'off', 'Name', 'Example4.11b H its mag ang real imag');
set(gcf,'Color','white');
subplot(2,2,1); plot(w/pi,magH); grid on; %axis([0,1,0,1.5]);
title('Magnitude Response');
xlabel('frequency in \pi units'); ylabel('Magnitude |H|');
subplot(2,2,3); plot(w/pi, angH/pi); grid on; % axis([-1,1,-1,1]);
title('Phase Response');
xlabel('frequency in \pi units'); ylabel('Radians/\pi'); subplot('2,2,2'); plot(w/pi, realH); grid on;
title('Real Part');
xlabel('frequency in \pi units'); ylabel('Real');
subplot('2,2,4'); plot(w/pi, imagH); grid on;
title('Imaginary Part');
xlabel('frequency in \pi units'); ylabel('Imaginary');
%% ==================================================
%% END H's mag ang real imag
%% ================================================== %% ---------------------------------------------------------------
%% END b |H| <H
%% --------------------------------------------------------------- %% --------------------------------------------------------------
%% START b |H| <H
%% 2nd form of freqz
%% --------------------------------------------------------------
[H,w] = freqz(b,a,200,'whole'); % 2nd form of freqz magH = abs(H(1:101)); angH = angle(H(1:101)); realH = real(H); imagH = imag(H); %% ================================================
%% START H's mag ang real imag
%% ================================================
figure('NumberTitle', 'off', 'Name', 'Example4.11b using 2nd form freqz ');
set(gcf,'Color','white');
subplot(2,2,1); plot(w/pi,magH); grid on; %axis([0,1,0,1.5]);
title('Magnitude Response');
xlabel('frequency in \pi units'); ylabel('Magnitude |H|');
subplot(2,2,3); plot(w/pi, angH/pi); grid on; % axis([-1,1,-1,1]);
title('Phase Response');
xlabel('frequency in \pi units'); ylabel('Radians/\pi'); subplot('2,2,2'); plot(w/pi, realH); grid on;
title('Real Part');
xlabel('frequency in \pi units'); ylabel('Real');
subplot('2,2,4'); plot(w/pi, imagH); grid on;
title('Imaginary Part');
xlabel('frequency in \pi units'); ylabel('Imaginary');
%% ==================================================
%% END H's mag ang real imag
%% ================================================== %% ---------------------------------------------------------------
%% END b |H| <H
%% --------------------------------------------------------------- %% --------------------------------------------------------------
%% START b |H| <H
%% 3rd form of freqz
%% --------------------------------------------------------------
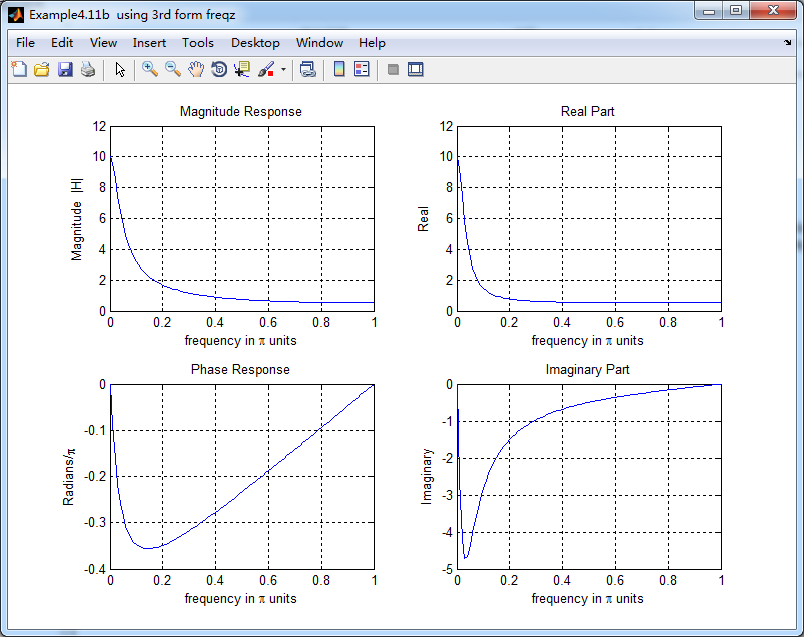
w = [0:1:100]*pi/100; H = freqz(b,a,w);
%[H,w] = freqz(b,a,200,'whole'); % 3rd form of freqz magH = abs(H); angH = angle(H); realH = real(H); imagH = imag(H); %% ================================================
%% START H's mag ang real imag
%% ================================================
figure('NumberTitle', 'off', 'Name', 'Example4.11b using 3rd form freqz ');
set(gcf,'Color','white');
subplot(2,2,1); plot(w/pi,magH); grid on; %axis([0,1,0,1.5]);
title('Magnitude Response');
xlabel('frequency in \pi units'); ylabel('Magnitude |H|');
subplot(2,2,3); plot(w/pi, angH/pi); grid on; % axis([-1,1,-1,1]);
title('Phase Response');
xlabel('frequency in \pi units'); ylabel('Radians/\pi'); subplot('2,2,2'); plot(w/pi, realH); grid on;
title('Real Part');
xlabel('frequency in \pi units'); ylabel('Real');
subplot('2,2,4'); plot(w/pi, imagH); grid on;
title('Imaginary Part');
xlabel('frequency in \pi units'); ylabel('Imaginary');
%% ==================================================
%% END H's mag ang real imag
%% ================================================== %% ---------------------------------------------------------------
%% END b |H| <H
%% ---------------------------------------------------------------
结果:

《DSP using MATLAB》示例Example4.11的更多相关文章
- DSP using MATLAB 示例 Example3.11
用到的性质 上代码: n = -5:10; x = rand(1,length(n)); k = -100:100; w = (pi/100)*k; % freqency between -pi an ...
- DSP using MATLAB 示例Example2.11
上代码: b = [1]; a = [1, -1, 0.9]; n = [-20:120]; h = impz(b,a,n); set(gcf,'Color','white'); %subplot(2 ...
- DSP using MATLAB 示例Example3.21
代码: % Discrete-time Signal x1(n) % Ts = 0.0002; n = -25:1:25; nTs = n*Ts; Fs = 1/Ts; x = exp(-1000*a ...
- DSP using MATLAB 示例 Example3.19
代码: % Analog Signal Dt = 0.00005; t = -0.005:Dt:0.005; xa = exp(-1000*abs(t)); % Discrete-time Signa ...
- DSP using MATLAB示例Example3.18
代码: % Analog Signal Dt = 0.00005; t = -0.005:Dt:0.005; xa = exp(-1000*abs(t)); % Continuous-time Fou ...
- DSP using MATLAB 示例Example3.8
代码: x = rand(1,11); n = 0:10; k = 0:500; w = (pi/500)*k; % [0,pi] axis divided into 501 points. X = ...
- DSP using MATLAB 示例Example3.7
上代码: x1 = rand(1,11); x2 = rand(1,11); n = 0:10; alpha = 2; beta = 3; k = 0:500; w = (pi/500)*k; % [ ...
- DSP using MATlAB 示例Example2.10
上代码 % noise sequence 1 x = [3, 11, 7, 0, -1, 4, 2]; nx = [-3:3]; % given signal x(n) [y,ny] = sigshi ...
- DSP using MATLAB 示例Example3.23
代码: % Discrete-time Signal x1(n) : Ts = 0.0002 Ts = 0.0002; n = -25:1:25; nTs = n*Ts; x1 = exp(-1000 ...
随机推荐
- JS 循环练习
规律 大范围套小范围 循环 分支语句 switch case 嵌套 死循环 while(true) 打破循环 break continue while(true) ...
- 从API请求数据的方法(主要适用于tp5)
// 从api获取数据,$data是一个数组,默认为空,请求数据的方法可以通用,但是其它说明只适用于tp5 function postData($url,$data=''){ $ch = curl_i ...
- IOS - 控件的AutoresizingMask属性
在 UIView 中有一个autoresizingMask的属性,它对应的是一个枚举的值(如下),属性的意思就是自动调整子控件与父控件中间的位置,宽高. enum { UIViewAutoresi ...
- Ajax与Jquery题库
一. 填空题 1.在JQuery中被誉为工厂函数的是 $() . 2.在jQuery中需要选取<div>元素里所有<a>元素的选择器是 $("div a&quo ...
- 25个增强iOS应用程序性能的提示和技巧(中级篇)(3)
25个增强iOS应用程序性能的提示和技巧(中级篇)(3) 2013-04-16 14:42 破船之家 beyondvincent 字号:T | T 本文收集了25个关于可以提升程序性能的提示和技巧,分 ...
- !struct operator reload
struct t3DObject //对象信息结构体{ int numOfVerts; // 模型中顶点的数目 int numOfFaces; // 模型中面的数目 int numTexVertex; ...
- C#冒泡排序
C#最简单的冒泡排序,需要的朋友可作参考: 思路: 使用两个for循环,就可以遍历数组,这样就可以确保每个数组元素都被使用 对比前后两个数,将小的数字和大的交换位置,引入一个临时变量temp来进行交换 ...
- ASP.NET SignalR 与 LayIM2.0 配合轻松实现Web聊天室(零) 前言
前端时间听一个技术朋友说 LayIM 2.0 发布了,听到这个消息抓紧去官网看了一下.(http://layim.layui.com/)哎呀呀,还要购买授权[大家支持一下哦],果断买了企业版,喜欢钻研 ...
- 原始套接字SOCK_RAW
原始套接字SOCK_RAW 实际上,我们常用的网络编程都是在应用层的报文的收发操作,也就是大多数程序员接触到的流式套接字(SOCK_STREAM)和数据包式套接字(SOCK_DGRAM).而这些数据包 ...
- 20.策略者模式(Stragety Pattern)
using System; using System.Collections.Generic; using System.Linq; using System.Text; using System.T ...