吴裕雄 python 机器学习-Logistic(1)
import numpy as np def loadDataSet():
dataMat = []
labelMat = []
fr = open('D:\\LearningResource\\machinelearninginaction\\Ch05\\testSet.txt')
for line in fr.readlines():
lineArr = line.strip().split()
dataMat.append([1.0, float(lineArr[0]), float(lineArr[1])])
labelMat.append(int(lineArr[2]))
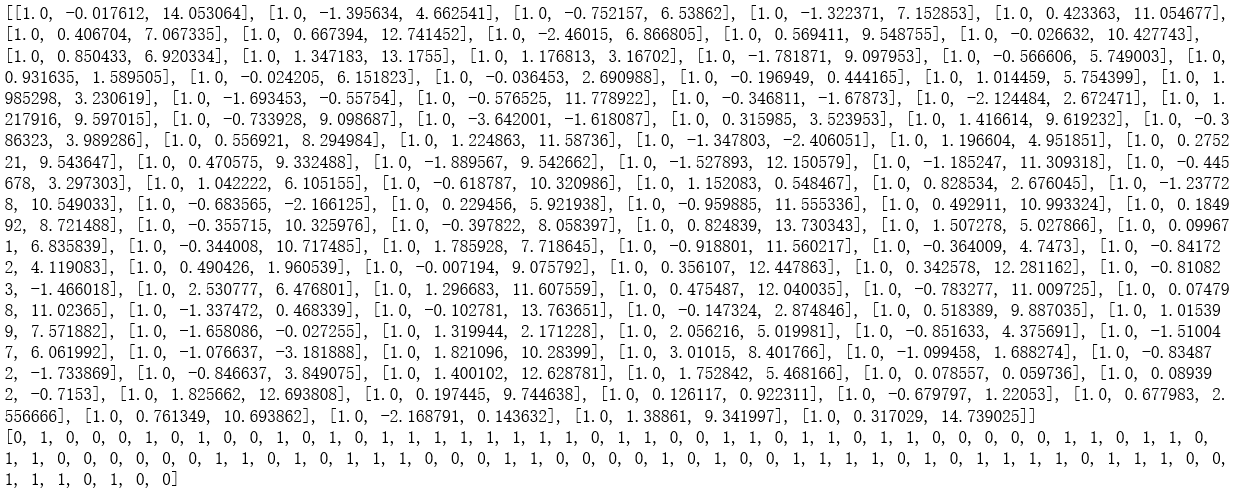
return dataMat,labelMat dataMat,labelMat = loadDataSet()
print(dataMat)
print(labelMat)
def sigmoid(z):
sigmoid = 1.0/(1+np.exp(-z))
return sigmoid def gradAscent(dataMatIn, classLabels):
dataMatrix = np.mat(dataMatIn)
labelMat = np.mat(classLabels).transpose()
m,n = np.shape(dataMatrix)
alpha = 0.001
maxCycles = 500
weights = np.ones((n,1))
for k in range(maxCycles):
h = sigmoid(dataMatrix*weights)
error = (labelMat - h)
weights = weights + alpha * dataMatrix.transpose()* error
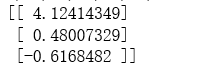
return weights weights = gradAscent(dataMat,labelMat)
print(weights)
def stocGradAscent0(dataMatrix, classLabels):

    m,n = np.shape(dataMatrix)

    alpha = 0.01

    weights = np.ones(n)

    for i in range(m):

        h = sigmoid(sum(np.array(dataMatrix[i])*weights))

        error = classLabels[i] - h

        weights = weights + alpha * error * np.array(dataMatrix[i])

    return weights

weights = stocGradAscent0(dataMat,labelMat)

print(weights)

def stocGradAscent1(dataMatrix, classLabels, numIter=150):

    m,n = np.shape(dataMatrix)

    weights = np.ones(n)

    for j in range(numIter):

        dataIndex = list(range(m))

        for i in range(m):

            alpha = 4/(1.0+j+i)+0.0001

            randIndex = int(np.random.uniform(0,len(dataIndex)))

            h = sigmoid(sum(np.array(dataMatrix[randIndex])*weights))

            error = classLabels[randIndex] - h

            weights = weights + alpha * error * np.array(dataMatrix[randIndex])

            del(dataIndex[randIndex])

    return weights

weights = stocGradAscent1(dataMat,labelMat)

print(weights)

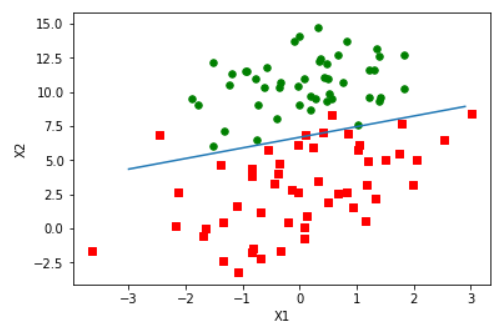
import matplotlib.pyplot as plt

def plotBestFit():

    dataMat,labelMat=loadDataSet()

    weights = gradAscent(dataMat,labelMat)

    dataArr = np.array(dataMat)

    n = np.shape(dataArr)[0]

    xcord1 = []

    ycord1 = []

    xcord2 = []

    ycord2 = []

    for i in range(n):

        if(int(labelMat[i])== 1):

            xcord1.append(dataArr[i,1])

            ycord1.append(dataArr[i,2])

        else:

            xcord2.append(dataArr[i,1])

            ycord2.append(dataArr[i,2])

    fig = plt.figure()

    ax = fig.add_subplot(111)

    ax.scatter(xcord1, ycord1, s=30, c='red', marker='s')

    ax.scatter(xcord2, ycord2, s=30, c='green')

    x = np.arange(-3.0, 3.0, 0.1)

    y = (-weights[0]-weights[1]*x)/weights[2]

    y = np.array(y).reshape(len(x))

    ax.plot(x, y)

    plt.xlabel('X1')

    plt.ylabel('X2');

    plt.show()

plotBestFit()
def classifyVector(z, weights):
prob = sigmoid(sum(z*weights))
if(prob > 0.5):
return 1.0
else:
return 0.0 def colicTest():
frTrain = open('D:\\LearningResource\\machinelearninginaction\\Ch05\\horseColicTraining.txt')
frTest = open('D:\\LearningResource\\machinelearninginaction\\Ch05\\horseColicTest.txt')
trainingSet = []
trainingLabels = []
for line in frTrain.readlines():
currLine = line.strip().split('\t')
lineArr =[]
for i in range(21):
lineArr.append(float(currLine[i]))
trainingSet.append(lineArr)
trainingLabels.append(float(currLine[21]))
trainWeights = stocGradAscent1(np.array(trainingSet), trainingLabels, 1000)
errorCount = 0
numTestVec = 0.0
for line in frTest.readlines():
numTestVec += 1.0
currLine = line.strip().split('\t')
lineArr =[]
for i in range(21):
lineArr.append(float(currLine[i]))
if(int(classifyVector(np.array(lineArr), trainWeights))!= int(currLine[21])):
errorCount += 1
errorRate = (float(errorCount)/numTestVec)
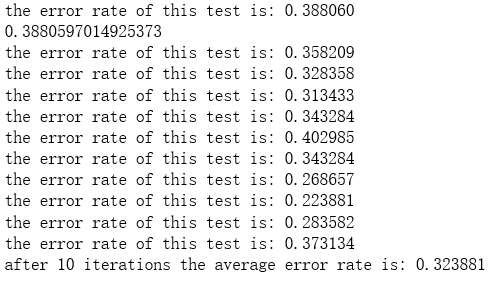
print("the error rate of this test is: %f" % errorRate)
return errorRate errorRate = colicTest()
print(errorRate) def multiTest():
numTests = 10
errorSum=0.0
for k in range(numTests):
errorSum += colicTest()
print("after %d iterations the average error rate is: %f" % (numTests, errorSum/float(numTests))) multiTest()
吴裕雄 python 机器学习-Logistic(1)的更多相关文章
- 吴裕雄 python 机器学习——人工神经网络感知机学习算法的应用
import numpy as np from matplotlib import pyplot as plt from sklearn import neighbors, datasets from ...
- 吴裕雄 python 机器学习——分类决策树模型
import numpy as np import matplotlib.pyplot as plt from sklearn import datasets from sklearn.model_s ...
- 吴裕雄 python 机器学习——回归决策树模型
import numpy as np import matplotlib.pyplot as plt from sklearn import datasets from sklearn.model_s ...
- 吴裕雄 python 机器学习——线性判断分析LinearDiscriminantAnalysis
import numpy as np import matplotlib.pyplot as plt from matplotlib import cm from mpl_toolkits.mplot ...
- 吴裕雄 python 机器学习——逻辑回归
import numpy as np import matplotlib.pyplot as plt from matplotlib import cm from mpl_toolkits.mplot ...
- 吴裕雄 python 机器学习——ElasticNet回归
import numpy as np import matplotlib.pyplot as plt from matplotlib import cm from mpl_toolkits.mplot ...
- 吴裕雄 python 机器学习——Lasso回归
import numpy as np import matplotlib.pyplot as plt from sklearn import datasets, linear_model from s ...
- 吴裕雄 python 机器学习——岭回归
import numpy as np import matplotlib.pyplot as plt from sklearn import datasets, linear_model from s ...
- 吴裕雄 python 机器学习——线性回归模型
import numpy as np from sklearn import datasets,linear_model from sklearn.model_selection import tra ...
随机推荐
- python操作符与流程控制
操作符: 算术运算: + - * / % // ** 逻辑运算:and or not 身份运算: is not is 不可变数据类型:数字 字符串 字典key 可变数据 ...
- Java笔试面试题整理第一波
转载至:http://blog.csdn.net/shakespeare001/article/details/51151650 作者:山代王(开心阳) 本系列整理Java相关的笔试面试知识点,其他几 ...
- hadoop分布式集群的搭建
电脑如果是8G内存或者以下建议搭建3节点集群,如果是搭建5节点集群就要增加内存条了.当然实际开发中不会用虚拟机做,一些小公司刚刚起步的时候会采用云服务,因为开始数据量不大. 但随着数据量的增大才会考虑 ...
- flask 简单的语音识别
from aip import AipSpeech,AipNlp #AipNlp 为自然语言处理 """ 你的 APPID AK SK """ ...
- WPF 异常其他信息: “对类型“BaseControl.KImgButton”的构造函数执行符合指定的绑定约束的调用时引发了异常。”,行号为“38”,行位置为“22”。
引发的异常:“System.Windows.Markup.XamlParseException”(位于 PresentationFramework.dll 中) 其他信息: “对类型“BaseCont ...
- NoSQL学习1
MongoDB使用C++语言编写的一个基于分布式的文件存储的开源数据库.可以在承受高负载的情况下,保证服务器的性能. MongoDB将数据存储成为一个文档,数据结构有键值对组成.类似于JSON,字段值 ...
- Android2.2+opencv3.1配置实现
来实习什么都要自己干,不仅仅要写算法,还要再Android上面跑起来.... 弄了三天才搞好,就因为一点点失误!!! 第一步:安装Android Studio2.2 安装opencv3.1 下载 ...
- maven项目里的mapper不被加载,解析
出现这个错误是因为maven加载配置文件是从resource里加载的,所以要配置一下
- Selenium2自动化测试实战(基于Python语言)— 编写第一个自动化脚本
实现效果:执行脚本后启动Firefox浏览器后进入百度主页,输入“Selenium”后,单击搜索按钮,最后关闭浏览器的过程(默认安装了Firefox浏览器),如下图所示: 脚本内容如下: # -*- ...
- python内置函数使用
print(abs(1)) #绝对值,正数就是自己 ",''])) #计算可迭代对象中是否为真,其中一个为假,就显示为假 print(all('')) # If the iterable i ...