
grafana+prometheus+loki的使用
grafana官网:https://grafana.com/zh-cn/grafana/
grafana下载:https://grafana.com/grafana/download?pg=graf&plcmt=deploy-box-1
promtheus官网:https://prometheus.io/docs/introduction/overview/
promtheus和采集服务下载:https://prometheus.io/download/
loki github地址:https://github.com/grafana/loki/
loki配置文件下载:https://raw.githubusercontent.com/grafana/loki/v1.5.0/cmd/loki/loki-local-config.yaml
loki push API:https://grafana.com/docs/loki/latest/reference/api/#push-log-entries-to-loki
1、说明
本文介绍使用grafana+prometheus+loki实现数据和日志的方法,其中数据和日志的采集使用自定义采集的方式,使用既有协议,发送到数据库源存储
- grafana负责界面展示配置
- prometheus负责数据的存储,为grafana提供数据源(exporter等应用负责数据采集)
- loki负责日志的存储,为grafana提供数据源(promtail负责日志的采集)
架构图如下:

2、grafana部署
根据对应的系统下载对应包,以二进制为例
./bin/grafana server #启动grafana
默认配置文件是 /conf/default.ini,其中 http_port 一项是服务的http访问端口
启动后,打开浏览器访问:http://127.0.0.1:3000
默认用户名和密码都是:admin,登录后会提示改密码
3、prometheus部署
prometheus 是一种时序数据库,用于存放数据,也可以作为 grafana 的数据源提供数据
3.1、自定义采集程序
下面程序以随机数示例
package collector

import (

    "github.com/prometheus/client_golang/prometheus"

    "math/rand"

)

type Test struct {

    queryCountDesc *prometheus.Desc

}

func (e *Test) Init(config *ExporterConfig) {

    e.queryCountDesc = prometheus.NewDesc(

        prometheus.BuildFQName(NAMESPACE, "", config.ExporterName), // 自定义指标名称

        config.HelpInfo,                                            // 指标的help信息

        []string{"sensor_type"},                                    //这里要和下面的metric一一对应上

        prometheus.Labels{},

    )

}

func (e *Test) Describe(ch chan<- *prometheus.Desc) {

    ch <- e.queryCountDesc

}

func (e *Test) Collect(ch chan<- prometheus.Metric) {

    queryCount := e.CalcFrequency()

    ch <- prometheus.MustNewConstMetric(

        e.queryCountDesc,

        prometheus.CounterValue,

        float64(queryCount),

        "sensor_name", //这里是传感器名称,要和上面desc一一对应上

    )

}

func (e *Test) CalcFrequency() float64 {

    return rand.Float64() //随机数

}
main入口
func main() {

    // 实例化并注册数据采集器exporter

    reg := prometheus.NewPedanticRegistry()

    for _, sensorConfig := range yamlConfig.ROSConfig.SensorConfig {

        if sensorConfig.Enable {

            getCollector := collector.GetCollector(&collector.ExporterConfig{

                Node:         node,

                HelpInfo:     sensorConfig.Help,

                TopicName:    sensorConfig.Topic,

                ExporterName: sensorConfig.Name,

            })

            reg.MustRegister(getCollector)

            log.Info("register topic: %s", sensorConfig.Topic)

        }

    }

    // 定义一个采集数据的采集器集合,它可以合并多个不同的采集器数据到一个结果集合中

    gatherers := prometheus.Gatherers{

        reg, //自定义的采集器

    }

    // 启动http服务

    h := promhttp.HandlerFor(gatherers,

        // HandlerFor函数传递上边的gatherers对象,并返回一个httpHandler对象h。

        // 这个httpHandler对象h可以调用其自身的ServHTTP函数来接收HTTP请求,并返回响应

        promhttp.HandlerOpts{

            ErrorHandling: promhttp.ContinueOnError, // 采集过程中如果出现错误,继续采集其他数据,不会中断采集器的工作

        })

    // 创建一个HTTP处理器来暴露指标

    http.HandleFunc("/metrics", func(w http.ResponseWriter, r *http.Request) {

        log.Debug("start...")

        h.ServeHTTP(w, r)

    })

    // 启动Web服务器,对外接口9101,交由prometheus来访问获取数据

    err = http.ListenAndServe(fmt.Sprintf(":%d", 9101), nil)

    if err != nil {

        log.Error("listen and server fail, error: %s", err.Error())

        return

    }

}
3.2、prometheus配置
官方提供了很多常见的数据采集服务,可以根据需要自用,比如:node_exporter服务主要采集服务器的系统参数。本次以自定义数据采集示例
prometheus 下载解压后,进入目录,如下:
.

├── console_libraries

├── consoles

├── data

├── LICENSE

├── NOTICE

├── prometheus

├── prometheus.yml

└── promtool
prometheus 是需要执行的二进制,prometheus.yaml 是配置文件,修改配置
scrape_configs:

  - job_name: "node"

    static_configs:

      - targets: ["localhost:9101"]
其他配置不管,这里配置采集程序
job_name 是采集程序名称
static_configs 配置采集程序的http地址,可以是多个,这里配置端口是9101,就是上面自定义采集程序开放的9101端口
3.3、运行prometheus
./prometheus --config.file="prometheus.yml" #使用指定配置文件启动prometheus
peometheus 默认使用9090端口提供数据,也可以访问查看配置情况,
打开浏览器,访问:http://127.0.0.1:9090/
以此点击:Status -> Target,可以看到配置的采集服务,如下图:
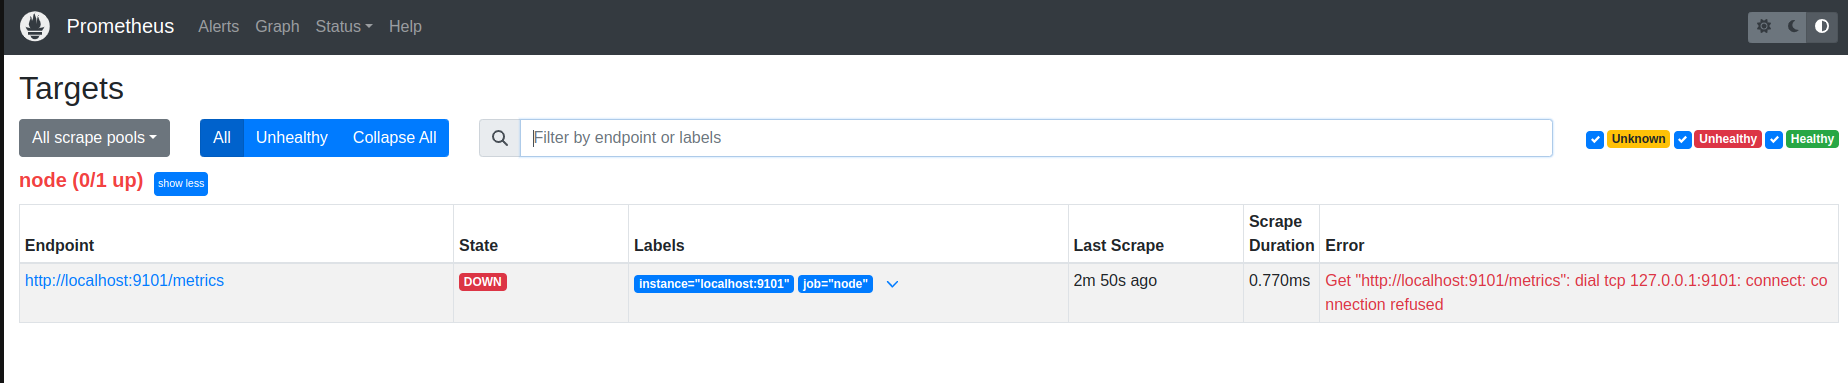
这里是采集服务没有运行,如果运行,则可以点击EndPoint进入查看数据
4、loki部署
loki下载解压,看一下loki的配置文件,部分配置说明如下:
server:

  http_listen_port: 3100 #loki接收的http端口
运行loki
./loki-linux-amd64 -config.file=loki-local-config.yaml
运行后查询采集内容,打开浏览器,访问:http://127.0.0.1:3100/metrics,即可看到原始数据上报
4.1、自定义日志采集
loki开放http接口接收日志,从文档中找到push api即可使用
POST /loki/api/v1/push
header中添加
Content-Type: application/json
body内容
{

  "streams": [

    {

      "stream": {

        "label": "value"

      },

      "values": [

          [ "<unix epoch in nanoseconds>", "<log line>" ],

          [ "<unix epoch in nanoseconds>", "<log line>" ]

      ]

    }

  ]

}
测试
$ curl -v -H "Content-Type: application/json" -XPOST -s "http://localhost:3100/loki/api/v1/push" --data-raw \

  '{"streams": [{ "stream": { "foo": "bar2" }, "values": [ [ "1570818238000000000", "fizzbuzz" ] ] }]}'
5、grafana配置
5.1、添加数据源
登录grafana,打开左上角菜单栏 -> Connections -> Data sources -> Add new data source,添加数据源,这里要添加两个
选择 prometheus,输入URL:http://localhost:9090(根据实际url修改),点击最下方的Save& test,保存并测试
选择 loki,输入URL:http://localhost:3100(根据实际url修改),点击最下方的Save& test,保存并测试
5.2、自定义面板
打开左上角菜单栏 -> Dabshboards -> New,创建新面板,自己摸索配置即可
grafana+prometheus+loki的使用的更多相关文章
- Grafana+Prometheus系统监控之MySql
架构 grafana和prometheus之前安装配置过,见:Grafana+Prometheus打造全方位立体监控系统 MySql安装 MySql的地位和重要性就不言而喻了,作为开源产品深受广大中小 ...
- Grafana+Prometheus系统监控之webhook
概述 Webhook是一个API概念,并且变得越来越流行.我们能用事件描述的事物越多,webhook的作用范围也就越大.Webhook作为一个轻量的事件处理应用,正变得越来越有用. 准确的说webho ...
- Grafana+Prometheus打造全方位立体监控系统
前言 本文主要介绍如何使用Grafana和Prometheus以及node_exporter对Linux服务器性能进行监控.下面两张图分别是两台服务器监控信息: 服务器A 服务器B 概述 Promet ...
- Grafana + Prometheus 监控PostgreSQL
效果图 部署环境 服务器名称 IP地址 部署业务 备注 部署agent sht-sgmhadoopcm-01 172.16.101.54 PostgreSQL 监控服务器.被监控服务器 node_ex ...
- Grafana+Prometheus 监控 MySQL
转自:Grafana+Prometheus 监控 MySQL 架构图 环境 IP 环境 需装软件 192.168.0.237 mysql-5.7.20 node_exporter-0.15.2.lin ...
- 性能测试之数据库监控分析工具Grafana+Prometheus
使用到 Grafana+Prometheus+Mysql_exportor 使用Prometheus和Grafana,可以快速的构建我们性能测试的绝大多数的监控模型:数据库监控.服务器监控.Jvm监控 ...
- Grafana+Prometheus通过node_exporter监控Linux服务器信息
Grafana+Prometheus通过node_exporter监控Linux服务器信息 一.Grafana+Prometheus通过node_exporter监控Linux服务器信息 1.1nod ...
- Grafana Prometheus系统监控Redis服务
Grafana Prometheus系统监控Redis服务 一.Grafana Prometheus系统监控Redis服务 1.1流程 1.2安装redis_exporter 1.3配置prometh ...
- Docker系列——Grafana+Prometheus+Node-exporter微信推送(三)
在之前博文中,已经成功的实现了邮件推送.目前主流的办公终端,就是企业微信.钉钉.飞书.今天来分享下微信推送,我们具体来看. 企业微信 在配置企业微信推送时,需要有微信企业,具体如何注册.使用,另外百度 ...
- Docker系列——Grafana+Prometheus+Node-exporter钉钉推送(四)
近期搭建的服务器监控平台,来进行一个总结.主要分为监控平台的搭建.告警中心的配置以及消息的推送.推送的话,支持多种终端.具体详细可查看之前的博文,在这里罗列下,方便查看. Docker系列--Graf ...
随机推荐
- Spring 学习笔记(4)依赖注入 DI
本篇文章主要对 Spring 框架中的核心功能之一依赖注入 (DI,Dependency Injection) 进行介绍,也是采用 理论+实战 的方式给大家阐述其中的原理以及明确需要注意的地方. 相关 ...
- 安装Amos结构方程模型分析软件的方法
本文介绍IBM SPSS Amos软件的安装方法. Amos是IBM公司旗下一款强大的结构方程建模软件.其捆绑在高级版的SPSS Statistics软件中,但其它版本的SPSS Statis ...
- S3C2440移植linux3.4.2内核之内核框架介绍及简单修改
目录 uboot启动内核分析 简单配置内核 编译内核 设置机器ID 修改晶振 uboot启动内核分析 进入cmd_bootm.c,找到对应的bootm命令对应的do_bootm(): int do ...
- zookeeper源码(03)启动流程
本文将从启动类开始详细分析zookeeper的启动流程: 加载配置的过程 集群启动过程 单机版启动过程 启动类 org.apache.zookeeper.server.quorum.QuorumPee ...
- 怎样实现WPF Prism Module的国际化和本地化?
怎样实现WPF Prism Module的国际化和本地化? English | 简体中文 上一篇有简单介绍主工程的国际化,使用的资源字典(XAML)实现的. 这几天我添加了几个Prism模块(Modu ...
- Go-错误-error
- linux-目录树
- Linux-分区-fdisk-mkfs-mount
- [转帖]shell编程:shell变量的核心基础知识与实战(二)
shell编程:shell变量的核心基础知识与实战(二) https://www.cnblogs.com/luoahong/articles/9152039.html Shell 变量类型 变量可以分 ...
- [转帖]SQL Server索引的维护 - 索引碎片、填充因子
https://www.cnblogs.com/kissdodog/archive/2013/06/14/3135412.html 这两个问题都和页密度有关,虽然两者的表现形式在本质上有所区别,但是故 ...