promethus+grafana监控
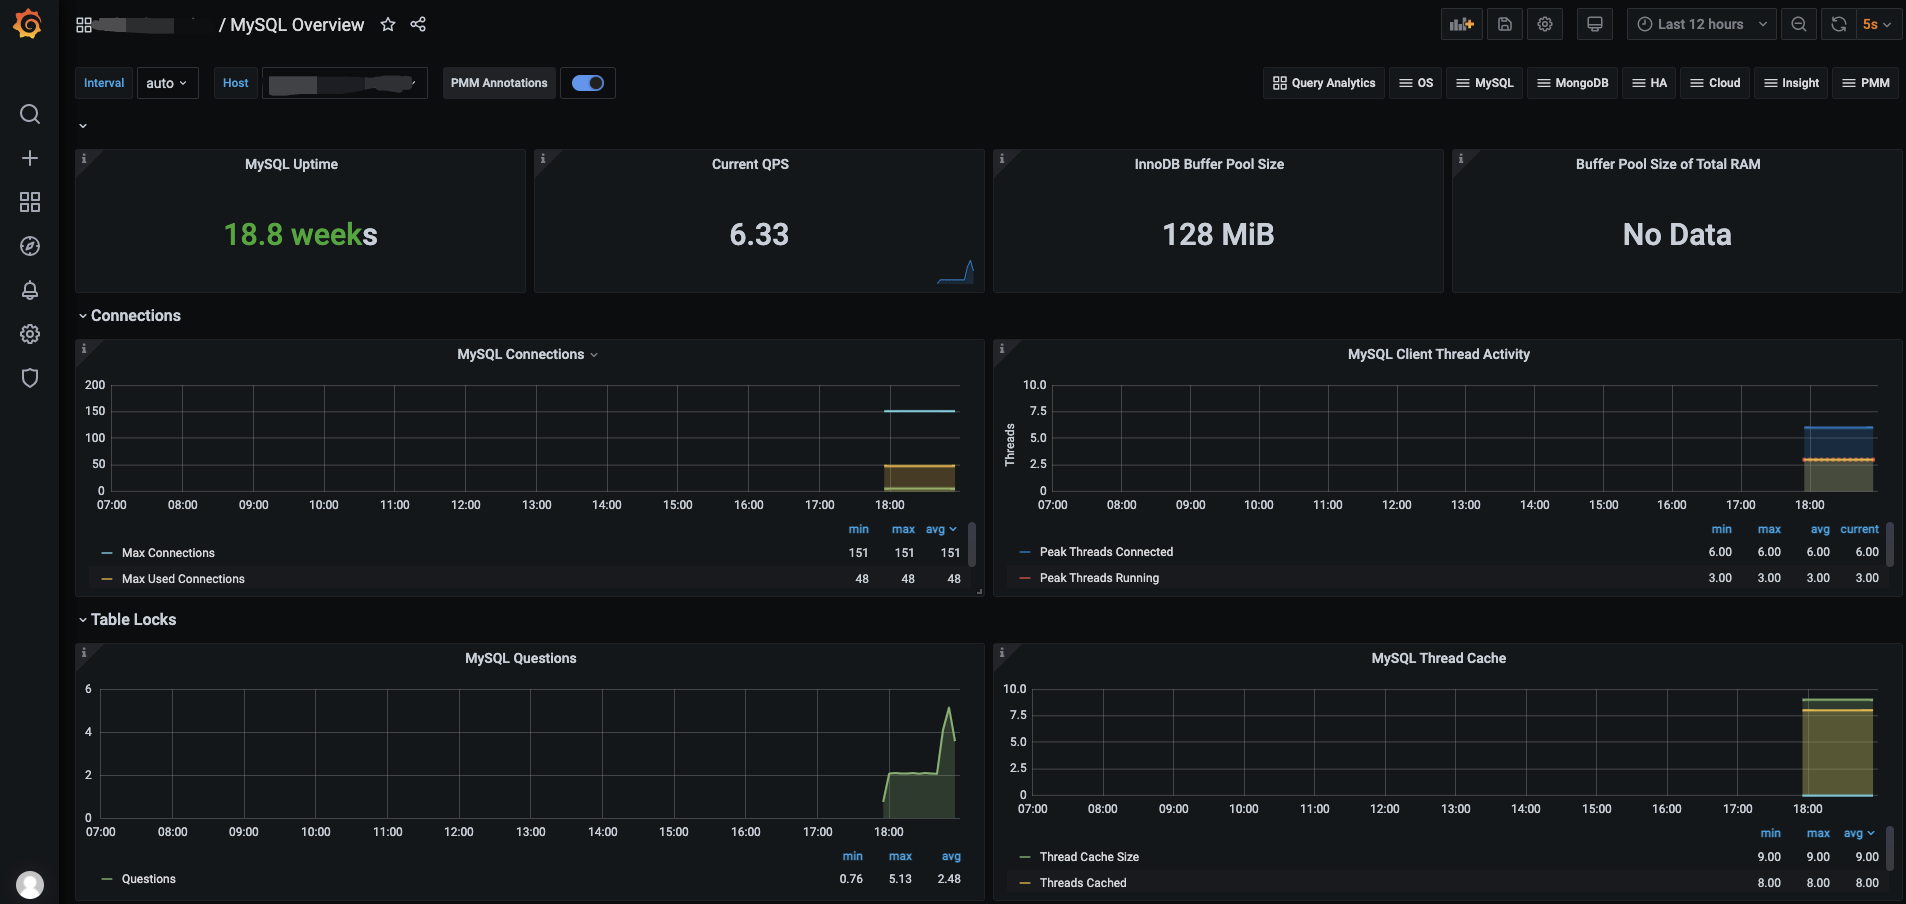
1、监控 MySQL
(终端可以安装在任意主机,不一定按在mysql节点上,注:mysql版本需在5.5以上)
I、首先在mysql中添加监控使用的用户:
create user 'exp'@'%' identified by 'exp';
grant process,replication client,select on *.* to 'exp'@'%';
II、安装监控终端 mysqld_exporter
cd /data/prometheus/ (此目录为服务器上任意目录,根据个人习惯而定)
下载地址:https://github.com/prometheus/mysqld_exporter/releases/download/v0.12.1/mysqld_exporter-0.12.1.linux-amd64.tar.gz
tar -xvf mysqld_exporter-0.12.1.linux-amd64.tar.gz
mv mysqld_exporter-0.12.1.linux-amd64 mysqld_exporter
cd mysqld_exporter
编辑终端使用的配置文件
vim mysqld_exporter.cnf
[client]
host=172.xxx.xxx.xxx
user=exp
password=exp
启动终端程序(次程序为后台启动程序)
nohup ./mysqld_exporter --config.my-cnf=mysqld_exporter.cnf > mysqld_exporter.log 2>&1 &
启动后此程序默认端口为9104
III、添加prometheus监控及倒入grafana模版
cd /prometheus/prometheus/
vim prometheus.yml
- job_name: 'mysql' (监控作业名称)
static_configs:(静态添加)
- targets: ['172.26.1.134:9104'](终端地址及端口)
重新引导prometheus
curl -X POST http://localhost:9090/-/reload (在prometheus主机上)
grafana添加模版

导入后效果
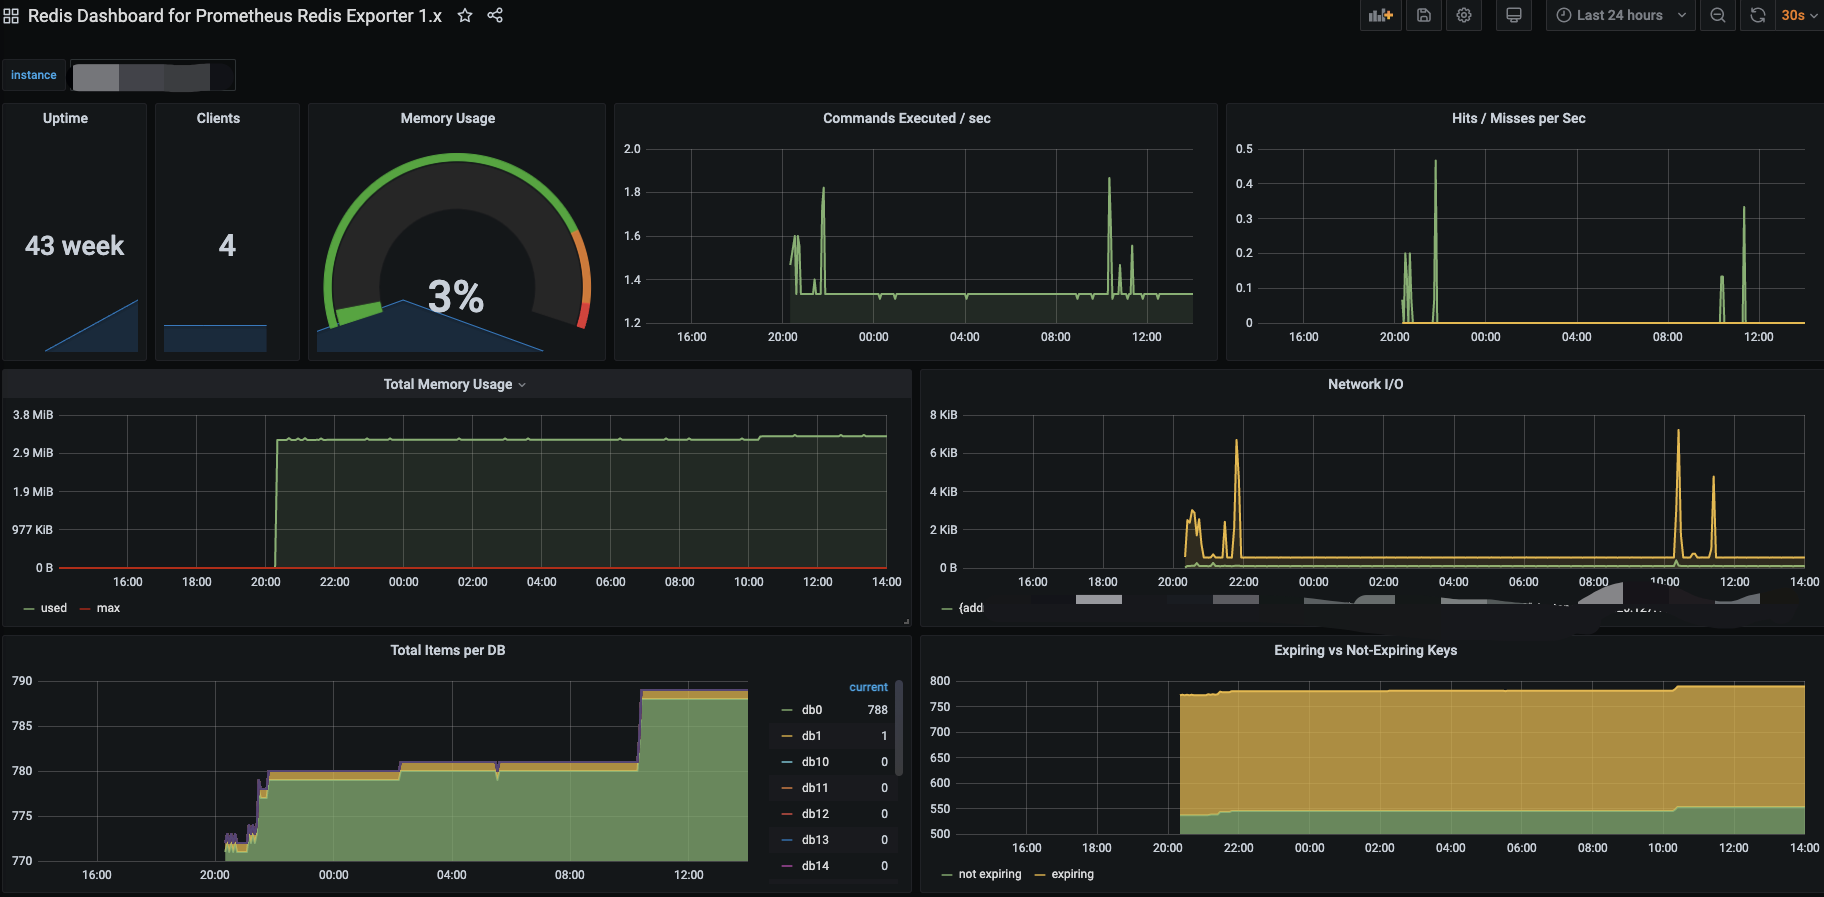
2、监控 Redis
I、安装监控终端
cd /data/prometheus/ (此目录为服务器上任意目录,根据个人习惯而定)
下载地址:https://github.com/oliver006/redis_exporter/releases/download/v0.30.0/redis_exporter-v0.30.0.linux-amd64.tar.gz
tar -xvf redis_exporter-v0.30.0.linux-amd64.tar.gz
mv redis_exporter-v0.30.0.linux-amd64 redis_exporter
cd redis_exporter
启动终端程序
## 无密码 nohup ./redis_exporter -redis.addr 172.26.1.120:6379 &
## 有密码 nohup ./redis_exporter -redis.addr 172.26.1.120:6379 -redis.password 123456
III、添加prometheus监控及倒入grafana模版
cd /prometheus/prometheus/
vim prometheus.yml
- job_name: 'redis' (监控作业名称)
static_configs:(静态添加)
- targets: ['172.26.1.134:9121'](终端地址及端口)
重新引导prometheus
curl -X POST http://localhost:9090/-/reload (在prometheus主机上)
grafana 模版763
导入后效果
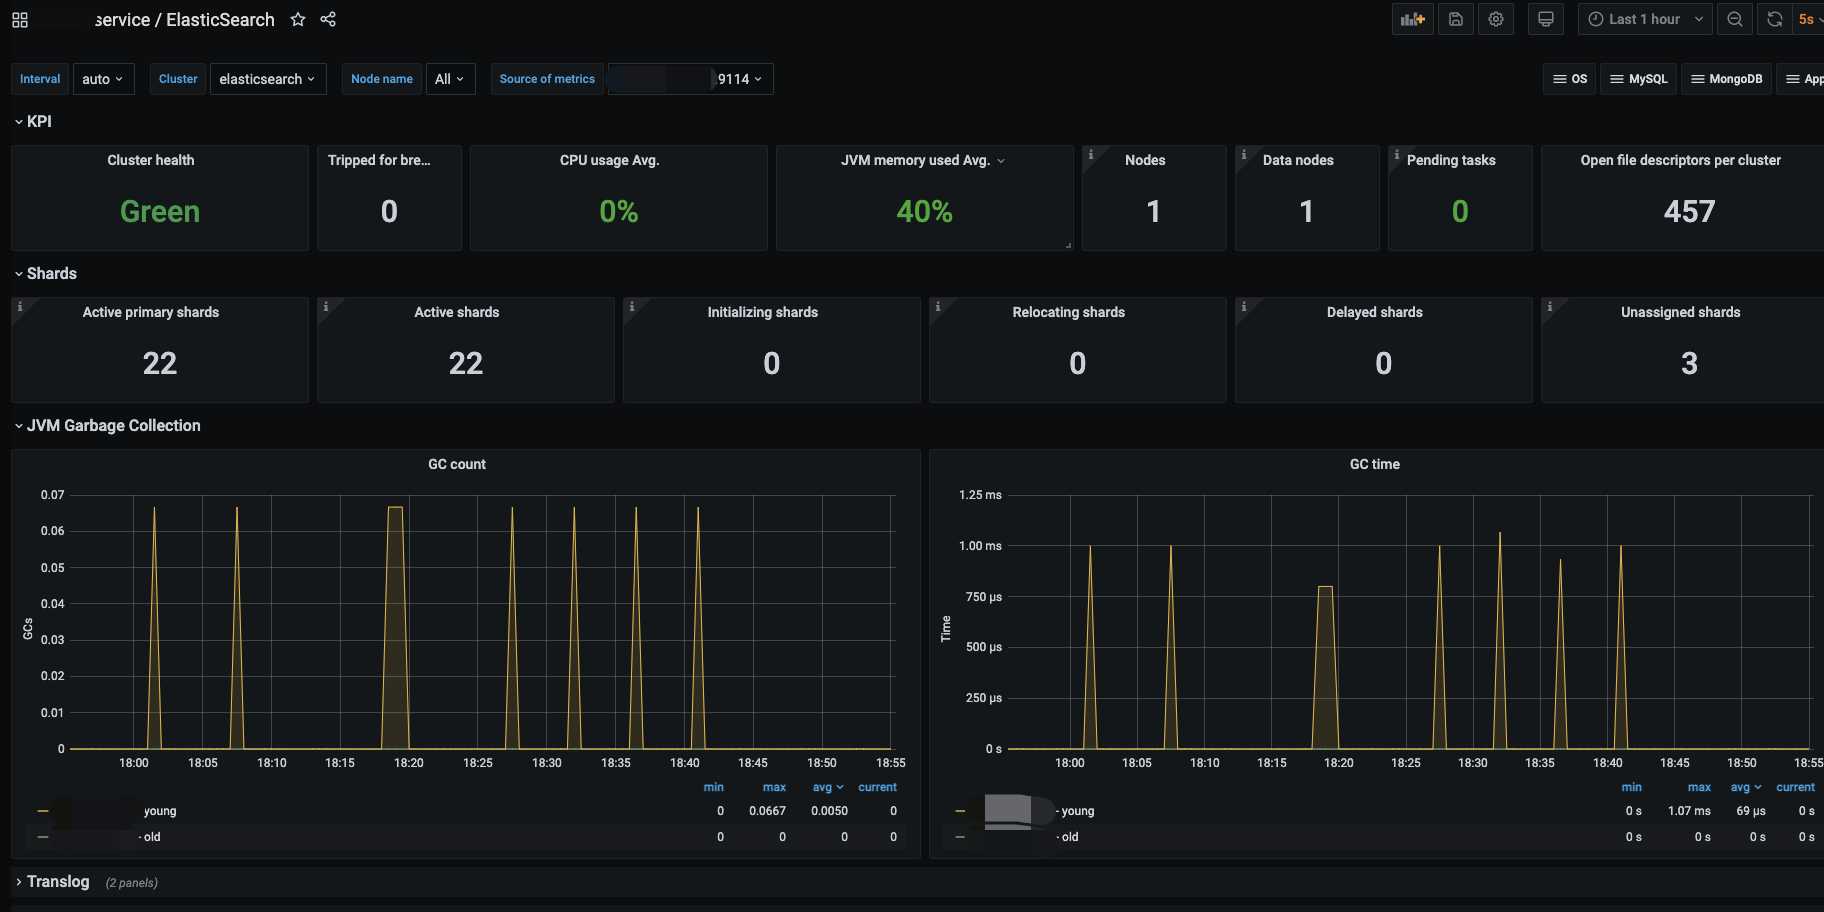
3、监控 Elasticsearch
I、安装监控终端
cd /data/prometheus/ (此目录为服务器上任意目录,根据个人习惯而定)
下载地址:wget https://github.com/justwatchcom/elasticsearch_exporter/releases/download/v1.1.0/elasticsearch_exporter-1.1.0.linux-amd64.tar.gz
tar -xvf elasticsearch_exporter-1.1.0.linux-amd64.tar.gz
mv elasticsearch_exporter-1.1.0.linux-amd64 elasticsearch_exporter
cd elasticsearch_exporter
启动终端程序
nohup ./elasticsearch_exporter --es.uri http://localhost:9200 &
## 参数说明:
--es.uri 默认http://localhost:9200,连接到的Elasticsearch节点的地址(主机和端口)。 这可以是本地节点(例如localhost:9200),也可以是远程Elasticsearch服务器的地址
--es.all 默认flase,如果为true,则查询群集中所有节点的统计信息,而不仅仅是查询我们连接到的节点。
--es.cluster_settings 默认flase,如果为true,请在统计信息中查询集群设置
--es.indices 默认flase,如果为true,则查询统计信息以获取集群中的所有索引。
--es.indices_settings 默认flase,如果为true,则查询集群中所有索引的设置统计信息。
--es.shards 默认flase,如果为true,则查询集群中所有索引的统计信息,包括分片级统计信息(意味着es.indices = true)。
--es.snapshots 默认flase,如果为true,则查询集群快照的统计信息。
III、添加prometheus监控及倒入grafana模版
cd /prometheus/prometheus/
vim prometheus.yml
- job_name: 'es' (监控作业名称)
static_configs:(静态添加)
- targets: ['172.26.1.134:9114'](终端地址及端口)
重新引导prometheus
curl -X POST http://localhost:9090/-/reload (在prometheus主机上)
grafana 模版2322
导入后效果
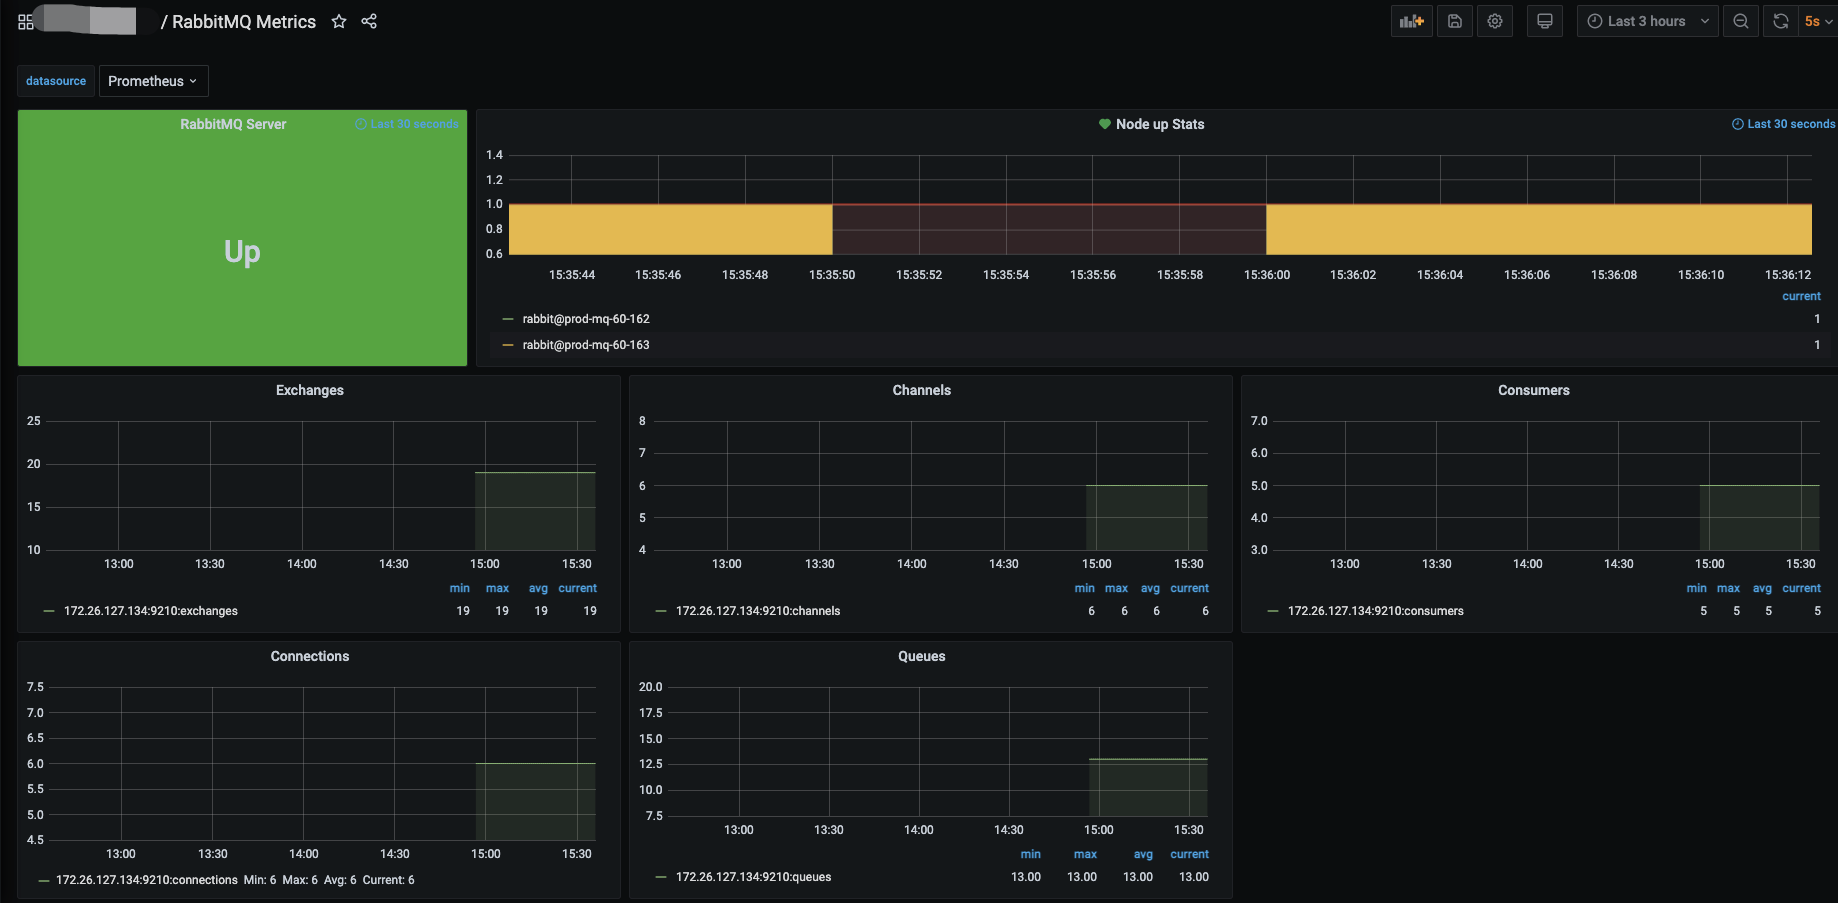
4、监控 RabbitMQ
I、安装监控终端
cd /data/prometheus/ (此目录为服务器上任意目录,根据个人习惯而定)
下载地址:wget wget https://github.com/kbudde/rabbitmq_exporter/releases/download/v0.29.0/rabbitmq_exporter-0.29.0.linux-amd64.tar.gz
tar -xvf rabbitmq_exporter-0.29.0.linux-amd64.tar.gz
mv rabbitmq_exporter-0.29.0.linux-amd64.tar.gz rabbitmq_exporter
cd rabbitmq_exporter
启动终端程序
RABBIT_USER=geust RABBIT_PASSWORD=geust OUTPUT_FORMAT=JSON PUBLISH_PORT=9099 RABBIT_URL=http://ip:15672 nohup ./rabbitmq_exporter &
RABBIT_USER 用户名
RABBIT_PASSWORD 密码
PUBLISH_PORT 监控端口
RABBIT_URL 监控地址
II、添加prometheus监控及倒入grafana模版
cd /prometheus/prometheus/
vim prometheus.yml
- job_name: 'es' (监控作业名称)
static_configs:(静态添加)
- targets: ['172.26.1.134:9099'](终端地址及端口)
重新引导prometheus
curl -X POST http://localhost:9090/-/reload (在prometheus主机上)
grafana 模版2121
导入后效果
promethus+grafana监控的更多相关文章
- Promethus+Grafana监控解决方案
[MySQL]企业级监控解决方案Promethus+Grafana Promethus用作监控数据采集与处理,而Grafana只是用作数据展示 一.Promethus简介 Prometheus(普罗米 ...
- 使用Promethus+Grafana监控Mongodb
note:本人周五开始接触promethuse,周一上班就开始搭环境和配置监控,其实本人对这三个东西根本就是略知一二,但是,我预测感觉过程还是简单的,结果... 首先把过程和遇到的问题一一说明. 1. ...
- Docker部署Zabbix+Grafana监控
Docker部署Zabbix+Grafana监控 环境 centos 7 ; Docker 17.12.0-ce ; docker-compose version 1.20.1 2018-4-1 当前 ...
- cAdvisor+Prometheus+Grafana监控docker
cAdvisor+Prometheus+Grafana监控docker 一.cAdvisor(需要监控的主机都要安装) 官方地址:https://github.com/google/cadvisor ...
- [转帖]Prometheus+Grafana监控Kubernetes
原博客的位置: https://blog.csdn.net/shenhonglei1234/article/details/80503353 感谢原作者 这里记录一下自己试验过程中遇到的问题: . 自 ...
- 使用Telegraf + Influxdb + Grafana 监控SQLserver服务器的运行状况
使用Telegraf + Influxdb + Grafana 监控SQLserver服务器的运行状况 前言 本文在Debian9下采用Docker的方式安装Telegraf + Influxdb + ...
- 快速接入业务监控体系,grafana监控的艺术
做一个系统,如果不做监控,是不完善的. 如果为做一个快速系统,花力气去做监控,是不值得的. 因为,我们有必要具备一个能够快速建立监控体系的能力.即使你只是一个普通开发人员! 个人觉得,做监控有三个核心 ...
- prometheus+grafana监控redis
prometheus+grafana监控redis redis安装配置 https://www.cnblogs.com/autohome7390/p/6433956.html redis_export ...
- prometheus+grafana监控mysql
prometheus+grafana监控mysql 1.安装配置MySQL官方的 Yum Repository(有mysql只需设置监控账号即可) [root@localhost ~]# wget - ...
- [转帖]安装prometheus+grafana监控mysql redis kubernetes等
安装prometheus+grafana监控mysql redis kubernetes等 https://www.cnblogs.com/sfnz/p/6566951.html plug 的模式进行 ...
随机推荐
- Unity C#for和foreach效率比较
下面是代码自己测试一下即可 using System.Collections; using System.Collections.Generic; using UnityEngine; public ...
- CTF学习笔记(三)php部分
三.常见PHP用法与漏洞 (〇)php的备份文件与phps php的备份文件一般是*.php.bak,在根目录下输入/index.php.bak, 下载 备份文件. phps文件就是php的源代码文件 ...
- 第二性 合卷本 横本.EPUB
书本详情 第二性台版 作者: 西蒙.德.波娃(Simone de Beauvoir)出版社: 貓頭鷹原作名: Le Deuxième Sexe译者: 邱瑞鑾出版年: 2013-10页数: 1136装帧 ...
- linux 中后台运行python脚本
nohup python yourscript.py &可以让你的程序在后台运行,控制台输出导向nohup.out文件 使用nobup命令 结尾处加一个& 符号
- 发生错误:请确认您的电脑是否安装了excel软件,并且您的浏览器是否允许远行excel!具体操作请查阅帮助.
1.要先下载 activeX 这个控件 2.进入internet选项--->安全--->将安全级别调到最低 3,是否下载了excel. 4,关闭window防火墙
- Spring入门之使用 spring 的 IOC 解决程序耦合(Spring 基于 XML 的 IOC 细节[掌握])(03-02)
3.3Spring 基于 XML 的 IOC 细节[掌握] 3.3.1 spring 中工厂的类结构图 3.3.1.1 BeanFactory 和 ApplicationContext 的区别 Bea ...
- 软件工程日报一——Andriod的安装与配置
建民老师给我们布置了一个编写记事本app的任务,因此需要我们下载andriod studio,下面是我的下载过程 在下载andriod studio之前,需要我们配置Java环境 进入控制面板,输入 ...
- (0619) wavedrom 画时序图---链接
https://www.cnblogs.com/jackzhang001/p/15879207.html
- python 删除大于超过一定时间文件
import os from datetime import datetime, timedelta path = "." if __name__ == '__main__': f ...
- env_config
import sys import os root_path = os.path.abspath(os.path.dirname(os.path.dirname(os.path.dirname(__f ...