canvas(六)绘制带说明的饼图
1.前言
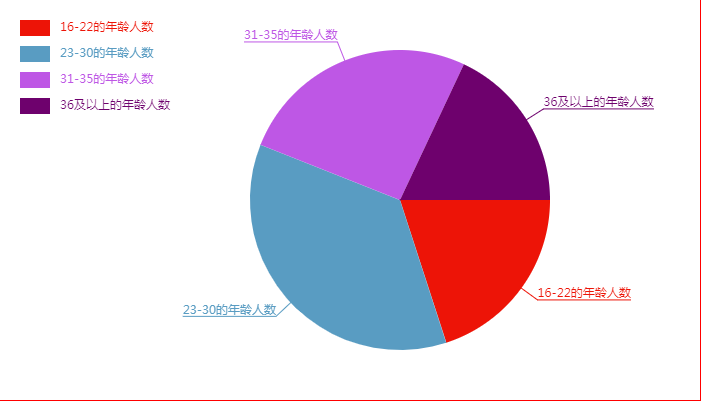
- 将以下数据渲染成饼图,数据格式:
var data = [

    {value:"10",title:"16-22的年龄人数"},

    {value:"15",title:"23-30的年龄人数"},

    {value:"25",title:"31-35的年龄人数"},

    {value:"10",title:"36及以上的年龄人数"}

]
2.代码
- 实例化传入dom,内部变量初始化
- 调用渲染方法,传入数据
- 接收传入的数据,进行初始化(区间占比,起始角度,结束角度,颜色)
- 渲染扇形模块
- 渲染图例模块
- 渲染延长线和文字模块
<script>

    //构造函数

    var PieChart = function(dom) {

        //初始化

        this.init(dom)

    }

    //初始化方法

    PieChart.prototype.init = function(dom){

        //初始化dom

        var dom = dom || document.querySelector('canvas')

        //初始化绘图工具

        this.ctx = dom && dom.getContext("2d")

        //以下配置暂时写死

        //获取画布宽高

        this.w = this.ctx.canvas.width

        this.h = this.ctx.canvas.height

        //饼图的圆心和半径

        this.x0 = this.w / 2

        this.y0 = this.h / 2

        this.r = 150 //半径

        //延长线的长度

        this.outLineWidth = this.r + 20

        //图例大小及间距

        this.legend_width = 30

        this.legend_height = 16

        this.legend_space = 10

        //初始化文本对其方式

        this.ctx.textAlign = 'left'

        //设置字体(设置字体要在计算字体宽度之前)

        this.ctx.font = '12px 微软雅黑'

    }

    //接收数据,执行渲染

    PieChart.prototype.render = function(data = []){

        //缓存数据

        this._data = JSON.parse(JSON.stringify(data))

        this.data = JSON.parse(JSON.stringify(data))

        //区间信息初始化

        this.dataInit()

        //绘制扇形

        this.drawSector()

        //绘制图例

        this.drawLegend()

        //绘制延长线及说明

        this.drawText()

    }

    //获取随机颜色

    PieChart.prototype.getRandomColor = function() {

        var r = Math.round(Math.random() * 255)

        var g = Math.round(Math.random() * 255)

        var b = Math.round(Math.random() * 255)

        return 'rgb(' + r + ',' + g + ',' + b + ')'

    }

    //为区间挂载角度信息

    PieChart.prototype.dataInit = function() {

        //计算总数

        var total = data.reduce((total,item) => {

            return total + Number(item.value)

        },0)

        //遍历前数据

        var startRadian = 0 //开始角度

        var endRadian = 0 //结束角度

        //遍历数据

        for(var i=0;i<this.data.length;i++){

            //占比

            var proportion = this.data[i].value/total

            //区间所占角度

            var radian = Math.PI * 2 * proportion

            //开始角度 = 上一次结束角度

            startRadian = endRadian

            //结束角度 = 开始角度 + 区间所占角度

            endRadian = startRadian + radian

            //颜色

            var color = this.getRandomColor()

            //挂载到数据中

            this.data[i].proportion = proportion

            this.data[i].radian = radian

            this.data[i].startRadian = startRadian

            this.data[i].endRadian = endRadian

            this.data[i].color = color

        }

    }

    //绘制扇形

    PieChart.prototype.drawSector = function(){

        //遍历数据

        for(var i=0;i<this.data.length;i++){

            //当前区间数据

            var section_data = this.data[i]

            //开启路径

            this.ctx.beginPath()

            //设置填充颜色

            this.ctx.fillStyle = this.data[i].color

            //绘制曲线(角度直接读取data)

            this.ctx.arc(this.x0, this.y0, this.r, section_data.startRadian, section_data.endRadian)

            //延时到原点,以便绘制扇形

            this.ctx.lineTo(this.x0, this.y0)

            //填充

            this.ctx.fill()

        }

    }

    //绘制图例

    PieChart.prototype.drawLegend = function(){

        //初始化垂直对其方式

        this.ctx.textBaseline = 'middle'

        //默认一行一个图例,一次往下移动

        var item_center_y = -this.legend_height //当前图例y轴坐标

        //提示

        //遍历数据

        for(var i=0;i<this.data.length;i++){

            //开启新路径

            this.ctx.beginPath()

            //设置颜色

            this.ctx.fillStyle = this.data[i].color

            //标题

            var title = this.data[i].title

            //当前y轴坐标(依次往下移动)

            item_center_y += (this.legend_space + this.legend_height)

            //绘制矩形

            this.ctx.fillRect(this.legend_space, item_center_y, this.legend_width, this.legend_height)

            //绘制文字,文字的基点y坐标为矩形的垂直方向的中心

            this.ctx.fillText(title, this.legend_space + this.legend_width + 10, item_center_y + this.legend_height/2)

        }

        //还原垂直对其方式

        this.ctx.textBaseline = 'baseline'

    }

    //绘制延长线及说明

    PieChart.prototype.drawText = function(){

        //初始化垂直对其方式

        this.ctx.textBaseline = 'bottom'

        //遍历数据

        for(var i=0;i<this.data.length;i++){

            //当前区间数据

            var section_data = this.data[i]

            //标题内容

            var title = section_data.title

            //计算中心角度

            var middleRadian = (section_data.startRadian + section_data.endRadian) / 2

            //延长线坐标(起点坐标为圆心,终点坐标根据正弦 余弦计算)

            var outX = this.x0 + this.outLineWidth * Math.cos(middleRadian)

            var outY = this.y0 + this.outLineWidth * Math.sin(middleRadian)

            //优化文字对齐方式

            if (outX >= this.x0) {

                //在右边

                var underlineX = outX + this.ctx.measureText(title).width

                this.ctx.textAlign = 'left'

            } else {

                //在左边

                var underlineX = outX - this.ctx.measureText(title).width

                this.ctx.textAlign = 'right'

            }

            //绘制延长线

            //开启路径

            this.ctx.beginPath()

            //设置颜色

            this.ctx.strokeStyle = this.data[i].color

            this.ctx.fillStyle = this.data[i].color

            //绘制直线

            this.ctx.moveTo(this.x0, this.y0)

            this.ctx.lineTo(outX, outY)

            //绘制下划线

            this.ctx.lineTo(underlineX, outY)

            this.ctx.stroke()

            //绘制文本

            this.ctx.beginPath()

            this.ctx.fillText(title, outX, outY)

        }

        //还原垂直对其方式

        this.ctx.textBaseline = 'baseline'

    }

</script>
3.调用
- 数据随机生成
<script>

    var box = document.querySelector("canvas")

    var data = [

        {value:0,title:"16-22的年龄人数"},

        {value:0,title:"23-30的年龄人数"},

        {value:0,title:"31-35的年龄人数"},

        {value:0,title:"36及以上的年龄人数"}

    ]

    //模拟数据(产生50个数据)

    var num = 50

    for(var i=0;i<num;i++){

        //随机产生16-40的整数

        var age = Math.floor(16 + Math.random()*25)

        if(age < 23){

            data[0].value++

        }else if(age < 31){

            data[1].value++

        }else if(age < 36){

            data[2].value++

        }else{

            data[3].value++

        }

    }

    //创建饼图对象

    var pieChart = new PieChart(box)

    //传入数据开始绘制饼图

    pieChart.render(data)

</script>
4.效果图
5.ES6类语法
<script>

    class PieChart{

        //构造器

        constructor(dom){

            //初始化

            this.init(dom)

        }

        //初始化方法

        init(dom){

            //初始化dom

            var dom = dom || document.querySelector('canvas')

            //初始化绘图工具

            this.ctx = dom && dom.getContext("2d")

            //以下配置暂时写死

            //获取画布宽高

            this.w = this.ctx.canvas.width

            this.h = this.ctx.canvas.height

            //饼图的圆心和半径

            this.x0 = this.w / 2

            this.y0 = this.h / 2

            this.r = 150 //半径

            //延长线的长度

            this.outLineWidth = this.r + 20

            //图例大小及间距

            this.legend_width = 30

            this.legend_height = 16

            this.legend_space = 10

            //初始化文本对其方式

            this.ctx.textAlign = 'left'

            //设置字体(设置字体要在计算字体宽度之前)

            this.ctx.font = '12px 微软雅黑'

        }

        //接收数据,执行渲染

        render(data = []){

            //缓存数据

            this._data = JSON.parse(JSON.stringify(data))

            this.data = JSON.parse(JSON.stringify(data))

            //区间信息初始化

            this.dataInit()

            //绘制扇形

            this.drawSector()

            //绘制图例

            this.drawLegend()

            //绘制延长线及说明

            this.drawText()

        }

        //获取随机颜色

        getRandomColor() {

            var r = Math.round(Math.random() * 255)

            var g = Math.round(Math.random() * 255)

            var b = Math.round(Math.random() * 255)

            return 'rgb(' + r + ',' + g + ',' + b + ')'

        }

        //为区间挂载角度信息

        dataInit() {

            //计算总数

            var total = data.reduce((total,item) => {

                return total + Number(item.value)

            },0)

            //遍历前数据

            var startRadian = 0 //开始角度

            var endRadian = 0 //结束角度

            //遍历数据

            for(var i=0;i<this.data.length;i++){

                //占比

                var proportion = this.data[i].value/total

                //区间所占角度

                var radian = Math.PI * 2 * proportion

                //开始角度 = 上一次结束角度

                startRadian = endRadian

                //结束角度 = 开始角度 + 区间所占角度

                endRadian = startRadian + radian

                //颜色

                var color = this.getRandomColor()

                //挂载到数据中

                this.data[i].proportion = proportion

                this.data[i].radian = radian

                this.data[i].startRadian = startRadian

                this.data[i].endRadian = endRadian

                this.data[i].color = color

            }

        }

        //绘制扇形

        drawSector(){

            //遍历数据

            for(var i=0;i<this.data.length;i++){

                //当前区间数据

                var section_data = this.data[i]

                //开启路径

                this.ctx.beginPath()

                //设置填充颜色

                this.ctx.fillStyle = this.data[i].color

                //绘制曲线(角度直接读取data)

                this.ctx.arc(this.x0, this.y0, this.r, section_data.startRadian, section_data.endRadian)

                //延时到原点,以便绘制扇形

                this.ctx.lineTo(this.x0, this.y0)

                //填充

                this.ctx.fill()

            }

        }

        //绘制图例

        drawLegend(){

            //初始化垂直对其方式

            this.ctx.textBaseline = 'middle'

            //默认一行一个图例,一次往下移动

            var item_center_y = -this.legend_height //当前图例y轴坐标

            //提示

            //遍历数据

            for(var i=0;i<this.data.length;i++){

                //开启新路径

                this.ctx.beginPath()

                //设置颜色

                this.ctx.fillStyle = this.data[i].color

                //标题

                var title = this.data[i].title

                //当前y轴坐标(依次往下移动)

                item_center_y += (this.legend_space + this.legend_height)

                //绘制矩形

                this.ctx.fillRect(this.legend_space, item_center_y, this.legend_width, this.legend_height)

                //绘制文字,文字的基点y坐标为矩形的垂直方向的中心

                this.ctx.fillText(title, this.legend_space + this.legend_width + 10, item_center_y + this.legend_height/2)

            }

            //还原垂直对其方式

            this.ctx.textBaseline = 'baseline'

        }

        //绘制延长线及说明

        drawText(){

            //初始化垂直对其方式

            this.ctx.textBaseline = 'bottom'

            //遍历数据

            for(var i=0;i<this.data.length;i++){

                //当前区间数据

                var section_data = this.data[i]

                //标题内容

                var title = section_data.title

                //计算中心角度

                var middleRadian = (section_data.startRadian + section_data.endRadian) / 2

                //延长线坐标(起点坐标为圆心,终点坐标根据正弦 余弦计算)

                var outX = this.x0 + this.outLineWidth * Math.cos(middleRadian)

                var outY = this.y0 + this.outLineWidth * Math.sin(middleRadian)

                //优化文字对齐方式

                if (outX >= this.x0) {

                    //在右边

                    var underlineX = outX + this.ctx.measureText(title).width

                    this.ctx.textAlign = 'left'

                } else {

                    //在左边

                    var underlineX = outX - this.ctx.measureText(title).width

                    this.ctx.textAlign = 'right'

                }

                //绘制延长线

                //开启路径

                this.ctx.beginPath()

                //设置颜色

                this.ctx.strokeStyle = this.data[i].color

                this.ctx.fillStyle = this.data[i].color

                //绘制直线

                this.ctx.moveTo(this.x0, this.y0)

                this.ctx.lineTo(outX, outY)

                //绘制下划线

                this.ctx.lineTo(underlineX, outY)

                this.ctx.stroke()

                //绘制文本

                this.ctx.beginPath()

                this.ctx.fillText(title, outX, outY)

            }

            //还原垂直对其方式

            this.ctx.textBaseline = 'baseline'

        }

    }

</script>
canvas(六)绘制带说明的饼图的更多相关文章
- Canvas上绘制几何图形
重要的类自定义View组件要重写View组件的onDraw(Canvase)方法,接下来是在该 Canvas上绘制大量的几何图形,点.直线.弧.圆.椭圆.文字.矩形.多边形.曲线.圆角矩形,等各种形状 ...
- Turtle绘制带颜色和字体的图形(Python3)
转载自https://blog.csdn.net/wumenglu1018/article/details/78184930 在Python中有很多编写图形程序的方法,一个简单的启动图形化程序设计的方 ...
- openLayers 4 canvas图例绘制,canvas循环添加图片,解决图片闪烁问题
一.问题来源: 接触Openlayers 一段时间了,最近做了一个农业产业系统,项目中涉及到产业图例,最后考虑用canvas来绘制图例图像.当中带图片的图例移动时,图片会实现闪烁留白情况.闪烁是因为绘 ...
- 自定义控件之Canvas图形绘制基础练习-青春痘笑脸^_^
对于自定义控件的意义不言而喻,所以对它的深入研究是很有必要的,前些年写过几篇关于UI效果的学习过程,但是中途比较懒一直就停滞了,而对于实际工作还是面试来说系统深入的了解自定义控件那是很有必要的,所以接 ...
- Canvas:绘制曲线
前言 画曲线要用到二次贝塞尔曲线或三次贝塞尔曲线.贝塞尔曲线是计算机图形学中相当重要的参数曲线,在一些比较成熟的位图软件中也有贝塞尔曲线工具,如 PhotoShop. 二次贝塞尔曲线 二次贝塞尔曲线在 ...
- canvas快速绘制圆形、三角形、矩形、多边形
想看前面整理的canvas常用API的同学可以点下面: canvas学习之API整理笔记(一) canvas学习之API整理笔记(二) 本系列文章涉及的所有代码都将上传至:项目代码github地址,喜 ...
- 用html5的canvas画布绘制贝塞尔曲线
查看效果:http://keleyi.com/keleyi/phtml/html5/7.htm 完整代码: <!DOCTYPE html PUBLIC "-//W3C//DTD XHT ...
- HTML5在canvas中绘制复杂形状附效果截图
HTML5在canvas中绘制复杂形状附效果截图 一.绘制复杂形状或路径 在简单的矩形不能满足需求的情况下,绘图环境提供了如下方法来绘制复杂的形状或路径. beginPath() : 开始绘制一个新路 ...
- Canvas 2D绘制抗锯齿的1px线条
当绘制1像素的线条时,发现多条线明显存在着粗细不均的问题,线条带有明显的锯齿. 事实上,Canvas的绘制线条指令都存在这个状况,如lineTo,arcTo,strokeRect. 解决方案是将Can ...
- HTML5 canvas标签绘制正三角形 鼠标按下点为中间点,鼠标抬起点为其中一个顶点
用html5的canvas标签绘制圆.矩形比较容易,绘制三角形,坐标确定相当于前面两种难点,这里绘制的是正三角形,比较容易,我们只需要把鼠标刚按下去的点设置为三角形的中心点,鼠标抬起的点设置为三角形右 ...
随机推荐
- Hive 2.3.2安装
一.安装mysql 安装MySQL服务器端和MySQL客户端: •安装: – yum install mysql – yum install mysql-server •启动: – /etc/init ...
- Blazor 子组件与父组件通过 ChildEvents 传递数据的方法
想要实现 Blazor 子组件向父组件传递数据, 参考 痴者工良的博文所描述的方式, .Net 5.0 下编译未能通过, 于是先修改一下, 简化为光触发事件通知而不传值 子组件 Child.razor ...
- 进程管理中的active_mm是做什么的?
在Linux内核中,进程管理涉及到许多复杂的数据结构和机制,其中active_mm是与内存管理相关的一个关键概念.理解active_mm需要先了解与之相关的一些基本内核结构和概念. 基本概念 mm_s ...
- slab分配器正式被弃用,slub成为分配器唯一选择
在使用slab分配器进行内存分配时,可能会出现以下缺点: 内存碎片化.由于slab分配器需要将内存分成大小相同的块,如果分配不均衡或者对象大小不同,就容易导致内存碎片化. 性能下降.Slab分配器将内 ...
- 关于set实现结构体自动去重原理的推论
转自本人博客,原文链接 先说结论 在每个操作均为log复杂度的前提下,set无法在判断顺序和重复关键字不同时完成对结构体元素的去重. 首先我们先看这段结构体定义,目的是先按num相等进行去重,再按ke ...
- Diffusion系列 - DDIM 公式推导 + 代码 -(三)
DENOISING DIFFUSION IMPLICIT MODELS (DDIM) 从DDPM中我们知道,其扩散过程(前向过程.或加噪过程)被定义为一个马尔可夫过程,其去噪过程(也有叫逆向过程)也是 ...
- vue前端开发仿钉图系列(4)右侧行政区绘制的开发详解
行政区绘制是基于高德地图的api,需要在高德提供的代码基础上做好html代码在vue页面上的适配.核心功能就是选择省市区,可以根据需要绘制对应选中的地图图层.整理总结不易,如需全部代码,请联系我150 ...
- npm/yarn是什么,他们的区别 ? & node.js 又是个啥
是什么? npm(全称Node Package Manager,即 node 包管理器) ,是Node.js默认的包管理系统 ; 区别: yarn 的速度开快,因为yarn 是并行安装,npm是串行安 ...
- Spring 实现 3 种异步流式接口,干掉接口超时烦恼
大家好,我是小富- 如何处理比较耗时的接口? 这题我熟,直接上异步接口,使用 Callable.WebAsyncTask 和 DeferredResult.CompletableFuture等均可实现 ...
- 4:Exchange安装后的任务
4:Exchange安装后的任务 安装后的任务: 第一:证书的申请安装,分配服务略 注意项:如果是通配符证书,不能直接分配pop的服务 第二:虚拟目录的配置 Exchang ...