
《DSP using MATLAB》Problem 3.18
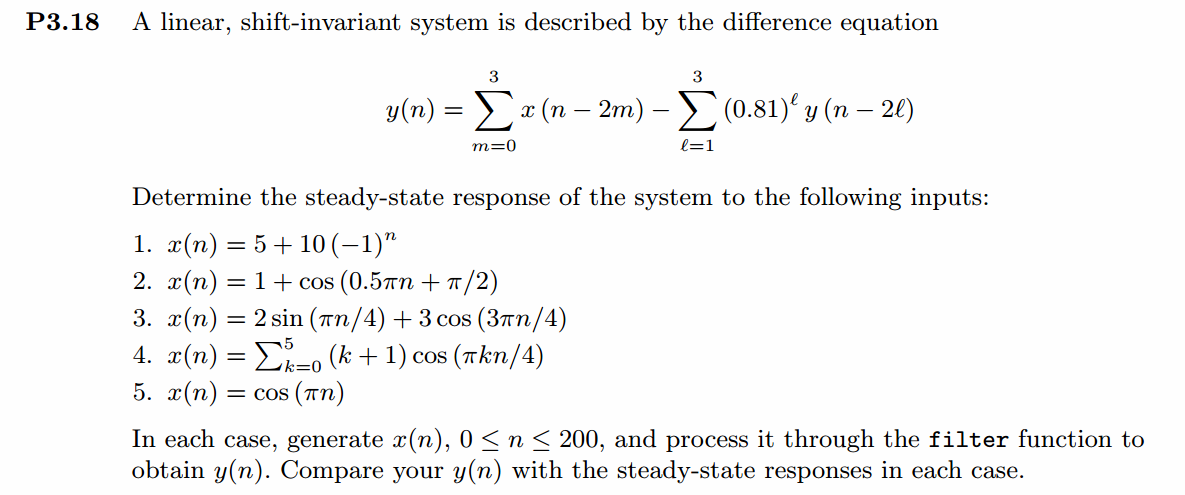
代码:
%% ------------------------------------------------------------------------

%%            Output Info about this m-file

fprintf('\n***********************************************************\n');

fprintf('        <DSP using MATLAB> Problem 3.18 \n\n');

banner();

%% ------------------------------------------------------------------------

%% -------------------------------------------------------------------

%%       y(n)=x(n)+x(n-2)+x(n-4)+x(n-6)

%%             -0.81y(n-2)-0.81*0.81y(n-4)-0.81^3*y(n-6)

%% -------------------------------------------------------------------

a = [1, 0, 0.81, 0, 0.81^2, 0, 0.81^3];         % filter coefficient array a

b = [1, 0, 1, 0, 1, 0, 1];                      % filter coefficient array b

MM = 500;

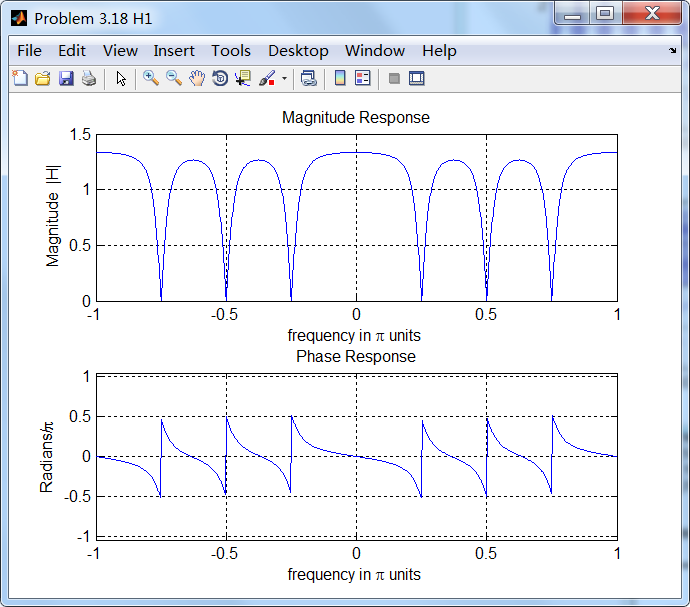
[H, w] = freqresp1(b, a, MM);

magH  = abs(H);  angH  = angle(H);  realH  = real(H);  imagH  = imag(H);

%% --------------------------------------------------------------------

%%              START H's  mag ang real imag

%% --------------------------------------------------------------------

figure('NumberTitle', 'off', 'Name', 'Problem 3.18 H1');

set(gcf,'Color','white');

subplot(2,1,1); plot(w/pi,magH); grid on;  %axis([-1,1,0,1.05]);

title('Magnitude Response');

xlabel('frequency in \pi units'); ylabel('Magnitude  |H|');

subplot(2,1,2); plot(w/pi, angH/pi); grid on;  axis([-1,1,-1.05,1.05]);

title('Phase Response');

xlabel('frequency in \pi units'); ylabel('Radians/\pi');

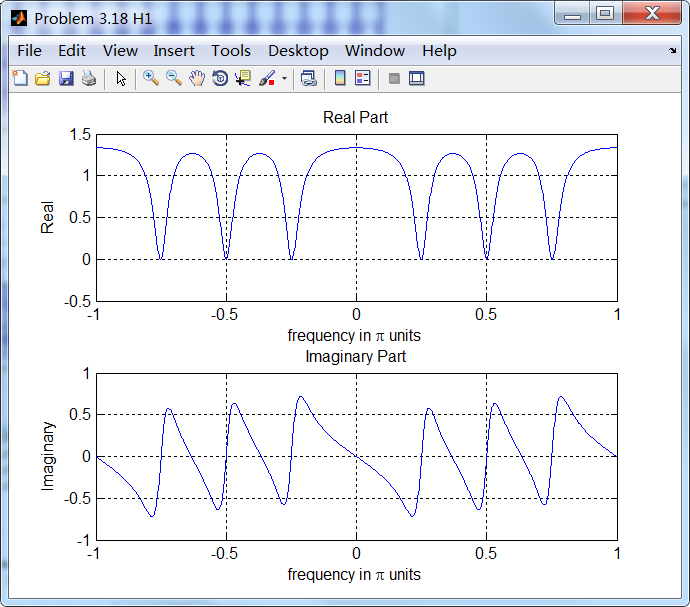
figure('NumberTitle', 'off', 'Name', 'Problem 3.18 H1');

set(gcf,'Color','white');

subplot(2,1,1); plot(w/pi, realH); grid on;

title('Real Part');

xlabel('frequency in \pi units'); ylabel('Real');

subplot(2,1,2); plot(w/pi, imagH); grid on;

title('Imaginary Part');

xlabel('frequency in \pi units'); ylabel('Imaginary');

%% -------------------------------------------------------------------

%%             END X's  mag ang real imag

%% -------------------------------------------------------------------

%% --------------------------------------------------

%%             x1(n)=5+10*(-1)^n

%% --------------------------------------------------

 M = 200;

n1 = [0:M];

x1 = 5 + 10*(-1).^n1;

y1 = filter(b, a, x1);

figure('NumberTitle', 'off', 'Name', sprintf('Problem 3.18.1 M = %d',M));

set(gcf,'Color','white');

subplot(2,1,1);

stem(n1, x1);

xlabel('n'); ylabel('x1');

title(sprintf('x1(n) input sequence, M = %d', M)); grid on;

subplot(2,1,2);

stem(n1, y1);

xlabel('n'); ylabel('y1');

title(sprintf('y1(n) output sequence, M = %d', M)); grid on;

%% --------------------------------------------------

%%             x2(n)=1+cos(0.5pin+pi/2)

%% --------------------------------------------------

n2 = n1;

x2 = 1 + cos(0.5*pi*n2+pi/2);

y2 = filter(b, a, x2);

figure('NumberTitle', 'off', 'Name', sprintf('Problem 3.18.2 M = %d',M));

set(gcf,'Color','white');

subplot(2,1,1);

stem(n2, x2);

xlabel('n'); ylabel('x');

title(sprintf('x2(n) input sequence, M = %d', M)); grid on;

subplot(2,1,2);

stem(n2, y2);

xlabel('n'); ylabel('y');

title(sprintf('y2(n) output sequence, M = %d', M)); grid on;

%% --------------------------------------------------

%%             x3(n)=2sin(pin/4) + 3cos(3pin/4)

%% --------------------------------------------------

n3 = n1;

x3 = 2*sin(pi*n3/4) + 3*cos(3*pi*n3/2);

y3 = filter(b, a, x3);

figure('NumberTitle', 'off', 'Name', sprintf('Problem 3.18.3 M = %d',M));

set(gcf,'Color','white');

subplot(2,1,1);

stem(n3, x3);

xlabel('n'); ylabel('x');

title(sprintf('x3(n) input sequence, M = %d', M)); grid on;

subplot(2,1,2);

stem(n3, y3);

xlabel('n'); ylabel('y');

title(sprintf('y3(n) output sequence, M = %d', M)); grid on;

%% ------------------------------------------------------------------------------

%%     x4(n)=1+2cos(pin/4)+3cos(2pin/4)+4cos(3pin/4)+5cos(4pin/4)+6cos(5pin/4)

%% ------------------------------------------------------------------------------

 n4 = n1;

sum = 0;

for i = 0:5

	sum = sum + (i+1)*cos(i*pi*n4/4);

end

x4 = sum;

y4 = filter(b, a, x4);

figure('NumberTitle', 'off', 'Name', sprintf('Problem 3.18.4 M = %d',M));

set(gcf,'Color','white');

subplot(2,1,1);

stem(n4, x4);

xlabel('n'); ylabel('x');

title(sprintf('x4(n) input sequence, M = %d', M)); grid on;

subplot(2,1,2);

stem(n4, y4);

xlabel('n'); ylabel('y');

title(sprintf('y4(n) output sequence, M = %d', M)); grid on;

%% -----------------------------------------------------------------

%%                    x5(n)=cos(pin)

%% -----------------------------------------------------------------

 n5 = n1;

x5 = cos(pi*n5);

y5 = filter(b, a, x5);

figure('NumberTitle', 'off', 'Name', sprintf('Problem 3.18.5 M = %d',M));

set(gcf,'Color','white');

subplot(2,1,1);

stem(n5, x5);

xlabel('n'); ylabel('x');

title(sprintf('x5(n) input sequence, M = %d', M)); grid on;

subplot(2,1,2);

stem(n5, y5);

xlabel('n'); ylabel('y');

title(sprintf('y5(n) output sequence, M = %d', M)); grid on;

%% -----------------------------------------------------------------

%%                    x0(n)=Acos(w0n+theta)

%% -----------------------------------------------------------------

 A = 3;

w0 = 0.2*pi;

theta = 0;

n0 = n1;

x0 = A * cos(w0*n0+theta);

yss = filter(b, a, x0);

figure('NumberTitle', 'off', 'Name', sprintf('Problem 3.18.6 M = %d',M));

set(gcf,'Color','white');

subplot(2,1,1);

stem(n0, x0);

xlabel('n'); ylabel('x');

title(sprintf('x0(n) input sequence, M = %d', M)); grid on;

subplot(2,1,2);

stem(n0, yss);

xlabel('n'); ylabel('y');

title(sprintf('yss(n) output sequence, M = %d', M)); grid on;
运行结果:
1、LTI系统的频率响应
第1小题:
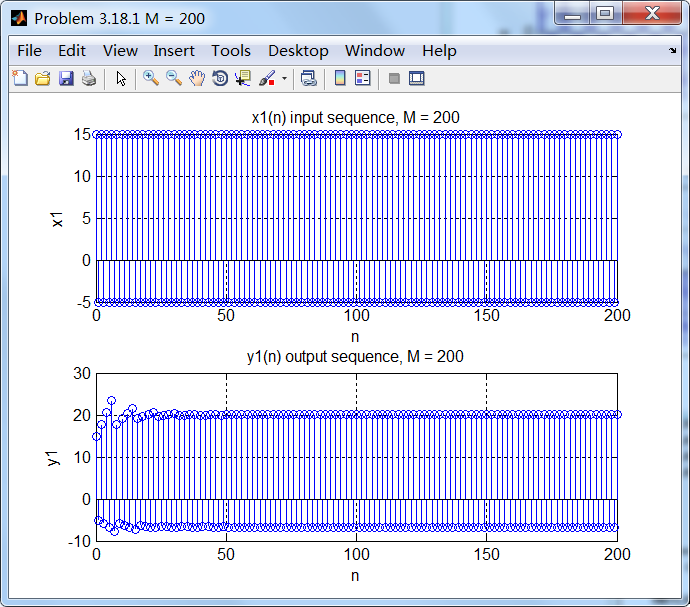
第2小题:
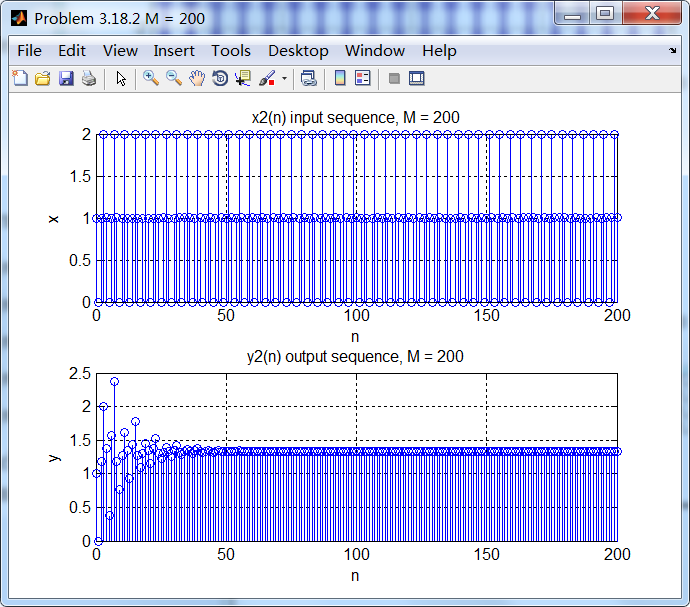
第3小题:
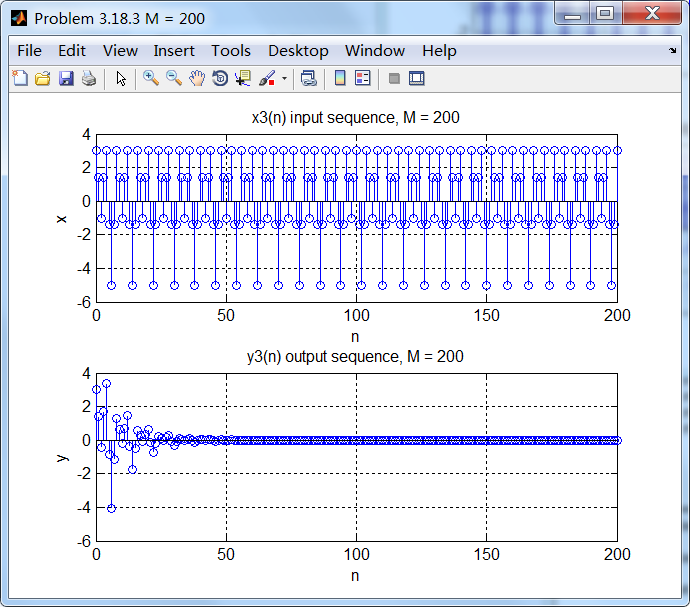
第4小题:
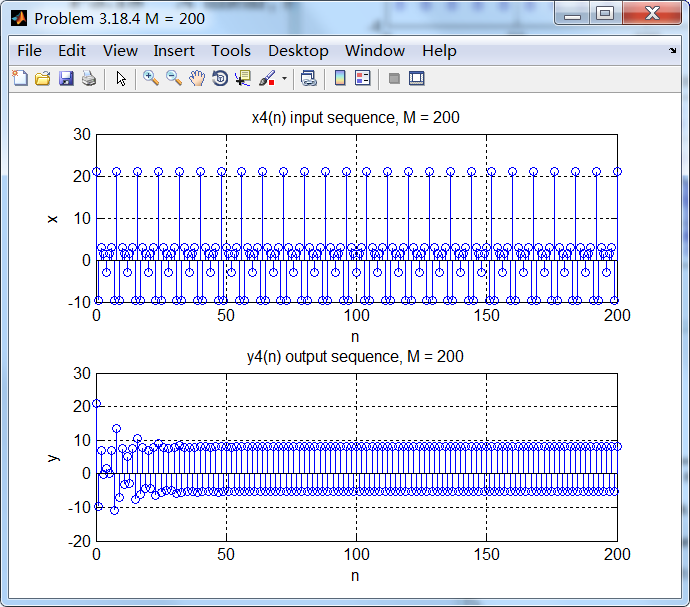
第5小题:
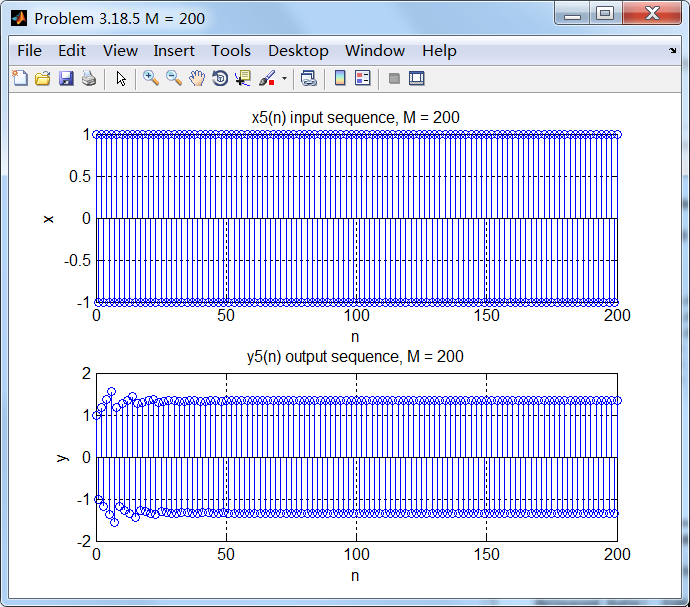
《DSP using MATLAB》Problem 3.18的更多相关文章
- 《DSP using MATLAB》Problem 6.18
代码: %% ++++++++++++++++++++++++++++++++++++++++++++++++++++++++++++++++++++++++++++++++ %% Output In ...
- 《DSP using MATLAB》Problem 5.18
代码: %% ++++++++++++++++++++++++++++++++++++++++++++++++++++++++++++++++++++++++++++++++++++++++ %% O ...
- 《DSP using MATLAB》Problem 4.18
代码: %% ------------------------------------------------------------------------ %% Output Info about ...
- 《DSP using MATLAB》Problem 2.18
1.代码: function [y, H] = conv_tp(h, x) % Linear Convolution using Toeplitz Matrix % ----------------- ...
- 《DSP using MATLAB》Problem 8.18
代码: %% ------------------------------------------------------------------------ %% Output Info about ...
- 《DSP using MATLAB》Problem 5.15
代码: %% ++++++++++++++++++++++++++++++++++++++++++++++++++++++++++++++++++++++++++++++++ %% Output In ...
- 《DSP using MATLAB》Problem 4.15
只会做前两个, 代码: %% ---------------------------------------------------------------------------- %% Outpu ...
- 《DSP using MATLAB》Problem 7.27
代码: %% ++++++++++++++++++++++++++++++++++++++++++++++++++++++++++++++++++++++++++++++++ %% Output In ...
- 《DSP using MATLAB》Problem 7.26
注意:高通的线性相位FIR滤波器,不能是第2类,所以其长度必须为奇数.这里取M=31,过渡带里采样值抄书上的. 代码: %% +++++++++++++++++++++++++++++++++++++ ...
随机推荐
- 关于React性能优化
这几天陆陆续续看了一些关于React性能优化的博客,大部分提到的都是React 15.3新加入的PureComponent ,通过使用这个类来减少React的重复渲染,从而提升页面的性能.使用过Rea ...
- Java读取xml
首先将xml的格式展示出来,如下 <?xml version="1.0"?> <configuration> <connectionStrings n ...
- WPF中的动画
动画无疑是WPF中最吸引人的特色之一,其可以像Flash一样平滑地播放并与程序逻辑进行很好的交互.这里我们讨论一下故事板. 在WPF中我们采用Storyboard(故事板)的方式来编写动画,为了对St ...
- codeforces 521a//DNA Alignment// Codeforces Round #295(Div. 1)
题意:如题定义的函数,取最大值的数量有多少? 结论只猜对了一半. 首先,如果只有一个元素结果肯定是1.否则.s串中元素数量分别记为a,t,c,g.设另一个串t中数量为a',t',c',g'.那么,固定 ...
- C# 导出HTML为Excel
最近在项目中需要Excel导出,有多个Sheet页,每个Sheet页的内容比较多,且不是规整的表格,绑定值是个比较麻烦的事,便考虑直接将HTML转换为Excel文件进行导出. 一.使用JS方法将HTM ...
- Jzzhu and Numbers CodeForces - 449D (高维前缀和,容斥)
大意: 给定集合a, 求a的按位与和等于0的非空子集数. 首先由容斥可以得到 $ans = \sum \limits_{0\le x <2^{20}} (-1)^{\alpha} f_x$, 其 ...
- python-day3笔记
1.通信是软件(计算机)与软件(计算机)之间的通信 2.网络指的是: 一:计算机与计算机之间通过物理连接介质(网络设备)连接到一起:光纤--物理连接介质,和网线一样. 二:计算机与计算机之间基于网络协 ...
- vijos1746 floyd
小D的旅行 旅行是一件颇有趣的事情,但是在旅行前规划好路线也很重要. 现在小D计划要去U国旅行. U国有N个城市,M条道路,每条道路都连接着两个城市,并且经过这条道路需要一定的费用wi. 现在小D想要 ...
- en_e out1
1◆e i: ə ɜː e i 2◆ eu 3◆ ew 4◆ ei ey eu ew 5◆ eer ue 6◆ ee u: u 7◆ er ɜː 8◆ ere ie ue ...
- SQL Server 调优系列基础篇 - 索引运算总结
前言 上几篇文章我们介绍了如何查看查询计划.常用运算符的介绍.并行运算的方式,有兴趣的可以点击查看. 本篇将分析在SQL Server中,如何利用先有索引项进行查询性能优化,通过了解这些索引项的应用方 ...