
《DSP using MATLAB》Problem 7.26


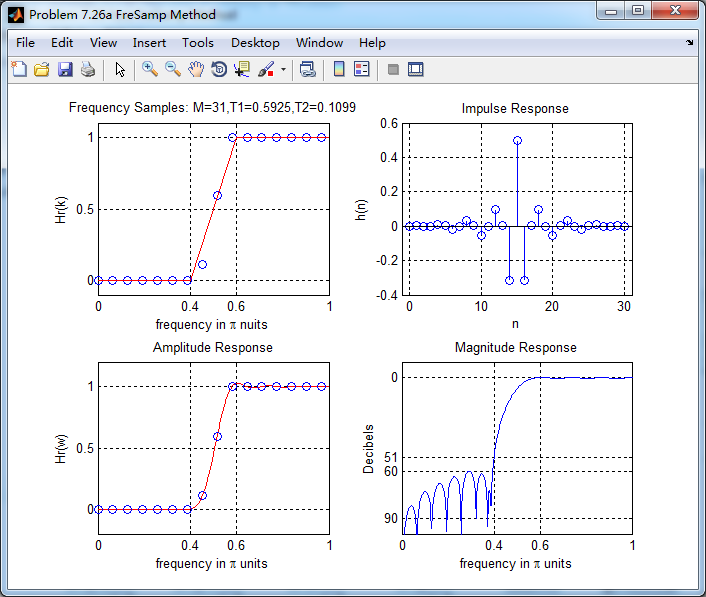
注意:高通的线性相位FIR滤波器,不能是第2类,所以其长度必须为奇数。这里取M=31,过渡带里采样值抄书上的。
代码:
%% ++++++++++++++++++++++++++++++++++++++++++++++++++++++++++++++++++++++++++++++++

%%            Output Info about this m-file

fprintf('\n***********************************************************\n');

fprintf('        <DSP using MATLAB> Problem 7.26 \n\n');

banner();

%% ++++++++++++++++++++++++++++++++++++++++++++++++++++++++++++++++++++++++++++++++

% highpass, Only Type-1 filter

ws1 = 0.4*pi; wp1 = 0.6*pi; As = 50; Rp = 0.004;

tr_width = (wp1-ws1);

T2 = 0.5925; T1=0.1099;

M = 31; alpha = (M-1)/2; l = 0:M-1; wl = (2*pi/M)*l;

n = [0:1:M-1]; wc1 = (ws1+wp1)/2;

Hrs = [zeros(1,7),T1,T2,ones(1,14),T2,T1,zeros(1,6)];           % Ideal Amp Res sampled

Hdr = [0, 0, 1, 1]; wdl = [0, 0.4, 0.6, 1];                     % Ideal Amp Res for plotting

k1 = 0:floor((M-1)/2); k2 = floor((M-1)/2)+1:M-1;

%% --------------------------------------------------

%%                   Type-1 BPF

%% --------------------------------------------------

angH = [-alpha*(2*pi)/M*k1, alpha*(2*pi)/M*(M-k2)];

H = Hrs.*exp(j*angH); h = real(ifft(H, M));

[db, mag, pha, grd, w] = freqz_m(h, [1]);  delta_w = 2*pi/1000;

%[Hr,ww,P,L] = ampl_res(h);

[Hr, ww, a, L] = Hr_Type1(h);

Rp = -(min(db(floor(wp1/delta_w)+1 :1: 501)));     % Actual Passband Ripple

fprintf('\nActual Passband Ripple is %.4f dB.\n', Rp);

As = -round(max(db(1:1:floor(0.4*pi/delta_w)+1)));        % Min Stopband attenuation

fprintf('\nMin Stopband attenuation is %.4f dB.\n', As);

[delta1, delta2] = db2delta(Rp, As)

% Plot

figure('NumberTitle', 'off', 'Name', 'Problem 7.26a FreSamp Method')

set(gcf,'Color','white');

subplot(2,2,1); plot(wl(1:16)/pi, Hrs(1:16), 'o', wdl, Hdr, 'r'); axis([0, 1, -0.1, 1.1]);

set(gca,'YTickMode','manual','YTick',[0,0.5,1]);

set(gca,'XTickMode','manual','XTick',[0,0.4,0.6,1]);

xlabel('frequency in \pi nuits'); ylabel('Hr(k)'); title('Frequency Samples: M=31,T1=0.5925,T2=0.1099');

grid on;

subplot(2,2,2); stem(l, h); axis([-1, M, -0.4, 0.6]); grid on;

xlabel('n'); ylabel('h(n)'); title('Impulse Response');

subplot(2,2,3); plot(ww/pi, Hr, 'r', wl(1:16)/pi, Hrs(1:16), 'o'); axis([0, 1, -0.2, 1.2]); grid on;

xlabel('frequency in \pi units'); ylabel('Hr(w)'); title('Amplitude Response');

set(gca,'YTickMode','manual','YTick',[0,0.5,1]);

set(gca,'XTickMode','manual','XTick',[0,0.4,0.6,1]);

subplot(2,2,4); plot(w/pi, db); axis([0, 1, -100, 10]); grid on;

xlabel('frequency in \pi units'); ylabel('Decibels'); title('Magnitude Response');

set(gca,'YTickMode','manual','YTick',[-90,-60,-51,0]);

set(gca,'YTickLabelMode','manual','YTickLabel',['90';'60';'51';' 0']);

set(gca,'XTickMode','manual','XTick',[0,0.4,0.6,1]);

figure('NumberTitle', 'off', 'Name', 'Problem 7.26 h(n) FreSamp Method')

set(gcf,'Color','white');

subplot(2,2,1); plot(w/pi, db); grid on; axis([0 2 -120 10]);

set(gca,'YTickMode','manual','YTick',[-90,-60,-51,0])

set(gca,'YTickLabelMode','manual','YTickLabel',['90';'60';'51';' 0']);

set(gca,'XTickMode','manual','XTick',[0,0.4,0.6,1,1.4,1.6,2]);

xlabel('frequency in \pi units'); ylabel('Decibels'); title('Magnitude Response in dB');

subplot(2,2,3); plot(w/pi, mag); grid on; %axis([0 1 -100 10]);

xlabel('frequency in \pi units'); ylabel('Absolute'); title('Magnitude Response in absolute');

set(gca,'XTickMode','manual','XTick',[0,0.4,0.6,1,1.4,1.6,2]);

set(gca,'YTickMode','manual','YTick',[0,1.0]);

subplot(2,2,2); plot(w/pi, pha); grid on; %axis([0 1 -100 10]);

xlabel('frequency in \pi units'); ylabel('Rad'); title('Phase Response in Radians');

subplot(2,2,4); plot(w/pi, grd*pi/180);  grid on; %axis([0 1 -100 10]);

xlabel('frequency in \pi units'); ylabel('Rad'); title('Group Delay');

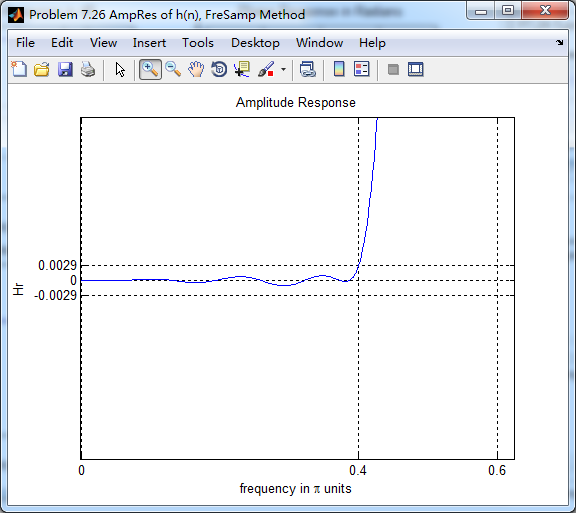
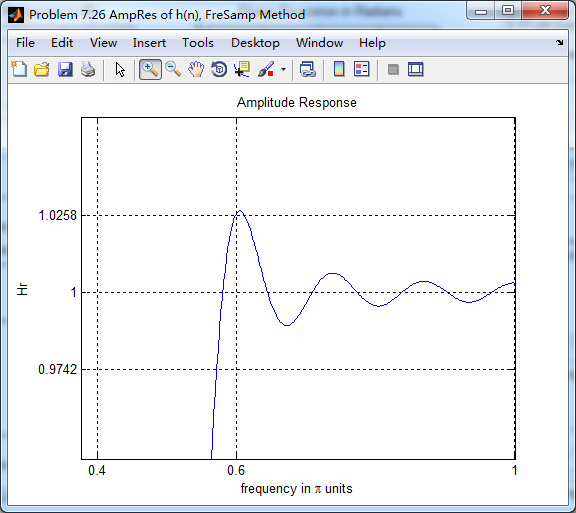
figure('NumberTitle', 'off', 'Name', 'Problem 7.26 AmpRes of h(n), FreSamp Method')

set(gcf,'Color','white');

plot(ww/pi, Hr); grid on; %axis([0 1 -100 10]);

xlabel('frequency in \pi units'); ylabel('Hr'); title('Amplitude Response');

set(gca,'YTickMode','manual','YTick',[-delta2, 0,delta2, 1-0.0258, 1,1+0.0258]);

%set(gca,'YTickLabelMode','manual','YTickLabel',['90';'45';' 0']);

set(gca,'XTickMode','manual','XTick',[0,0.4,0.6,1]);

%% ------------------------------------

%%     fir2 Method

%% ------------------------------------

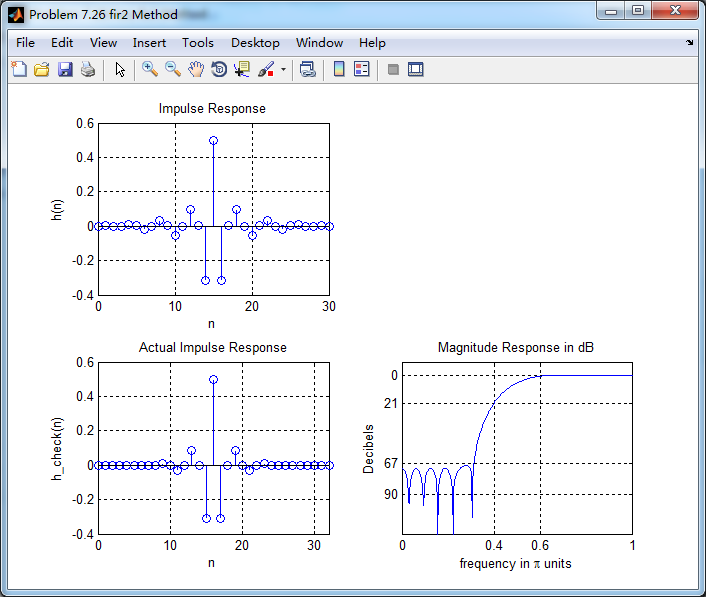
f = [0 ws1 wp1 pi]/pi;

m = [0  0  1  1 ];

h_check = fir2(M+1, f, m);          % if M is odd, then M+1; order

[db, mag, pha, grd, w] = freqz_m(h_check, [1]);

%[Hr,ww,P,L] = ampl_res(h_check);

[Hr, ww, a, L] = Hr_Type1(h_check);

fprintf('\n----------------------------------\n');

fprintf('\n fir2 function Method \n');

fprintf('\n----------------------------------\n');

Rp = -(min(db(floor(wp1/delta_w)+1 :1: 501)));             % Actual Passband Ripple

fprintf('\nActual Passband Ripple is %.4f dB.\n', Rp);

As = -round(max(db(1:1:floor(0.4*pi/delta_w)+1 )));                % Min Stopband attenuation

fprintf('\nMin Stopband attenuation is %.4f dB.\n', As);

[delta1, delta2] = db2delta(Rp, As)

figure('NumberTitle', 'off', 'Name', 'Problem 7.26 fir2 Method')

set(gcf,'Color','white');

subplot(2,2,1); stem(n, h); axis([0 M-1 -0.4 0.6]); grid on;

xlabel('n'); ylabel('h(n)'); title('Impulse Response');

%subplot(2,2,2); stem(n, w_ham); axis([0 M-1 0 1.1]); grid on;

%xlabel('n'); ylabel('w(n)'); title('Hamming Window');

subplot(2,2,3); stem([0:M+1], h_check); axis([0 M+1 -0.4 0.6]); grid on;

xlabel('n'); ylabel('h\_check(n)'); title('Actual Impulse Response');

subplot(2,2,4); plot(w/pi, db); axis([0 1 -120 10]); grid on;

set(gca,'YTickMode','manual','YTick',[-90,-67,-21,0])

set(gca,'YTickLabelMode','manual','YTickLabel',['90';'67';'21';' 0']);

set(gca,'XTickMode','manual','XTick',[0,0.4,0.6,1]);

xlabel('frequency in \pi units'); ylabel('Decibels'); title('Magnitude Response in dB');

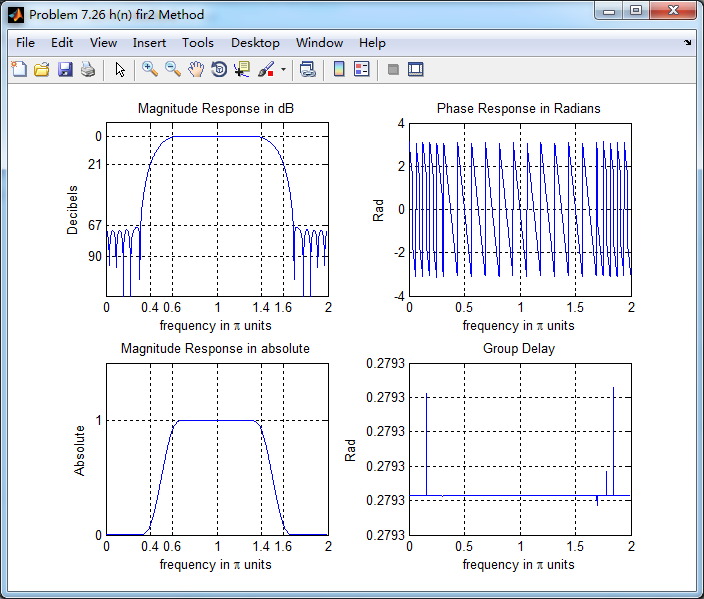
figure('NumberTitle', 'off', 'Name', 'Problem 7.26 h(n) fir2 Method')

set(gcf,'Color','white');

subplot(2,2,1); plot(w/pi, db); grid on; axis([0 2 -120 10]);

xlabel('frequency in \pi units'); ylabel('Decibels'); title('Magnitude Response in dB');

set(gca,'YTickMode','manual','YTick',[-90,-67,-21,0]);

set(gca,'YTickLabelMode','manual','YTickLabel',['90';'67';'21';' 0']);

set(gca,'XTickMode','manual','XTick',[0,0.4,0.6,1,1.4,1.6,2]);

subplot(2,2,3); plot(w/pi, mag); grid on; %axis([0 1 -100 10]);

xlabel('frequency in \pi units'); ylabel('Absolute'); title('Magnitude Response in absolute');

set(gca,'XTickMode','manual','XTick',[0,0.4,0.6,1,1.4,1.6,2]);

set(gca,'YTickMode','manual','YTick',[0,1.0]);

subplot(2,2,2); plot(w/pi, pha); grid on; %axis([0 1 -100 10]);

xlabel('frequency in \pi units'); ylabel('Rad'); title('Phase Response in Radians');

subplot(2,2,4); plot(w/pi, grd*pi/180);  grid on; %axis([0 1 -100 10]);

xlabel('frequency in \pi units'); ylabel('Rad'); title('Group Delay');

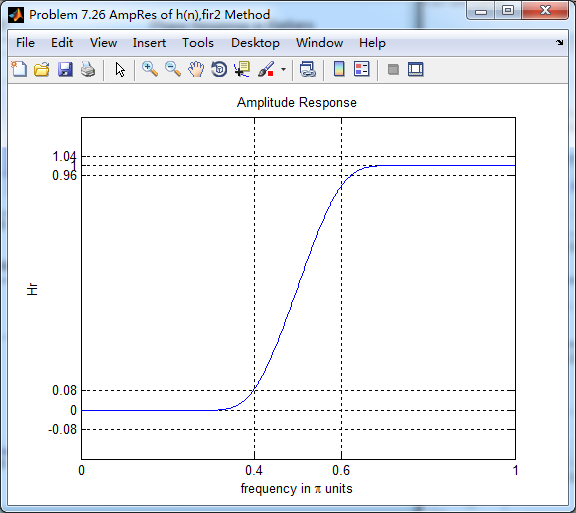
figure('NumberTitle', 'off', 'Name', 'Problem 7.26 AmpRes of h(n),fir2 Method')

set(gcf,'Color','white');

plot(ww/pi, Hr); grid on; %axis([0 1 -100 10]);

xlabel('frequency in \pi units'); ylabel('Hr'); title('Amplitude Response');

set(gca,'YTickMode','manual','YTick',[-0.08, 0,0.08, 1-0.04, 1,1+0.04]);

%set(gca,'YTickLabelMode','manual','YTickLabel',['90';'45';' 0']);

set(gca,'XTickMode','manual','XTick',[0,0.4,0.6,1]);
运行结果:


振幅响应


《DSP using MATLAB》Problem 7.26的更多相关文章
- 《DSP using MATLAB》Problem 8.26
代码: %% ------------------------------------------------------------------------ %% Output Info about ...
- 《DSP using MATLAB》Problem 4.26
Y(z)部分分式展开, 零状态响应和零输入响应的部分分式展开,
- 《DSP using MATLAB》Problem 5.24-5.25-5.26
代码: function y = circonvt(x1,x2,N) %% N-point Circular convolution between x1 and x2: (time domain) ...
- 《DSP using MATLAB》Problem 7.16
使用一种固定窗函数法设计带通滤波器. 代码: %% ++++++++++++++++++++++++++++++++++++++++++++++++++++++++++++++++++++++++++ ...
- 《DSP using MATLAB》Problem 6.8
代码: %% ++++++++++++++++++++++++++++++++++++++++++++++++++++++++++++++++++++++++++++++++ %% Output In ...
- 《DSP using MATLAB》Problem 2.16
先由脉冲响应序列h(n)得到差分方程系数,过程如下: 代码: %% ------------------------------------------------------------------ ...
- 《DSP using MATLAB》Problem 7.32
代码: %% ++++++++++++++++++++++++++++++++++++++++++++++++++++++++++++++++++++++++++++++++ %% Output In ...
- 《DSP using MATLAB》Problem 7.30
代码: %% ++++++++++++++++++++++++++++++++++++++++++++++++++++++++++++++++++++++++++++++++ %% Output In ...
- 《DSP using MATLAB》Problem 7.27
代码: %% ++++++++++++++++++++++++++++++++++++++++++++++++++++++++++++++++++++++++++++++++ %% Output In ...
随机推荐
- fastreport窗口重置(适用于属性、数据等窗口显示不出来)
找到如下路径: C:/Users/账户名/AppData/Local/FastReport/FastReport.config 删除即可. 记得先退出使用FastReport的程序,再删除
- Nexus3.x安装及配置
若排版紊乱可查看我的个人博客原文地址 搭建maven私服主要是为了方便在一个团队中使用maven中央仓库没有的jar包,这些非中央仓库的jar包可能是自己团队开发的公共依赖jar包,可能是第三方私有的 ...
- Android 偏门xml属性
在 recycleView listview scroview 等等 活动的时候会出现蓝边 android:overScrollMode="never" 用次属性可以去掉 fadi ...
- dom编程艺术笔记1--第二章
第二章语法部分: 1.js注释:<!-- XXXXX 而“-->”这部分js会认为是注释内容的一部分 2.var 声明变量 不用声明变量类型 3.声明使用一个数组语法:var object ...
- hadoop streaming字段排序介绍
我们在使用hadoop streaming的时候默认streaming的map和reduce的separator不指定的话,map和reduce会根据它们默认的分隔符来进行排序 map.reduce: ...
- web开发中 代码解决部分IE兼容问题
首先是自己遇到问题: 一套系统,以前的开发asp旧+c#新后台管理扩展.完善后,在2013年前基本无问题,很是畅顺. 其中.到升级了浏览器后.例如ie9以后,则问题出现了. 如图: 这是一个js的 ...
- 【转】Android-Input input&按键布局文件
https://source.android.com/devices/input 输入 Android 输入子系统名义上是由遍历系统多个层的事件管道组成. 输入管道 在最低层,物理输入设备会生成描述状 ...
- 2017-10-6模拟赛T1 手工(handicraft.*)
题目 题解 题意很明显,就不讲了. 我们发现从一个A边形切出一个B边形有几种情况: 1. 得到一个(A-B+2)边形和一个B边形(直线过两顶点): 2. 得到一个(A-B+3)边形和一个B边形(直线过 ...
- JS调用本地设备
JS 允许通过 navigator.mediaDevices.getUserMedia(options) 直接调用本地的设备,比如麦克风,摄像头等.因为该操作涉及到用户隐私,所以调用的时候会弹框请求权 ...
- 实践练习_使用HTML标签制作一个注册界面03
使用HTML标签制作一个注册界面▲▲▲▲★1) 注册界面需要有用户名.密码.性别(单选).爱好(多选).专业(下拉列表)2) 注册界面需要有隐藏域和文件域3) 注册界面需要有提交和重置按钮4) 将上述 ...