How much training data do you need?
How much training data do you need?
//@樵夫上校: 0. 经验上,10X规则(训练数据是模型参数量的10倍)适用与大多数模型,包括shallow network. 1.线性模型可以应用10X的经验规则,模型参数是特征选择后的数量(PCA等方法)。2.NN可以将10X规则当做训练数据量的下限。

The quality and amount of training data is often the single most dominant factor that determines the performance of a model. Once you have the training data angle covered, the rest usually follows. But exactly how much training data do you need? The correct answer is: it depends. It depends on the task you are trying to perform, the performance you want to achieve, the input features you have, the noise in the training data, the noise in your extracted features, the complexity of your model and so on. So the way to find out the interaction of all these variables is to train your model on varying amounts of training data and plot learning curves. But this requires you to already have some decent amount of training data to construct interesting plots. What do you do when you are just starting out? Or when you suspect you have too little training data and want to estimate how big a problem you are in?
So instead of the dead accurate “correct” answer to the problem, how about an estimate, a practical rule of thumb? One way out is to take an empirical approach as follows. First, automatically generate a lot of logistic regression problems. For each generated problem, study the relationship between the amount of training data and the performance of the trained models. Observing this relationship over a range of problems, generalize to a simple rule.

Here is the code to generate a range of logistic regression problems and study the effect of varying the amount of training data. The code is based onTensorflow. Running the code doesn’t require any special software or hardware (Tensorflow is open sourced by Google), and I was able to run the entire experiment on my laptop. Upon running, the code spits out the graph below.
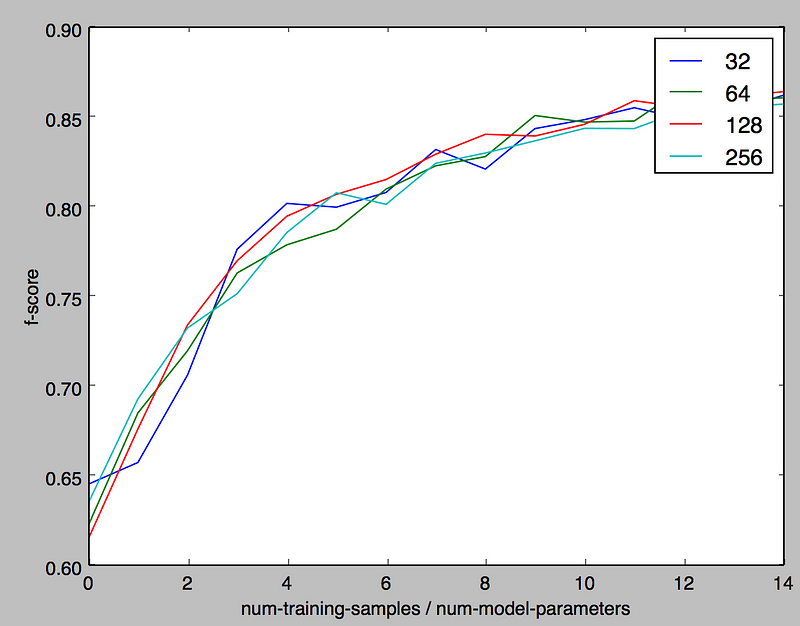
The x-axis is the ratio of the number of training samples to the number of model parameters. The y-axis is the f-score of the trained model. The curves in different colors correspond to models that differ in the number of parameters. For example, the red curve which corresponds to a model with 128 parameters indicate how the fscore changes as one varies the number of training samples to 128 x 1, 128 x 2 and so on.
The first observation is that the f-score curves don’t vary as the parameters scale. This is expected given the models are linear and it’s good to see that some hidden non-linearity doesn’t creep in. Of course, larger models need more training data, but for a given ratio of the number of training samples to the number of model parameters you get the same peformance. The second observation is that when the ratio of training samples to model parameters is 10:1, the f-score lands in the vicinity of 0.85 which we take as the definition of a well performing model. This leads us to the rule of 10, namely the amount of training data you need for a well performing model is 10x the number of parameters in the model.
The rule of 10 transforms the problem of estimating the amount of training data required to knowing the number of parameters in the model, so it deserves some discussion. For linear models such as logistic regression, the number of parameters equal the number of input features since the model assigns a parameter corresponding to each feature. However there could be some complications:
- Your features may be sparse, so counting the number of features may not be straightforward.
- Due to regularization and feature selection techniques a lot of features may be discarded, so the real feature count is much smaller than the number of raw features that are input to the model.
One way to tackle the issue is to observe that you don’t really need labeled data to get an estimate of the number of features, even unlabeled examples are sufficient for that purpose. For example, given a large corpus of text, you can generate histograms of word frequencies to understand your feature space before beginning to label the data for training. Given the histogram, you can discard the words in the long tail to get an estimate of the real feature count, which then gives an estimate of the amount of training data you need applying the rule of 10.
Neural networks pose a different set of problems than linear models like logistic regression. To get the number of parameters in a neural network you need to
- Count the number of parameters used in the embedding layer if your input is sparse (see the Tensorflow tutorial on word embeddings for example).
- Count the number of edges in your network.
The problem is the relationship between the parameters in a neural network is no longer linear, so the emperical study we did based on logistic regression doesn’t really apply anymore. In such cases you can treat the rule of 10 as a lower bound to the amount of training data needed.
Despite the complications above, in my experience the rule of 10 seem to work across a wide range of problems, including shallow neural nets. However when in doubt, plug in your own model and assumptions in the Tensorflow code and run the simulation to study it’s effects. Please feel free to share if you gain any insight in the process.

How much training data do you need?的更多相关文章
- 阅读笔记 The Impact of Imbalanced Training Data for Convolutional Neural Networks [DegreeProject2015] 数据分析型
The Impact of Imbalanced Training Data for Convolutional Neural Networks Paulina Hensman and David M ...
- 什么情况下使用large training data会非常有效
收集大量的数据可能比算法的优劣更重要 Banko和Brill在2001年做了一个研究,是关于在句子中对易混单词进行识别,画出了上图的右边的那个图,这个图显示了对于不同的算法,它们的表现相似,但是随着t ...
- 论文解读(SR-GNN)《Shift-Robust GNNs: Overcoming the Limitations of Localized Graph Training Data》
论文信息 论文标题:Shift-Robust GNNs: Overcoming the Limitations of Localized Graph Training Data论文作者:Qi Zhu, ...
- [Tensorflow] Object Detection API - prepare your training data
From: TensorFlow Object Detection API This chapter help you to train your own model to identify obje ...
- 16 On Large-Batch Training for Deep Learning: Generalization Gap and Sharp Minima 1609.04836v1
Nitish Shirish Keskar, Dheevatsa Mudigere, Jorge Nocedal, Mikhail Smelyanskiy, Ping Tak Peter Tang N ...
- Data Transformation / Learning with Counts
机器学习中离散特征的处理方法 Updated: August 25, 2016 Learning with counts is an efficient way to create a compact ...
- 一天一经典Reducing the Dimensionality of Data with Neural Networks [Science2006]
别看本文没有几页纸,本着把经典的文多读几遍的想法,把它彩印出来看,没想到效果很好,比在屏幕上看着舒服.若用蓝色的笔圈出重点,这篇文章中几乎要全蓝.字字珠玑. Reducing the Dimensio ...
- Deep Learning in a Nutshell: History and Training
Deep Learning in a Nutshell: History and Training This series of blog posts aims to provide an intui ...
- Deep Learning 16:用自编码器对数据进行降维_读论文“Reducing the Dimensionality of Data with Neural Networks”的笔记
前言 论文“Reducing the Dimensionality of Data with Neural Networks”是深度学习鼻祖hinton于2006年发表于<SCIENCE > ...
随机推荐
- C# 改变无边框窗体的尺寸大小
以下代码为修改窗体尺寸的代码: const int HTLEFT = 10; ; ; ; ; ; const int HTBOTTOMLEFT = 0x10; ; protected override ...
- 蒙古人交友网站 www.mengguren.com
蒙古人交友http://www.mengguren.com/ 经过一个多月的努力,终于上线了,虽然长得丑陋一些.功能简单一些,欢迎大家注册,方便别人能找到您.吉日嘎拉<252056973@qq. ...
- js中的预加载与懒加载(延迟加载)
js中加载分两种:预加载与延迟加载 一. 预加载,增强用户的体验,但会加载服务器的负担.一般会使用多种 CSS(background).JS(Image).HTML(<img />) . ...
- memcached缓存失效时的高并发访问问题解决
memcached一般用于在访问一些性能相对低下的数据接口时(如数据库),为了保证这些数据接口的稳定性,加上memcached以减少访问次数,保证这些数据接口的健壮性.一般memcached的数据都是 ...
- Silverlight自定义控件开发:温度计
由于在实际项目中需要实时显示采集到的空气温湿度,土壤温湿度值,需要用比较显眼并且清楚明了的方式来展示,这里我们准备采用温度计的方式来进行.一方面是因为大家都熟悉这个,知道怎么去看:同时,温度计本身也比 ...
- 20135328信息安全系统设计基础第二周学习总结(vim、gcc、gdb)
第三周学习笔记 学习计时:共8小时 读书:1 代码:5 作业:1 博客:7 一.学习目标 熟悉Linux系统下的开发环境 熟悉vi的基本操作 熟悉gcc编译器的基本原理 熟练使用gcc编译器的常用选项 ...
- FTP+SFTP工具类封装-springmore让开发更简单
github地址:https://github.com/tangyanbo/springmore FTPUtil 该工具基于org.apache.commons.net.ftp.FTPClient进行 ...
- Object C学习笔记21-typedef用法
在上一章的学习过程中遇到了一个关键字typedef,这个关键字是C语言中的关键字,因为Object C是C的扩展同样也是支持typedef的. 一. 基本作用 typedef是C中的关键字,它的主要作 ...
- HTML5——地图应用
我们就拿百度地图举例吧: 废话少说,直接上Demo 简要截图如下:' 简要代码如下: <!DOCTYPE html> <html> <head> <title ...
- AC自动机(转)
http://www.cppblog.com/mythit/archive/2009/04/21/80633.html 首先简要介绍一下AC自动机:Aho-Corasick automation,该算 ...