prometheus + grafana安装部署(centos6.8)
GitHub网址:https://github.com/prometheus/prometheus
软件下载地址:https://prometheus.io/download/
第三方中文介绍:https://github.com/1046102779/prometheus
prometheus介绍
Prometheus是一个开源的系统监控和报警的工具包,最初由SoundCloud发布。
特点:
- 多维数据模型(有metric名称和键值对确定的时间序列)
- 灵活的查询语言
- 不依赖分布式存储
- 通过pull方式采集时间序列,通过http协议传输
- 支持通过中介网关的push时间序列的方式
- 监控数据通过服务或者静态配置来发现
- 支持图表和dashboard等多种方式
组件:
- Prometheus 主程序,主要是负责存储、抓取、聚合、查询方面。
- Alertmanager 程序,主要是负责实现报警功能。
- Pushgateway 程序,主要是实现接收由Client push过来的指标数据,在指定的时间间隔,由主程序来抓取。
- *_exporter 这类是不同系统已经实现了的集成。
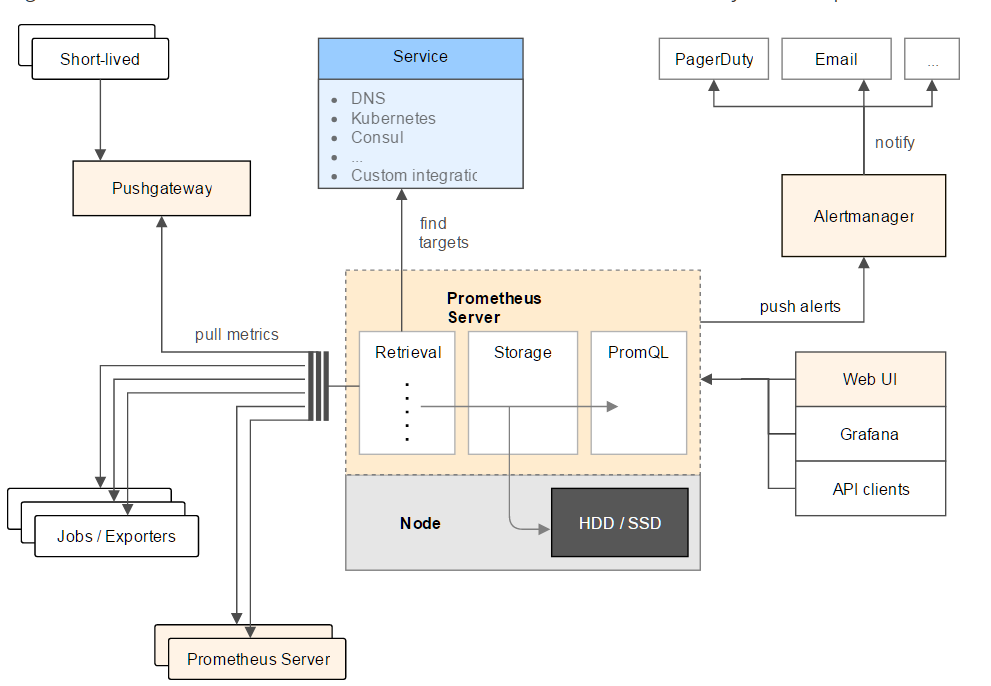
架构:
prometheus部署
1、下载安装包prometheus-1.6.2.linux-amd64.tar.gz
https://github.com/prometheus/prometheus/releases/tag/v1.6.2
2、解压
tar -xvf prometheus-1.6.2.linux-amd64.tar.gz

cd prometheus-1.6.2.linux-amd64
3、配置prometheus.yml
- scrape_interval: 15s # 默认15秒到目标处抓取数据
4、启动
nohup ./prometheus -config.file=prometheus.yml &

或

nohup /opt/prometheus-1.6.2.linux-amd64/prometheus &
5、WEB页面访问http://localhost:9090/ ,可以看到Prometheus的graph页面。
备注:参考文章 http://www.cnblogs.com/vovlie/p/Prometheus_install.html
grafana部署
http://docs.grafana.org/installation/rpm/
1、安装
wget https://s3-us-west-2.amazonaws.com/grafana-releases/release/grafana-4.2.0-1.x86_64.rpm

sudo yum install initscripts fontconfig -y

sudo rpm -Uvh grafana-4.2.0-1.x86_64.rpm
2、启动服务service grafana-server start
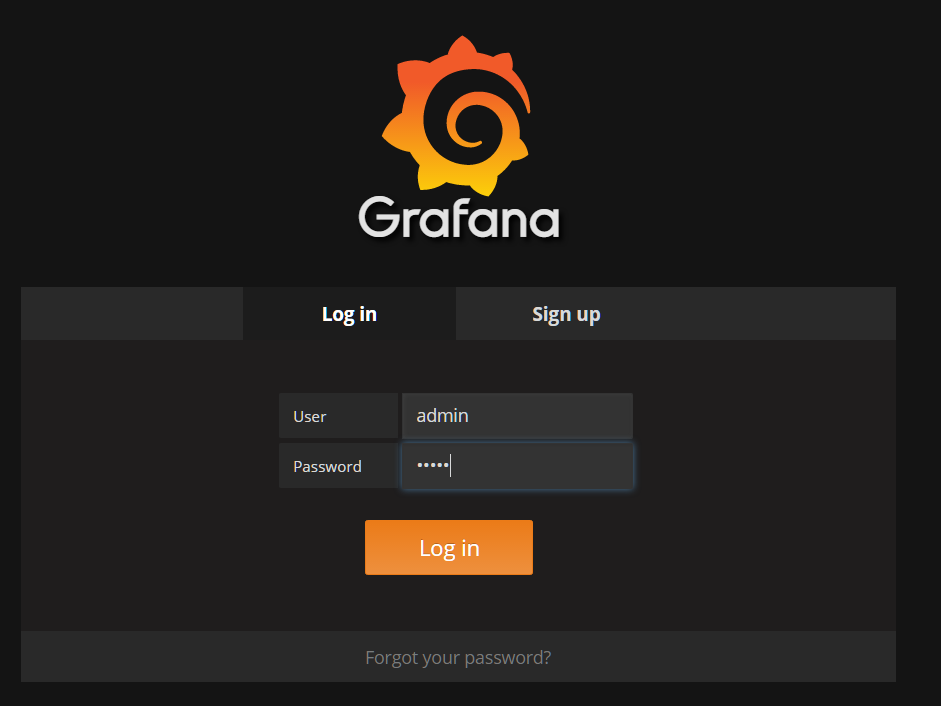
3、访问页面http://localhost:3000 ,默认账号、密码admin/admin
4、Prometheus 和 Grafana 的对接
https://prometheus.io/docs/visualization/grafana/
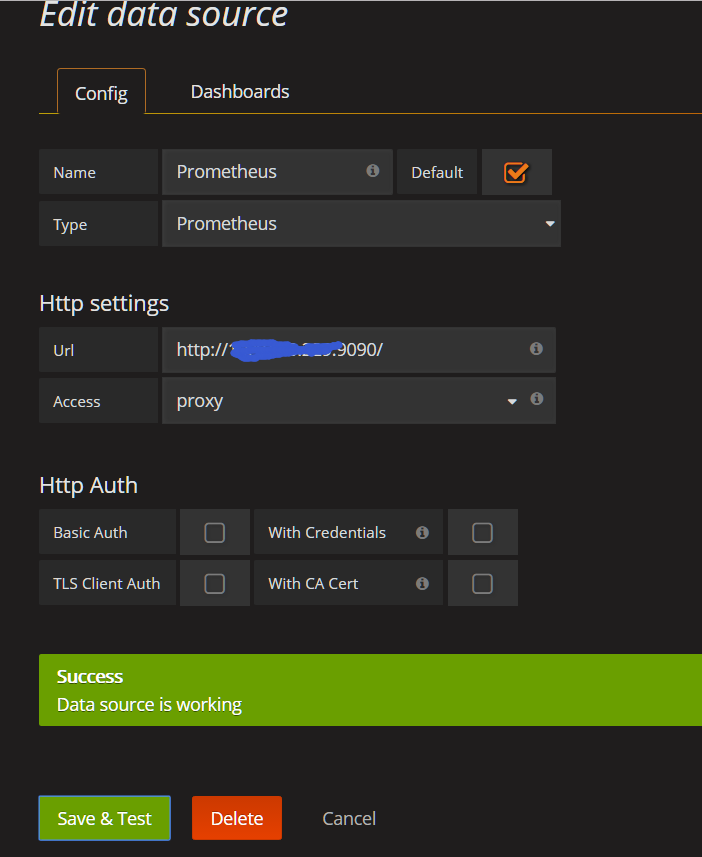
参考文章:http://www.cnblogs.com/sfnz/p/6566951.html
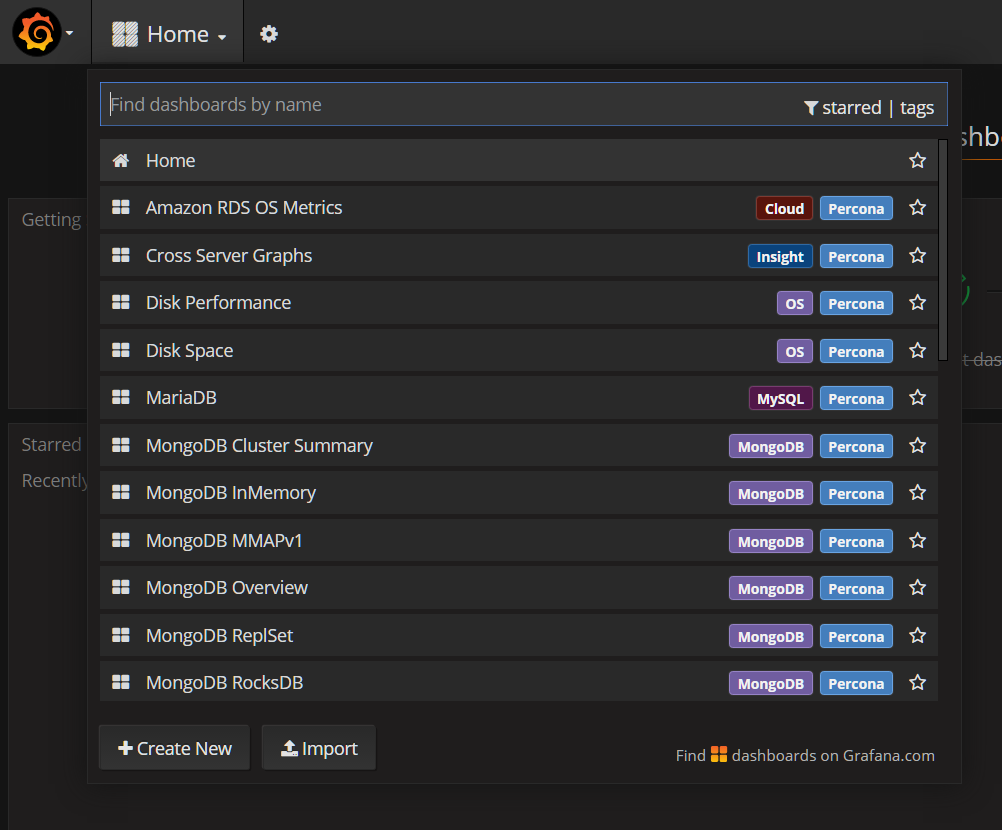
MySQL的dashboards(Grafana)
https://github.com/percona/grafana-dashboards
git clone https://github.com/percona/grafana-dashboards.git

cp -r grafana-dashboards/dashboards /var/lib/grafana/dashboards
编辑Grafana配置文件
vi /etc/grafana/grafana.ini

[dashboards.json]

enabled = true

path = /var/lib/grafana/dashboards
重启service grafana-server restart
mysql监控部署
在需要监控的mysql上安装 node_exporter和 mysqld_exporter
下载 https://prometheus.io/download/
tar -xvf node_exporter-0.14.0.linux-amd64.tar.gz

cd node_exporter-0.14.0.linux-amd64

nohup ./node_exporter &
tar -xvf mysqld_exporter-0.10.0.linux-amd64.tar.gz

cd mysqld_exporter-0.10.0.linux-amd64

vi .my.cnf

[client]

user=root

password=root

./mysqld_exporter -config.my-cnf=".my.cnf" &
服务端配置,文件prometheus.yml
scrape_configs:

  - job_name: 'prometheus'

    static_configs:

      - targets: ['localhost:9090']

  - job_name: 'mysql'

    static_configs:

      - targets: ['10.10.83.162:9104']

        labels:

          instance: db-10.10.83.162

redis监控部署
下载 https://github.com/oliver006/redis_exporter/releases
tar -xvf redis_exporter-v0.11.linux-amd64.tar.gz

nohup /opt/redis_exporter -redis.addr "redis://10.10.83.162:16379" &
grafana配置
下载 redis_exporter-0.11.tar.gz
tar -xvf redis_exporter-0.11.tar.gz

cd redis_exporter-0.11

cp *json /var/lib/grafana/dashboards/
服务端配置,文件prometheus.yml
scrape_configs:

  # The job name is added as a label `job=<job_name>` to any timeseries scraped from this config.

  - job_name: 'prometheus'

    # metrics_path defaults to '/metrics'

    # scheme defaults to 'http'.

    static_configs:

      - targets: ['localhost:9090']

  - job_name: 'mysql'

    static_configs:

      - targets: ['10.10.83.162:9104']

        labels:

          instance: db-10.10.83.162

  - job_name: redis_exporter

    static_configs:

      - targets: ['10.10.83.162:9121']

        labels:

          instance: redis-10.10.83.162
prometheus + grafana安装部署(centos6.8)的更多相关文章
- Prometheus 和 Grafana 安装部署
Prometheus 是一套开源的系统监控报警框架.Prometheus 作为生态圈 Cloud Native Computing Foundation(简称:CNCF)中的重要一员,其活跃度仅次于 ...
- Prometheus(一):Prometheus+Grafana 安装配置
一.基础环境 系统 IP 监控主机 CentOS 7 192.168.56.200 被监控主机 CentOS 7 192.168.56.201 二.Prometheus服务端安装 以下操作皆在监控主机 ...
- Prometheus+Grafana监控部署实践
参考文档: Prometheus github:https://github.com/prometheus grafana github:https://github.com/grafana/graf ...
- 微服务监控神器Prometheus的安装部署
本文涉及:如何在k8s下搭建Prometheus+grafana的监控环境 基本概念 Prometheus提供了容器和云原生领域数据搜集.存储.处理.可视化和告警一套完整的解决方案,最初时是由Soun ...
- Prometheus+Grafana安装搭建
介绍 Prometheus是由SoundCloud开发的开源监控报警系统和时序列数据库(TSDB).Prometheus使用Go语言开发,是Google BorgMon监控系统的开源版本. 2016年 ...
- k8s集群监控 cadvisor/exporter+prometheus+grafana
### k8s监控处理 ### 1.cadvisor/exporter+prometheus+grafana 安装#### 1.1 配置nfs安装```shellubuntu: nfs 服务器 apt ...
- Prometheus + Grafana 部署说明之「安装」
说明 在前面的Prometheus学习系列文章里,大致介绍说明了Prometheus和Grafana的一些使用,现在开始介绍如何从头开始部署Prometheus+Grafana,来监控各个相关的指标数 ...
- prometheus + grafana + node_exporter + alertmanager 的安装部署与邮件报警 (一)
大家一定要先看详细的理论教程,再开始搭建,这样报错后才容易找到突破口 参考文档 https://www.cnblogs.com/afterdawn/p/9020129.html https://www ...
- CentOS7安装部署Prometheus+Grafana (转)
转自:https://www.jianshu.com/p/967cb76cd5ca 作为监控系统的后起之秀,prometheus的安装可谓非常简单,不需要第三方的依赖(数据库.缓存.PHP之类的).下 ...
随机推荐
- MyEclipse 2015 SVN 安装
SVN的在线安装 1.打开MyEclipse,找到顶部菜单栏 Help(帮助)-Install from Site…(从网站安装),如下图 2. 点击Install from Site…后会出现让你选 ...
- 怎样让两个DIV在同一水平线上面显示
css定义第二个div. float:right或者left. margin-top:0px 确保第二个DIV的宽度.如果宽度宽的话,会自动到下方的.
- golang 无法将Slice类型[]a 转换为 Slice[]b
因为我想做一个通用的Slice方法,AnySlice,但是将AnySlice定义为[]interface{ } 转换到别的类型,或者相互转换的时候都是会报错. 这是golang比较恶心人的一个地方了, ...
- mac的vscode配置使用zsh
配置文件 "terminal.integrated.shell.osx": "zsh"
- python接口自动化测试(六)-unittest-单个用例管理
前面五节主要介绍了环境搭建和requests库的使用,可以使用这些进行接口请求的发送.但是如何管理接口案例?返回结果如何自动校验?这些内容光靠上面五节是不行的,因此从本节开始我们引入python单元测 ...
- Can't connect to MySQL server (10065)
在一台机器上连接另一台机器的MySQL服务器时,出现了下面的错误: Can't connect to MySQL server (10065) 这是对方机器没有关闭防火墙造成的,关闭对方机器防火墙以后 ...
- settings设置中文admin
所以更改setttings.py 下 LANGUAGE_CODE = 'zh-Hans'即可
- masonry 基本用法
一:masonry 基本用法 fistView=[[UIView alloc] init]; fistView.backgroundColor=[UIColor redColor]; [self.vi ...
- VNC Viewer 设置屏幕分辨率
1.第一种方法:使用geometry参数进行调整 vncserver -geometry 1280x1024即可,之后通过window下vnc连接后的ubuntu分辨率即为1280x1024了,注意这 ...
- Redis面试刁难大全
转自:https://mp.weixin.qq.com/s?__biz=MzI0MzQyMTYzOQ==&mid=2247483686&idx=1&sn=18dfa0fd08b ...