
Applying the Kappa architecture in the telco industry
https://www.oreilly.com/ideas/applying-the-kappa-architecture-in-the-telco-industry
Kappa architecture and Bayesian models yield quick, accurate analytics in cloud monitoring systems.
May 19, 2016
Ever-growing volumes of data, shorter time constraints, and an increasing need for accuracy are defining the new analytics environment. In the telecom industry, traditional user and network data coexists with machine-to-machine (M2M) traffic, media data, social activities, and so on. In terms of volume, this can be referred to as an “explosion” of data. This is a great business opportunity for telco operators and a key angle to take full advantage of current infrastructure investments (4G, LTE).
In this blog post, we will describe an approach to quickly ingest and analyze large volumes of streaming data, the Kappa architecture, as well as how to build a Bayesian online-learning model to detect novelties in a complex environment. Note that novelty does not necessarily imply an undesired situation; it indicates a change from previously known behaviours.
We apply both Kappa and the Bayesian model to a use case using a data stream originating from a telco cloud monitoring system. The stream is composed of telemetry and log events. It is high volume, as many physical servers and virtual machines are monitored simultaneously.
The proposed method quickly detects anomalies with high accuracy while adapting (learning) over time to new system normals, making it a desirable tool for considerably reducing maintenance costs associated with operability of large computing infrastructures.
What is “Kappa architecture”?
In a 2014 blog post, Jay Kreps accurately coined the term Kappa architecture by pointing out the pitfalls of the Lambda architecture and proposing a potential software evolution. To understand the differences between the two, let's first observe what the Lambda architecture looks like:
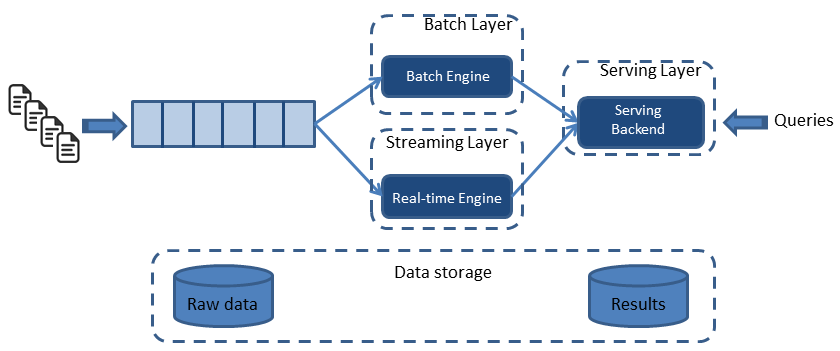 Figure 1. Lambda architecture. Figure courtesy of Ignacio Mulas Viela and Nicolas Seyvet.
As shown in Figure 1, the Lambda architecture is composed of three layers: a batch layer, a real-time (or streaming) layer, and a serving layer. Both the batch and real-time layers receive a copy of the event, in parallel. The serving layer then aggregates and merges computation results from both layers into a complete answer.
The batch layer (aka, historical layer) has two major tasks: managing historical data and recomputing results such as machine learning models. Computations are based on iterating over the entire historical data set. Since the data set can be large, this produces accurate results at the cost of high latency due to high computation time.
The real-time layer( speed layer, streaming layer) provides low-latency results in near real-time fashion. It performs updates using incremental algorithms, thus significantly reducing computation costs, often at the expense of accuracy.
The Kappa architecture simplifies the Lambda architecture by removing the batch layer and replacing it with a streaming layer. To understand how this is possible, one must first understand that a batch is a data set with a start and an end (bounded), while a stream has no start or end and is infinite (unbounded). Because a batch is a bounded stream, one can conclude that batch processing is a subset of stream processing. Hence, the Lambda batch layer results can also be obtained by using a streaming engine. This simplification reduces the architecture to a single streaming engine capable of ingesting the needed volumes of data to handle both batch and real-time processing. Overall system complexity significantly decreases with Kappa architecture. See Figure 2:
 Figure 2. Kappa architecture. Figure courtesy of Ignacio Mulas Viela and Nicolas Seyvet.
Intrinsically, there are four main principles in the Kappa architecture:
Receive weekly insight from industry insiders—plus exclusive content, offers, and more on the topic of data.
- Everything is a stream: Batch operations become a subset of streaming operations. Hence, everything can be treated as a stream.
- Immutable data sources: Raw data (data source) is persisted and views are derived, but a state can always be recomputed as the initial record is never changed.
- Single analytics framework: Keep it short and simple (KISS) principle. A single analytics engine is required. Code, maintenance, and upgrades are considerably reduced.
- Replay functionality: Computations and results can evolve by replaying the historical data from a stream.
In order to respect principle four, the data pipeline must guarantee that events stay in order from generation to ingestion. This is critical to guarantee consistency of results, as this guarantees deterministic computation results. Running the same data twice through a computation must produce the same result.
These four principles do, however, put constraints on building the analytics pipeline.
Building the analytics pipeline
Let ́s start concretizing how we can build such a data pipeline and identify the sorts of components required.
The first component is a scalable, distributed messaging system with events ordering and at-least-once delivery guarantees. Kafka can connect the output of one process to the input of another via a publish-subscribe mechanism. Using it, we can build something similar to the Unix pipe systems where the output produced by one command is the input to the next.
The second component is a scalable stream analytics engine. Inspired by the Google Dataflow paper, Flink, at its core, is a streaming dataflow engine that provides data distribution, communication, and fault tolerance for distributed computations over data streams. One of its most interesting API features allows usage of the event timestamp to build time windows for computations.
The third and fourth components are a real-time analytics store, Elasticsearch, and a powerful visualisation tool, Kibana. Those two components are not critical, but they’re useful to store and display raw data and results.
Mapping the Kappa architecture to its implementation, Figure 3 illustrates the resulting data pipeline:
 Figure 3. Kappa architecture reflected in a data pipeline. Figure courtesy of Ignacio Mulas Viela and Nicolas Seyvet.
This pipeline creates a composable environment where outputs of different jobs can be reused as inputs to another. Each job can thus be reduced to a simple, well-defined role. The composability allows for fast development of new features. In addition, data ordering and delivery are guaranteed, making results consistent. Finally, event timestamps can be used to build time windows for computations.
EBOOK

Applying the above to our telco use case, each physical host and virtual machine (VM) telemetry and log event is collected and sent to Kafka. We use collectd on the hosts, and ceilometer on the VMs for telemetry, and logstash-forwarder for logs. Kafka then delivers this data to different Flink jobs that transform and process the data. This monitoring gives us both the physical and virtual resource views of the system.
With the data pipeline in place, let’s look at how a Bayesian model can be used to detect novelties in a telco cloud.
Incorporating a Bayesian model to do advanced analytics
To detect novelties, we use a Bayesian model. In this context, novelties are defined as unpredicted situations that differ from previous observations. The main idea behind Bayesian statistics is to compare statistical distributions and determine how similar or different they are. The goal here is to:
- determine the distribution of parameters to detect an anomaly,
- compare new samples for each parameter against calculated distributions and determine if the obtained value is expected or not,
- and combine all parameters to determine if there is an anomaly.
Let’s dive into the math to explain how we can perform this operation in our analytics framework. Considering the anomaly A, a new sample z, θ observed parameters, P(θ) the probability distribution of the parameter, A(z|θ) the probability that z is an anomaly, X the samples, the Bayesian Principal Anomaly can be written as:
A (z | X) = ∫A(θ)P(θ|X)
A principal anomaly as defined above is valid also for multivariate distributions. The approach taken evaluates the anomaly for each variable separately, and then combines them into a total anomaly value.
An anomaly detector considers only a small part of the variables, and typically only a single variable with a simple distribution like Poisson or Gauss, can be called a micromodel. A micromodel with gaussian distribution will look like this:
 Figure 4. Micromodel with gaussian distribution. Figure courtesy of Ignacio Mulas Viela and Nicolas Seyvet.
An array of micromodels can then be formed, with one micromodel per variable (or small set of variables). Such an array can be called a component. The anomaly values from the individual detectors then have to be combined into one anomaly value for the whole component. The combination depends on the use case. Since accuracy is important (avoid false positives) and parameters can be assumed to be fairly independent from one another, then the principal anomaly for the component can be calculated as the maximum of the micromodel anomalies, but scaled down to meet the correct false alarm rate (i.e., weighted influence of components to improve the accuracy of the principal anomaly detection).
However, there may be many different “normal” situations. For example, the normal system behavior may vary within weekdays or time of day. Then, it may be necessary to model this with several components, where each component learns the distribution of one cluster. When a new sample arrives, it is tested by each component. If it is considered anomalous by all components, it is considered as anomalous. If any component finds the sample normal, then it is normal.
Learning Path

Learn the entire process of designing and building data applications.
Applying this to our use case, we used this detector to spot errors or deviations from normal operations in a telco cloud. Each parameter θ is any of the captured metrics or logs resulting in many micromodels. By keeping a history of past models, and computing a principal anomaly for the component, we can find statistically relevant novelties. These novelties could come from configuration errors, a new error in the infrastructure, or simply a new state of the overall system (i.e., a new set of virtual machines).
Using the number of generated logs (or log frequency) appears to be the most significant feature to detect novelties. By modeling the statistical function of generated logs over time (or log frequency), the model can spot errors or novelties accurately. For example, let’s consider the case where a database becomes unavailable. At that time, any applications depending on it start logging recurring errors, (e.g., “Database X is unreachable...”). This raises the log frequency, which triggers a novelty in our model and detector.
The overall data pipeline, combining the transformations mentioned before, will look like this:
 Figure 5. Data pipeline with combination of analytics and Bayesian anomaly detector. Figure courtesy of Ignacio Mulas Viela and Nicolas Seyvet.
This data pipeline receives the raw data, extracts statistical information (such as log frequencies per machine), applies the Bayesian anomaly detector over the interesting features (statistical and raw), and outputs novelties whenever they are found.
Conclusion
In this blog post, we have presented an approach using the Kappa architecture and a self-training (online) Bayesian model to yield quick, accurate analytics.
The Kappa architecture allows us to develop a new generation of analytics systems. Remember, this architecture has four main principles: data is immutable, everything is a steam, a single stream engine is used, and data can be replayed. It simplifies both the software systems and the development and maintenance of machine learning models. Those principles can easily be applied to most use cases.
The Bayesian model quickly detects novelties in our cloud. This type of online learning has the advantage of adapting over time to new situations, but one of its main challenges is a lack of ready-to-use algorithms. However, the analytics landscape is evolving fast and we are confident that a richer environment can be expected in the near future.
Ignacio Mulas Viela and Nicolas Seyvet will speak in greater detail on this topic as well as on a telco data set from a running cloud during their session Kappa architecture in the telecom industry at Strata + Hadoop World London 2016, May 31 to June 3, 2016.
Applying the Kappa architecture in the telco industry的更多相关文章
- AnalyticDB实现和特点浅析
目录 AnalyticDB介绍与背景 AnalyticDB详细解析 架构设计 数据分区 读写分离和读写流程 其他特性介绍 混合(列-行)存储引擎 索引 小结 本篇主要是根据AnalyticDB的论文, ...
- Pattern: Microservice Architecture
Microservice Architecture pattern http://microservices.io/patterns/microservices.html Context You ar ...
- 大数据处理中的Lambda架构和Kappa架构
首先我们来看一个典型的互联网大数据平台的架构,如下图所示: 在这张架构图中,大数据平台里面向用户的在线业务处理组件用褐色标示出来,这部分是属于互联网在线应用的部分,其他蓝色的部分属于大数据相关组件,使 ...
- Java中实现SAX解析xml文件到MySQL数据库
大致步骤: 1.Java bean 2.DBHelper.java 3.重写DefaultHandler中的方法:MyHander.java 4.循环写数据库:SAXParserDemo.java ① ...
- DotNet 资源大全中文版(Awesome最新版)
Awesome系列的.Net资源整理.awesome-dotnet是由quozd发起和维护.内容包括:编译器.压缩.应用框架.应用模板.加密.数据库.反编译.IDE.日志.风格指南等. 算法与数据结构 ...
- A Complete List of .NET Open Source Developer Projects
http://scottge.net/2015/07/08/a-complete-list-of-net-open-source-developer-projects/?utm_source=tuic ...
- The world beyond batch: Streaming 101
https://www.oreilly.com/ideas/the-world-beyond-batch-streaming-101 https://www.oreilly.com/ideas/the ...
- .NET 开源开发项目【翻译】
原文地址 本文列出了 .NET 开源开发项目(open source developer projects).意在包括对开发过程的所有方面有所帮组的项目.对于消费项目(consumer project ...
- 20 Interesting WPF Projects on CodePlex
20 Interesting WPF Projects on CodePlex (Some for Silverlight too) Pete Brown - 22 November 2010 I ...
随机推荐
- Pyqt图标下载网站
下载地址: https://www.easyicon.net/ 1.程序中图标建议使用32x32的PNG格式. 2.pyinstaller打包中图标建议使用32x32的ICO格式.
- NGINX域名跳转案列
1.不同域名不同路径跳转 nginx实现a.com/teacher域名跳转到b.com/student 若想实现上面题目的跳转,目前鄙人知道两种方式: 1.return 2.proxy_pass 具体 ...
- 源代码的管理与在eclipse中使用maven进行代码测试
管理源代码的工具 开发历史记录 SVN :集中式的源代码管理工具 通常必须连到公司的服务器上才能正常工作 (提交代码,查看代码的历史记录 查看代码的分支) 在公司中开发项目时 每天必须至少提交(Com ...
- POJ-2184 Cow Exhibition(01背包变形)
Cow Exhibition Time Limit: 1000MS Memory Limit: 65536K Total Submissions: 10949 Accepted: 4344 Descr ...
- Python装饰函数
from time import ctime, sleep def tsfunc(func): def wrappedFunc(): print('[%s] %s() classed' % (ctim ...
- oracle trunc 函数处理日期格式,日期类型很有用的几个sql
select to_char(sysdate,'yyyy-mm-dd hh24:mi:ss') from dual; --显示当前时间2011-12-29 16:24:34 select trunc ...
- Python高阶函数:map、reduece、filter
笔记中函数简介: map函数:遍历序列,对序列中每个元素进行操作,最终获取新的序列. reduce函数:对于序列内所有元素进行累计操作. filter函数:对于序列中的元素进行筛选,最终获取符合条件的 ...
- ArcGIS earth 1.0 beta体验报告——给我一个按钮我将转动整个地球
随着Esri研发中心的ArcGIS earth 1.0 beta版本的全新发布,声势浩大,很多人为之好奇静待观摩其阵容.抽出五分钟体验,良心用户,必得出炉一份体验报告了. -------------- ...
- socket 中午吃的啥 socket 并发服务器 fork
http://www.cnblogs.com/thinksasa/archive/2013/02/26/2934206.html zh.wikipedia.org/wiki/網路插座 在作業系統中,通 ...
- Find The Multiple--POJ1426
Description Given a positive integer n, write a program to find out a nonzero multiple m of n whose ...