
python matplotlib生成图形
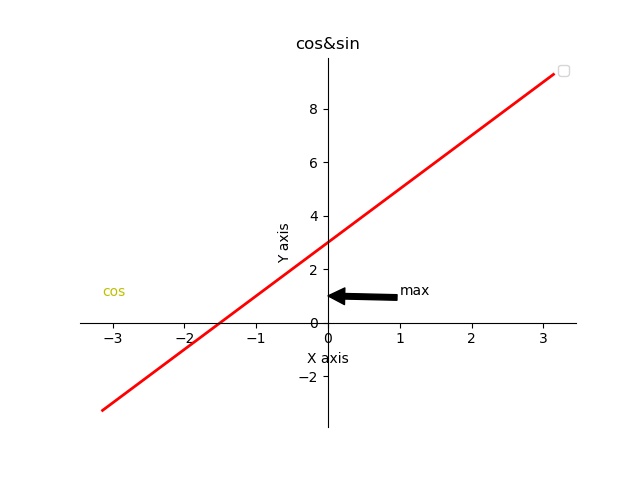
y=2x+3
import matplotlib.pyplot as plt#约定俗成的写法plt

#首先定义两个函数(正弦&余弦)

import numpy as np

#plt.figure(num='正余弦函数图', figsize=(10, 6), dpi=120, facecolor='y', edgecolor='g')

X=np.linspace(-np.pi,np.pi,256,endpoint=True)#-π to+π的256个值

#C,S=np.cos(X),np.sin(X)

S=2*X+3

#S=(X*X)/(1-X)

#S=X*X+2*X

#plt.plot(X,C,color='red', linestyle='-', linewidth=2, label='$sin(x)$')

plt.plot(X,S,color='red', linestyle='-', linewidth=2)

#plt.axis((-6.5, 6.5, -2.1, 2.1)) #轴的取值范围

#在ipython的交互环境中需要这句话才能显示出来

plt.xlabel('X axis')

plt.ylabel('Y axis')

#plt.yticks((-1, 0, 1))

# 设置、显示legend

plt.legend(loc='best')  # loc参数设置图例显示的位置

plt.legend(loc='best')  # loc参数设置图例显示的位置

plt.title('cos&sin')

plt.text(-np.pi, 1, 'cos',fontdict={'size': 10, 'color': 'y'})  # text在图中任意位置添加文字,前两个参数是左下角的位置坐标

plt.annotate('max', xy=(0, 1), xytext=(1, 1.05), arrowprops=dict(facecolor='k', shrink=1))  # 注释的地方xy(x,y)和插入文本的地方

# 移动坐标轴,spines为脊梁,即4个边框

ax = plt.gca()  # gca stands for 'get current axis'

ax.spines['right'].set_color('none')  # 设置右‘脊梁’为无色

ax.spines['top'].set_color('none')  # 设置上‘脊梁’为无色

ax.xaxis.set_ticks_position('bottom')  # 底部‘脊梁’设置为X轴

ax.spines['bottom'].set_position(('data', 0))  # 底部‘脊梁’移动位置,y的data

ax.yaxis.set_ticks_position('left')  # 左部‘脊梁’设置为Y轴

ax.spines['left'].set_position(('data', 0))  # 左部‘脊梁’移动位置,x的data

plt.savefig('d:/test2.png')

plt.show()
y=1/2*X*X
修改;
S=1/2*X*Xy=1/3*x*x*3
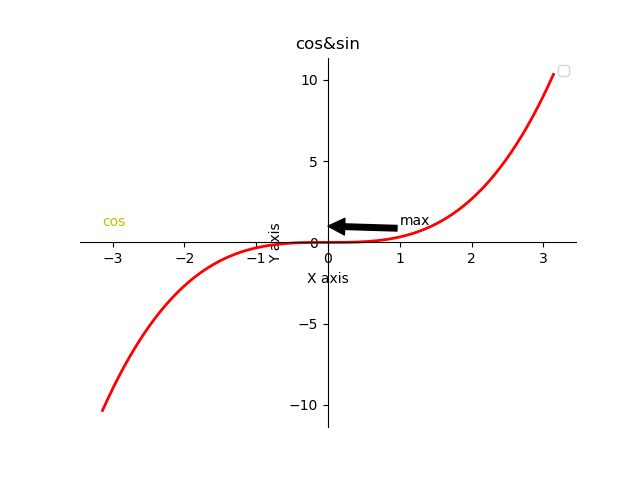
S=1/3*X*X*X
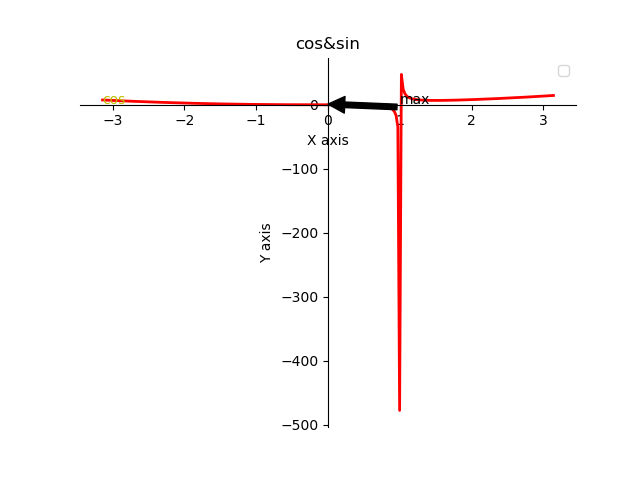
S=X*X*X/(X-1)
余玄函数
S=np.cos(X)
正玄函数
S=np.sin(X)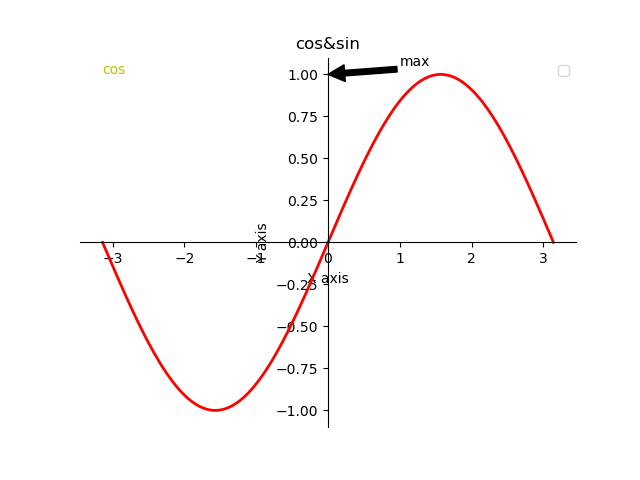
S=np.tan(X)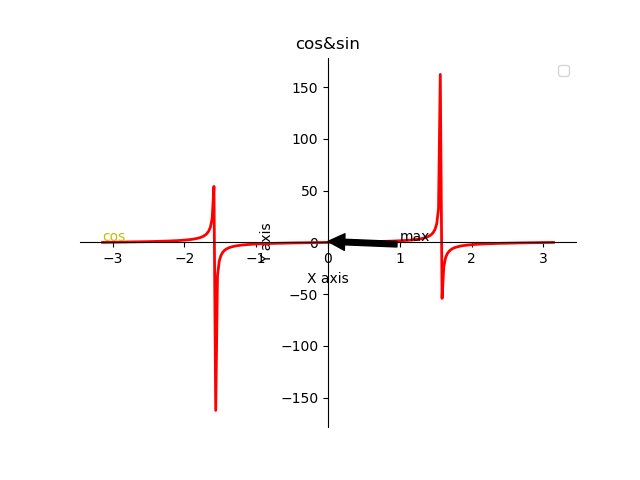
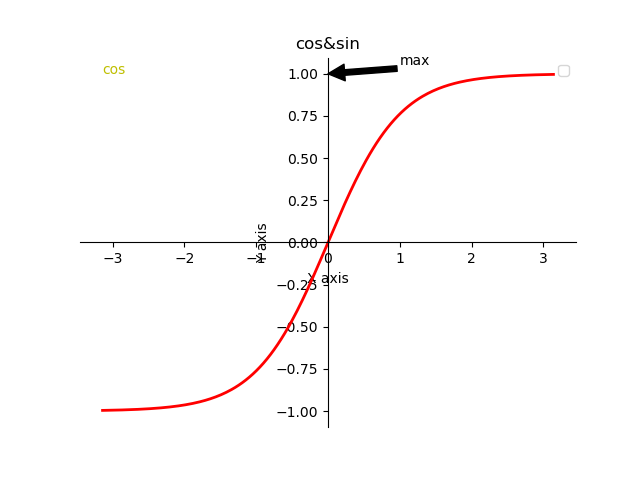
双曲正切
S=np.tanH(X)
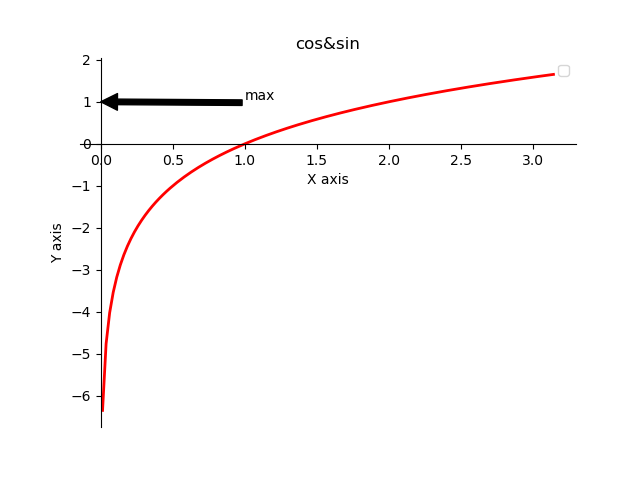
对数函数
S=np.log2(X)
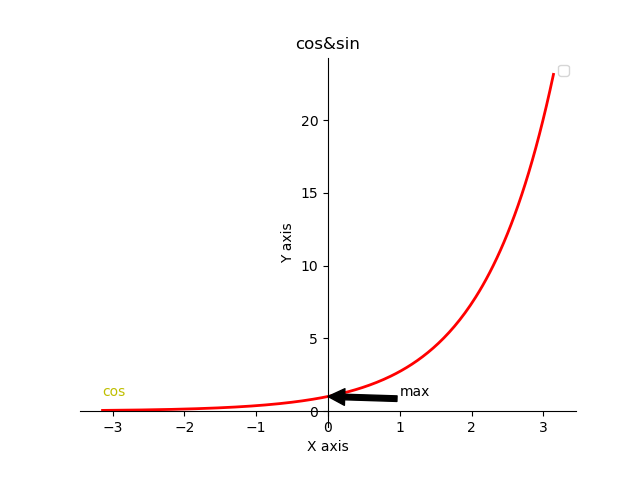
S=pow(np.e,X)
python matplotlib生成图形的更多相关文章
- python matplotlib画图产生的Type 3 fonts字体没有嵌入问题
ScholarOne's 对python matplotlib画图产生的Type 3 fonts字体不兼容,更改措施: 在程序中添加如下语句 import matplotlib matplotlib. ...
- matplotlib 生成 eps 插入到 tex
matplotlib 生成 eps 插入到 tex matplotlib 生成 eps,就可以插入到 tex 中,而且是矢量图,放大不失真. 而且因为图中的元素都是嵌入到 pdf 中,所以图中的文字也 ...
- python matplotlib plot 数据中的中文无法正常显示的解决办法
转发自:http://blog.csdn.net/laoyaotask/article/details/22117745?utm_source=tuicool python matplotlib pl ...
- Python - matplotlib 数据可视化
在许多实际问题中,经常要对给出的数据进行可视化,便于观察. 今天专门针对Python中的数据可视化模块--matplotlib这块内容系统的整理,方便查找使用. 本文来自于对<利用python进 ...
- 转:使用 python Matplotlib 库 绘图 及 相关问题
使用 python Matplotlib 库绘图 转:http://blog.csdn.net/daniel_ustc/article/details/9714163 Matplotlib ...
- 安装python Matplotlib 库
转:使用 python Matplotlib 库 绘图 及 相关问题 使用 python Matplotlib 库绘图 转:http://blog.csdn.net/daniel_ustc ...
- 十分钟快速学会Matplotlib基本图形操作
在学习Python的各种工具包的时候,看网上的各种教程总是感觉各种方法很多很杂,参数的种类和个数也十分的多,理解起来需要花费不少的时间. 所以我在这里通过几个例子,对方法和每个参数都进行详细的解释,这 ...
- Python绘制3D图形
来自:https://www.jb51.net/article/139349.htm 3D图形在数据分析.数据建模.图形和图像处理等领域中都有着广泛的应用,下面将给大家介绍一下如何使用python进行 ...
- python matplotlib.pyplot 散点图详解(1)
python matplotlib.pyplot散点图详解(1) 一.创建散点图 可以用scatter函数创建散点图 并使用show函数显示散点图 代码如下: import matplotlib.py ...
随机推荐
- [LeetCode] 72. 编辑距离 ☆☆☆☆☆(动态规划)
https://leetcode-cn.com/problems/edit-distance/solution/bian-ji-ju-chi-mian-shi-ti-xiang-jie-by-labu ...
- 13.5. zipfile — Work with ZIP archives
13.5. zipfile — Work with ZIP archives Source code: Lib/zipfile.py The ZIP file format is a common a ...
- [https][tls] 如何使用wireshark查看tls/https加密消息--使用keylog
姊妹篇: [ipsec][strongswan] 使用wireshark查看strongswan ipsec esp ikev1 ikev2的加密内容 [https][tls] 如何使用wiresha ...
- C++中与类有关的注意事项(更新中~~~)
关于构造函数的调用次序,见下列代码 #include<iostream> using namespace std; class A { private: int x; public: A( ...
- k8s安装之flannel.yaml
收藏一下,以后直接从这里cp过来用的. flannel新版 --- apiVersion: extensions/v1beta1 kind: PodSecurityPolicy metadata: n ...
- DeferredResult使用方式和场景
为什么使用DeferredResult? API接口需要在指定时间内将异步操作的结果同步返回给前端时: Controller处理耗时任务,并且需要耗时任务的返回结果时: 当一个请求到达API接口,如果 ...
- virtualbox下装ubuntu全屏问题
有两种解决方法: 1.安装增强功能. 2.使用命令: sudo apt-get install virtualbox-guest-dkms 之后需要重启虚拟机,修改分辨率.
- 精妙的SQL语句
说明:复制表(只复制结构,源表名:a 新表名:b)select * into b from a where 1<>1 说明:拷贝表(拷贝数据,源表名:a 目标表名:b)insert i ...
- React vs Angular vs Vue 2019
React vs Angular vs Vue 看待这三个主流框架给出的想法 Angular is the entire kitchen that gives you all the tools ne ...
- bzoj 5299: [Cqoi2018]解锁屏幕 状压dp+二进制
比较简单的状压 dp,令 $f[S][i]$ 表示已经经过的点集为 $S$,且最后一个访问的位置为 $i$ 的方案数. 然后随便转移一下就可以了,可以用 $lowbit$ 来优化一下枚举. code: ...