
Python绘制3D图形
来自:https://www.jb51.net/article/139349.htm
3D图形在数据分析、数据建模、图形和图像处理等领域中都有着广泛的应用,下面将给大家介绍一下如何使用python进行3D图形的绘制,包括3D散点、3D表面、3D轮廓、3D直线(曲线)以及3D文字等的绘制。
准备工作:
python中绘制3D图形,依旧使用常用的绘图模块matplotlib,但需要安装mpl_toolkits工具包,安装方法如下:windows命令行进入到python安装目录下的Scripts文件夹下,执行: pip install --upgrade matplotlib即可;linux环境下直接执行该命令。
安装好这个模块后,即可调用mpl_tookits下的mplot3d类进行3D图形的绘制。
下面以实例进行说明。
1、3D表面形状的绘制
|
1
2
3
4
5
6
7
8
9
10
11
12
13
14
15
16
17
18
|
from mpl_toolkits.mplot3d import Axes3D import matplotlib.pyplot as plt import numpy as np fig = plt.figure() ax = fig.add_subplot(111, projection='3d') # Make data u = np.linspace(0, 2 * np.pi, 100) v = np.linspace(0, np.pi, 100) x = 10 * np.outer(np.cos(u), np.sin(v)) y = 10 * np.outer(np.sin(u), np.sin(v)) z = 10 * np.outer(np.ones(np.size(u)), np.cos(v)) # Plot the surface ax.plot_surface(x, y, z, color='b') plt.show() |
球表面,结果如下:

2、3D直线(曲线)的绘制
|
1
2
3
4
5
6
7
8
9
10
11
12
13
14
15
16
17
18
|
import matplotlib as mpl from mpl_toolkits.mplot3d import Axes3D import numpy as np import matplotlib.pyplot as plt mpl.rcParams['legend.fontsize'] = 10 fig = plt.figure() ax = fig.gca(projection='3d') theta = np.linspace(-4 * np.pi, 4 * np.pi, 100) z = np.linspace(-2, 2, 100) r = z**2 + 1x = r * np.sin(theta) y = r * np.cos(theta) ax.plot(x, y, z, label='parametric curve') ax.legend() plt.show() |
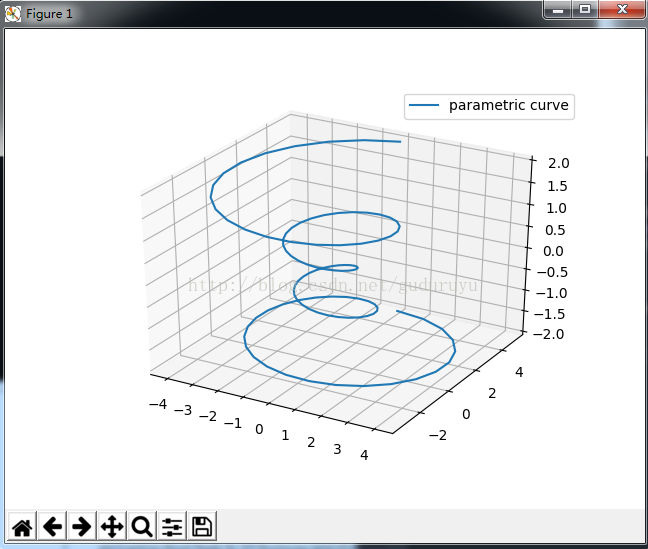
这段代码用于绘制一个螺旋状3D曲线,结果如下:
3、绘制3D轮廓
|
1
2
3
4
5
6
7
8
9
10
11
12
13
14
15
16
17
18
19
|
from mpl_toolkits.mplot3d import axes3d import matplotlib.pyplot as plt from matplotlib import cm fig = plt.figure() ax = fig.gca(projection='3d') X, Y, Z = axes3d.get_test_data(0.05) cset = ax.contour(X, Y, Z, zdir='z', offset=-100, cmap=cm.coolwarm) cset = ax.contour(X, Y, Z, zdir='x', offset=-40, cmap=cm.coolwarm) cset = ax.contour(X, Y, Z, zdir='y', offset=40, cmap=cm.coolwarm) ax.set_xlabel('X') ax.set_xlim(-40, 40) ax.set_ylabel('Y') ax.set_ylim(-40, 40) ax.set_zlabel('Z') ax.set_zlim(-100, 100) plt.show() |
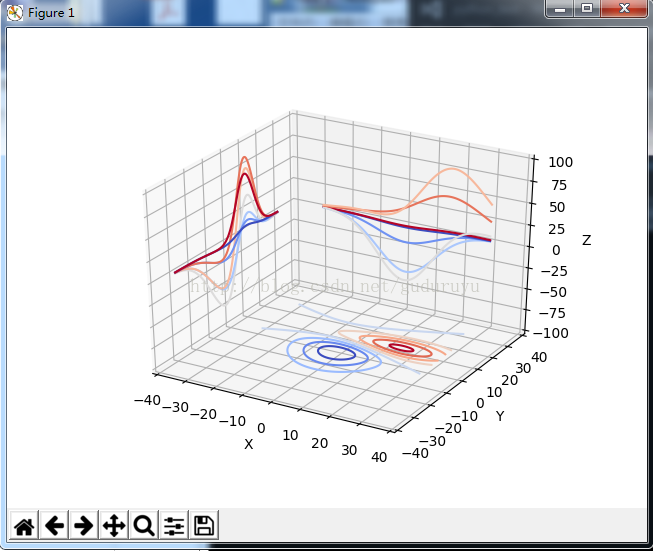
绘制结果如下:
4、绘制3D直方图
|
1
2
3
4
5
6
7
8
9
10
11
12
13
14
15
16
17
18
19
20
21
22
23
24
25
26
|
from mpl_toolkits.mplot3d import Axes3D import matplotlib.pyplot as plt import numpy as np fig = plt.figure() ax = fig.add_subplot(111, projection='3d') x, y = np.random.rand(2, 100) * 4hist, xedges, yedges = np.histogram2d(x, y, bins=4, range=[[0, 4], [0, 4]]) # Construct arrays for the anchor positions of the 16 bars. # Note: np.meshgrid gives arrays in (ny, nx) so we use 'F' to flatten xpos, # ypos in column-major order. For numpy >= 1.7, we could instead call meshgrid # with indexing='ij'. xpos, ypos = np.meshgrid(xedges[:-1] + 0.25, yedges[:-1] + 0.25) xpos = xpos.flatten('F') ypos = ypos.flatten('F') zpos = np.zeros_like(xpos) # Construct arrays with the dimensions for the 16 bars. dx = 0.5 * np.ones_like(zpos) dy = dx.copy() dz = hist.flatten() ax.bar3d(xpos, ypos, zpos, dx, dy, dz, color='b', zsort='average') plt.show() |
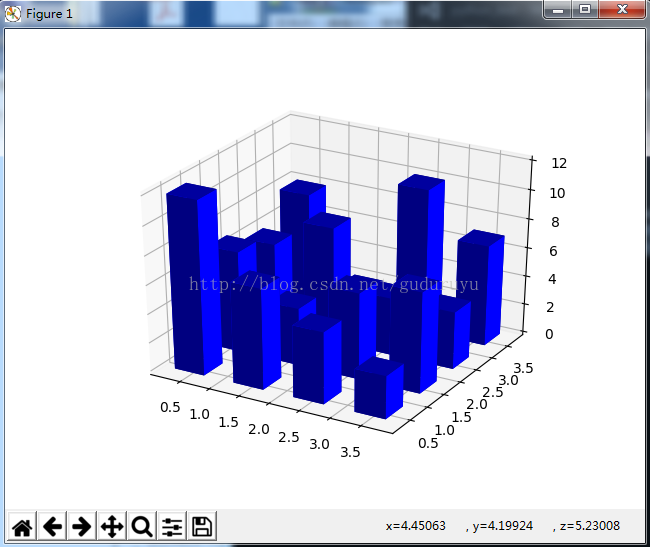
绘制结果如下:
5、绘制3D网状线
|
1
2
3
4
5
6
7
8
9
10
11
12
13
14
|
from mpl_toolkits.mplot3d import axes3d import matplotlib.pyplot as plt fig = plt.figure() ax = fig.add_subplot(111, projection='3d') # Grab some test data. X, Y, Z = axes3d.get_test_data(0.05) # Plot a basic wireframe. ax.plot_wireframe(X, Y, Z, rstride=10, cstride=10) plt.show() |
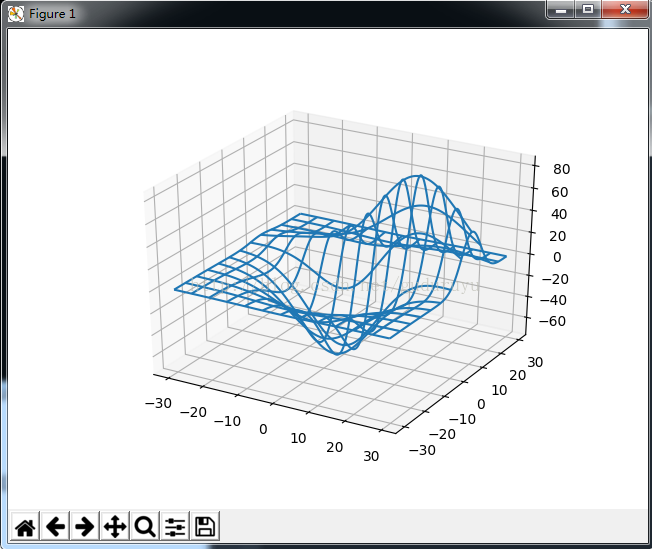
绘制结果如下:
6、绘制3D三角面片图
|
1
2
3
4
5
6
7
8
9
10
11
12
13
14
15
16
17
18
19
20
21
22
23
24
25
26
27
28
29
30
|
from mpl_toolkits.mplot3d import Axes3D import matplotlib.pyplot as plt import numpy as np n_radii = 8n_angles = 36 # Make radii and angles spaces (radius r=0 omitted to eliminate duplication). radii = np.linspace(0.125, 1.0, n_radii) angles = np.linspace(0, 2*np.pi, n_angles, endpoint=False) # Repeat all angles for each radius. angles = np.repeat(angles[..., np.newaxis], n_radii, axis=1) # Convert polar (radii, angles) coords to cartesian (x, y) coords. # (0, 0) is manually added at this stage, so there will be no duplicate # points in the (x, y) plane. x = np.append(0, (radii*np.cos(angles)).flatten()) y = np.append(0, (radii*np.sin(angles)).flatten()) # Compute z to make the pringle surface. z = np.sin(-x*y) fig = plt.figure() ax = fig.gca(projection='3d') ax.plot_trisurf(x, y, z, linewidth=0.2, antialiased=True) plt.show( |
绘制结果如下:

7、绘制3D散点图
|
1
2
3
4
5
6
7
8
9
10
11
12
13
14
15
16
17
18
19
20
21
22
23
24
25
26
27
28
29
30
|
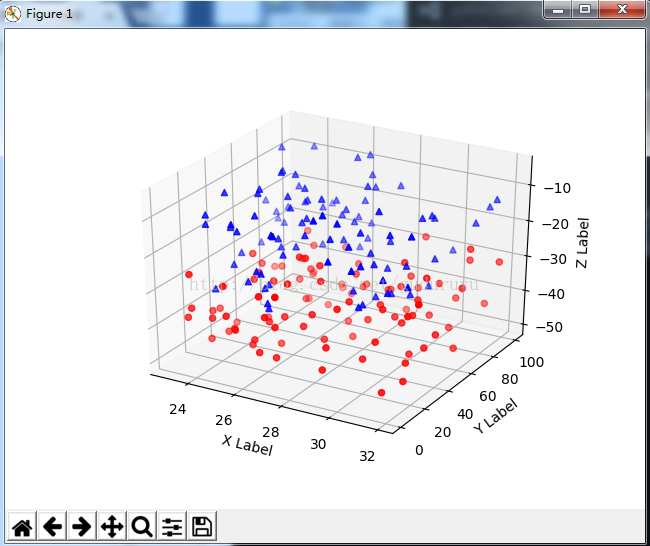
from mpl_toolkits.mplot3d import Axes3D import matplotlib.pyplot as plt import numpy as np def randrange(n, vmin, vmax): ''''' Helper function to make an array of random numbers having shape (n, ) with each number distributed Uniform(vmin, vmax). ''' return (vmax - vmin)*np.random.rand(n) + vmin fig = plt.figure() ax = fig.add_subplot(111, projection='3d') n = 100 # For each set of style and range settings, plot n random points in the box # defined by x in [23, 32], y in [0, 100], z in [zlow, zhigh]. for c, m, zlow, zhigh in [('r', 'o', -50, -25), ('b', '^', -30, -5)]: xs = randrange(n, 23, 32) ys = randrange(n, 0, 100) zs = randrange(n, zlow, zhigh) ax.scatter(xs, ys, zs, c=c, marker=m) ax.set_xlabel('X Label') ax.set_ylabel('Y Label') ax.set_zlabel('Z Label') plt.show() |
绘制结果如下:
8、绘制3D文字
|
1
2
3
4
5
6
7
8
9
10
11
12
13
14
15
16
17
18
19
20
21
22
23
24
25
26
27
28
29
30
31
32
33
|
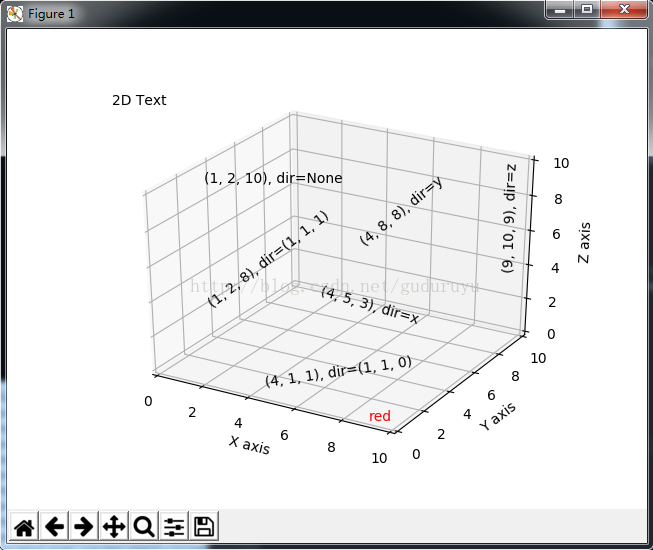
from mpl_toolkits.mplot3d import Axes3D import matplotlib.pyplot as plt fig = plt.figure() ax = fig.gca(projection='3d') # Demo 1: zdir zdirs = (None, 'x', 'y', 'z', (1, 1, 0), (1, 1, 1)) xs = (1, 4, 4, 9, 4, 1) ys = (2, 5, 8, 10, 1, 2) zs = (10, 3, 8, 9, 1, 8) for zdir, x, y, z in zip(zdirs, xs, ys, zs): label = '(%d, %d, %d), dir=%s' % (x, y, z, zdir) ax.text(x, y, z, label, zdir) # Demo 2: color ax.text(9, 0, 0, "red", color='red') # Demo 3: text2D # Placement 0, 0 would be the bottom left, 1, 1 would be the top right. ax.text2D(0.05, 0.95, "2D Text", transform=ax.transAxes) # Tweaking display region and labels ax.set_xlim(0, 10) ax.set_ylim(0, 10) ax.set_zlim(0, 10) ax.set_xlabel('X axis') ax.set_ylabel('Y axis') ax.set_zlabel('Z axis') plt.show( |
绘制结果如下:
9、3D条状图
|
1
2
3
4
5
6
7
8
9
10
11
12
13
14
15
16
17
18
19
20
21
|
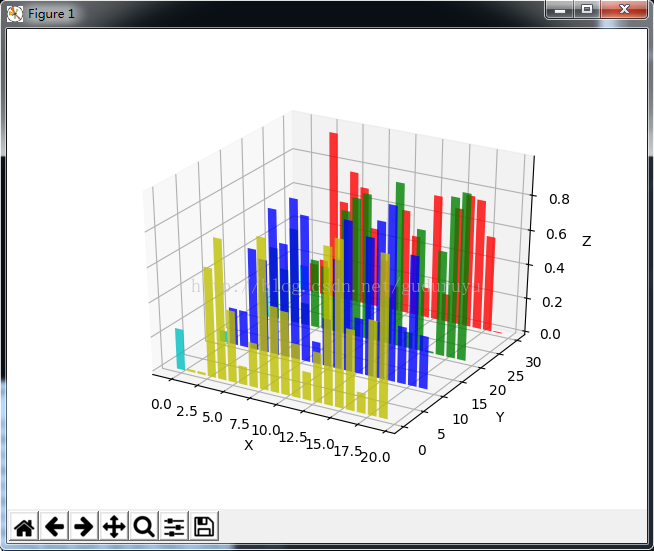
from mpl_toolkits.mplot3d import Axes3D import matplotlib.pyplot as plt import numpy as np fig = plt.figure() ax = fig.add_subplot(111, projection='3d') for c, z in zip(['r', 'g', 'b', 'y'], [30, 20, 10, 0]): xs = np.arange(20) ys = np.random.rand(20) # You can provide either a single color or an array. To demonstrate this, # the first bar of each set will be colored cyan. cs = [c] * len(xs) cs[0] = 'c' ax.bar(xs, ys, zs=z, zdir='y', color=cs, alpha=0.8) ax.set_xlabel('X') ax.set_ylabel('Y') ax.set_zlabel('Z') plt.show() |
绘制结果如下:
以上所述是小编给大家介绍的python绘制3D图形,希望对大家有所帮助,如果大家有任何疑问请给我留言,小编会及时回复大家的。在此也非常感谢大家对脚本之家网站的支持
Python绘制3D图形的更多相关文章
- Python 使用 matplotlib绘制3D图形
3D图形在数据分析.数据建模.图形和图像处理等领域中都有着广泛的应用,下面将给大家介绍一下如何在Python中使用 matplotlib进行3D图形的绘制,包括3D散点.3D表面.3D轮廓.3D直线( ...
- Python plot_surface(Axes3D)方法:绘制3D图形
3D 图形需要的数据与等高线图基本相同:X.Y 数据决定坐标点,Z 轴数据决定 X.Y 坐标点对应的高度.与等高线图使用等高线来代表高度不同,3D 图形将会以更直观的形式来表示高度. 为了绘制 3D ...
- 使用OpenGL ES绘制3D图形
如果应用定义的顶点不在同一个平面上,并且使用三角形把合适的顶点连接起来,就可以绘制出3D图形了. 使用OpenGL ES绘制3D图形的方法与绘制2D图形的步骤大致相同,只是绘制3D图形需要定义更多的 ...
- Python绘制3d螺旋曲线图实例代码
Axes3D.plot(xs, ys, *args, **kwargs) 绘制2D或3D数据 参数 描述 xs, ys X轴,Y轴坐标定点 zs Z值,每一个点的值都是1 zdir 绘制2D集合时使用 ...
- cocos2d-x中绘制3D图形--3D ToolKit for cocos2dx实现原理
首先:了解具体情况请看这里:https://github.com/wantnon2/3DToolKit-for-cocos2dx 在看代码之前,最好还是先把项目git下来执行一下demoproject ...
- Mathematica——绘制3D图形
Plot3D Plot3D[ + y, {x, -, }, {y, -, }] ListPointPlot3D 绘制点集 ListPointPlot3D[{{, , }, {, , }}, Color ...
- 如何用python绘制各种图形
1.环境 系统:windows10 python版本:python3.6.1 使用的库:matplotlib,numpy 2.numpy库产生随机数几种方法 import numpy as np nu ...
- python 绘制3D散点图
import scipy.io as sio from mpl_toolkits.mplot3d import Axes3D import matplotlib.pyplot as plt a = [ ...
- Python画各种 3D 图形Matplotlib库
回顾 2D 作图 用赛贝尔曲线作 2d 图.此图是用基于 Matplotlib 的 Path 通过赛贝尔曲线实现的,有对赛贝尔曲线感兴趣的朋友们可以去学习学习,在 matplotlib 中,figur ...
随机推荐
- Celery:routing
参考:http://docs.celeryproject.org/en/latest/userguide/routing.html#guide-routing
- day 04 预科
目录 变量 什么是变量 变量的组成 变量名的命名规范 注释 单行注释 多行注释 turtle库的使用 今日内容 数据类型基础 变量 具体的值 存不是目的,取才是目的 为了描述世界万物的状态,因此有了数 ...
- MySQL 5.7开始支持JSON,那还有必要使用MongoDB存JSON吗?请列出你的观点/理由。
一.观点A:支持MySQL存储JSON MongoDB不支持事务,而MySQL支持事务 MySQL相对MongoDB而言,MySQL的稳定性要优于MongoDB MySQL支持多种存储引擎 二.观点B ...
- 【CMDB】API传输验证
客户端向服务器发送请求时,在请求头添加自定义的字符串 客户端的加密方式 1.对key+time进行md5加密 2.发送的时候的格式为md5_key|time,将时间也发送过去 服务器端验证 1.获取加 ...
- tomcat redis session共享
编译redis所需要的序列化包 安装 gradle Linux & MacOS users Configure your PATH environment variable to includ ...
- Spring Cloud 微服务:Eureka+Zuul+Ribbon+Hystrix+SpringConfig实现流程图
相信现在已经有很多小伙伴已经或者准备使用springcloud微服务了,接下来为大家搭建一个微服务框架,后期可以自己进行扩展.会提供一个小案例: 服务提供者和服务消费者 ,消费者会调用提供者的服务,新 ...
- python——使用xlwing库进行Excel操作
Excel是现在比不可少的数据处理软件,python有很多支持Excel操作的库,xlwing就是其中之一. xlwings的安装 xlwings库使用pip安装: 在控制台输入 pip instal ...
- IntelliJ IDEA自身以及maven项目打包方式
1. Idea自身打包方式 1.1 创建Artifacts 快捷键(Ctrl+Alt+Shift+S)打开项目的Project Structure.在Artifacts创建 接着,指定main cla ...
- Random Walk——高斯消元法
题目 有一个 $N \times M$ 大小的格子,从(0, 0)出发,每一步朝着上下左右4个格子中可以移动的格子等概率移动.另外有些格子有石头,因此无法移至这些格子.求第一次到达 $(N-1, M- ...
- SUID提权
查看tmp目录权限 ll -d /tmp 切换到tmp目录 cd /tmp 创建一个exploit目录 mkdir exploit 查看ping命令带suid权限 ll /bin/ping 创建tar ...