python使用matplotlib绘制折线图教程
Matplotlib是一个Python工具箱,用于科学计算的数据可视化。借助它,Python可以绘制如Matlab和Octave多种多样的数据图形。下面这篇文章主要介绍了python使用matplotlib如何绘制折线图的方法教程,需要的朋友可以参考借鉴。
matplotlib简介
matplotlib 是python最著名的绘图库,它提供了一整套和matlab相似的命令API,十分适合交互式地行制图。而且也可以方便地将它作为绘图控件,嵌入GUI应用程序中。
它的文档相当完备,并且Gallery页面中有上百幅缩略图,打开之后都有源程序。因此如果你需要绘制某种类型的图,只需要在这个页面中浏览/复制/粘贴一下,基本上都能搞定。
在Linux下比较著名的数据图工具还有gnuplot,这个是免费的,Python有一个包可以调用gnuplot,但是语法比较不习惯,而且画图质量不高。
而 Matplotlib则比较强:Matlab的语法、python语言、latex的画图质量(还可以使用内嵌的latex引擎绘制的数学公式)。
绘图库Matplotlib的安装方法:点击这里
matplotlib绘制折线图
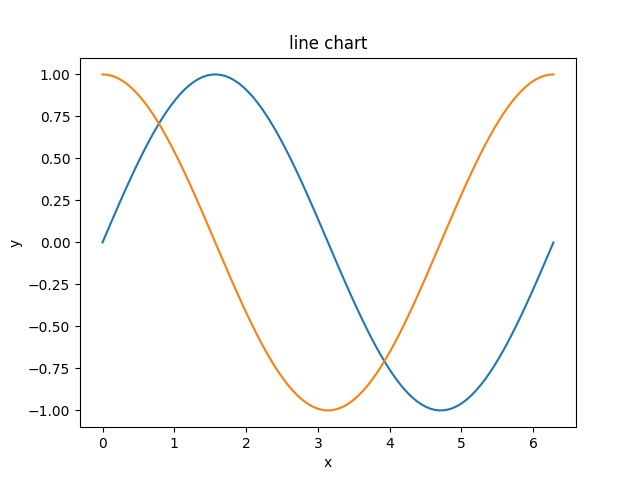
1. line chart
import numpy as np

import matplotlib.pyplot as plt

x = np.linspace(0, 2 * np.pi, 100)

y1, y2 = np.sin(x), np.cos(x)

plt.plot(x, y1)

plt.plot(x, y2)

plt.title('line chart')

plt.xlabel('x')

plt.ylabel('y')

plt.show()
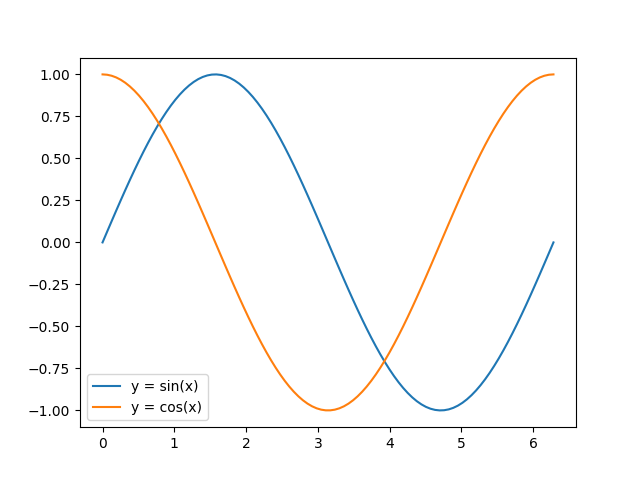
2. 图例
在plot的时候指定label,然后调用legend方法可以绘制图例。例如:
import numpy as np

import matplotlib.pyplot as plt

x = np.linspace(0, 2 * np.pi, 100)

y1, y2 = np.sin(x), np.cos(x)

plt.plot(x, y1, label='y = sin(x)')

plt.plot(x, y2, label='y = cos(x)')

plt.legend()

plt.show()
legend方法可接受一个loc关键字参数来设定图例的位置,可取值为数字或字符串:
0: ‘best'
1: ‘upper right'
2: ‘upper left'
3: ‘lower left'
4: ‘lower right'
5: ‘right'
6: ‘center left'
7: ‘center right'
8: ‘lower center'
9: ‘upper center'
10: ‘center'
3. 线的样式
(1)颜色
plot方法的关键字参数color(或c)用来设置线的颜色。可取值为:
1、颜色名称或简写
b: blue
g: green
r: red
c: cyan
m: magenta
y: yellow
k: black
w: white
2、#rrggbb
3、(r, g, b) 或 (r, g, b, a),其中 r g b a 取均为[0, 1]之间
4、[0, 1]之间的浮点数的字符串形式,表示灰度值。0表示黑色,1表示白色
(2)样式
plot方法的关键字参数linestyle(或ls)用来设置线的样式。可取值为:
- -, solid
- --, dashed
- -., dashdot
- :, dotted
- '', ' ', None
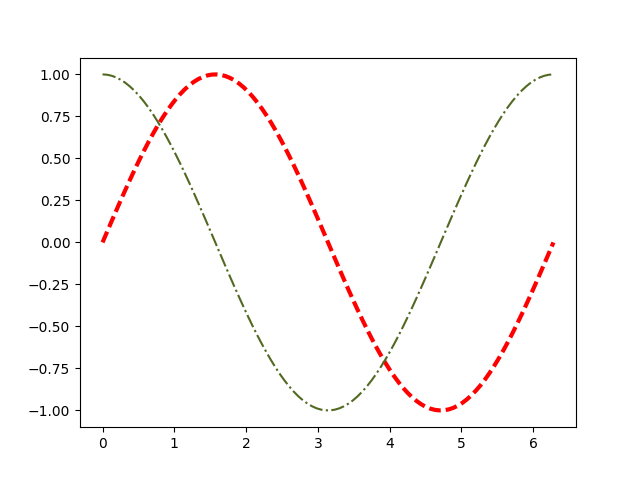
(3)粗细
设置plot方法的关键字参数linewidth(或lw)可以改变线的粗细,其值为浮点数。
import numpy as np

import matplotlib.pyplot as plt

x = np.linspace(0, 2 * np.pi, 100)

y1, y2 = np.sin(x), np.cos(x)

plt.plot(x, y1, c='r', ls='--', lw=3)

plt.plot(x, y2, c='#526922', ls='-.')

plt.show()
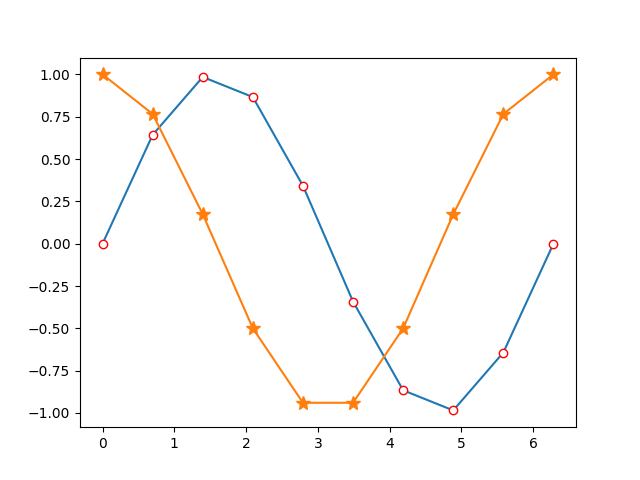
4. marker
以下关键字参数可以用来设置marker的样式:
- marker
- markeredgecolor 或 mec
- markeredgewidth 或 mew
- markerfacecolor 或 mfc
- markerfacecoloralt 或 mfcalt
- markersize 或 ms
其中marker可取值为:
- '.': point marker
- ',': pixel marker
- 'o': circle marker
- 'v': triangle_down marker
- '^': triangle_up marker
- '<': triangle_left marker
- '>': triangle_right marker
- '1': tri_down marker
- '2': tri_up marker
- '3': tri_left marker
- '4': tri_right marker
- 's': square marker
- 'p': pentagon marker
- '*': star marker
- 'h': hexagon1 marker
- 'H': hexagon2 marker
- '+': plus marker
- 'x': x marker
- 'D': diamond marker
- 'd': thin_diamond marker
- '|': vline marker
- '_': hline marker
例如:
import numpy as np

import matplotlib.pyplot as plt

x = np.linspace(0, 2 * np.pi, 10)

y1, y2 = np.sin(x), np.cos(x)

plt.plot(x, y1, marker='o', mec='r', mfc='w')

plt.plot(x, y2, marker='*', ms=10)

plt.show()
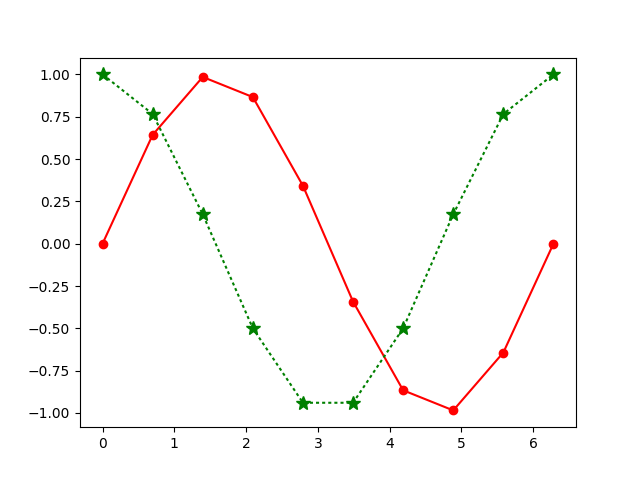
另外,marker关键字参数可以和color以及linestyle这两个关键字参数合并为一个字符串。例如:
import numpy as np

import matplotlib.pyplot as plt

x = np.linspace(0, 2 * np.pi, 10)

y1, y2 = np.sin(x), np.cos(x)

plt.plot(x, y1, 'ro-')

plt.plot(x, y2, 'g*:', ms=10)

plt.show()
The kwargs are Line2D properties:
| Property | Description |
|---|---|
| agg_filter | unknown |
| alpha | float (0.0 transparent through 1.0 opaque) |
| animated | [True | False] |
| antialiased or aa | [True | False] |
| axes | an Axes instance |
| clip_box | a matplotlib.transforms.Bbox instance |
| clip_on | [True | False] |
| clip_path | [ (Path, Transform) | Patch | None ] |
| color or c | any matplotlib color |
| contains | a callable function |
| dash_capstyle | [‘butt’ | ‘round’ | ‘projecting’] |
| dash_joinstyle | [‘miter’ | ‘round’ | ‘bevel’] |
| dashes | sequence of on/off ink in points |
| drawstyle | [‘default’ | ‘steps’ | ‘steps-pre’ | ‘steps-mid’ | ‘steps-post’] |
| figure | a matplotlib.figure.Figure instance |
| fillstyle | [‘full’ | ‘left’ | ‘right’ | ‘bottom’ | ‘top’ | ‘none’] |
| gid | an id string |
| label | string or anything printable with ‘%s’ conversion. |
| linestyle or ls | ['-' | '--' | '-.' | ':' | 'None' | ' ' | ''] |
| linewidth or lw | float value in points |
| lod | [True | False] |
| marker | A valid marker style |
| markeredgecolor or mec | any matplotlib color |
| markeredgewidth or mew | float value in points |
| markerfacecolor or mfc | any matplotlib color |
| markerfacecoloralt or mfcalt | any matplotlib color |
| markersize or ms | float |
| markevery | [None | int | length-2 tuple of int | slice | list/array of int | float | length-2 tuple of float] |
| path_effects | unknown |
| picker | float distance in points or callable pick function fn(artist, event) |
| pickradius | float distance in points |
| rasterized | [True | False | None] |
| sketch_params | unknown |
| snap | unknown |
| solid_capstyle | [‘butt’ | ‘round’ | ‘projecting’] |
| solid_joinstyle | [‘miter’ | ‘round’ | ‘bevel’] |
| transform | a matplotlib.transforms.Transform instance |
| url | a url string |
| visible | [True | False] |
| xdata | 1D array |
| ydata | 1D array |
| zorder | any number |
总结
以上就是这篇文章的全部内容了,希望本文的内容对大家的学习或者工作能带来一定的帮助,如果有疑问大家可以留言交流,谢谢大家对我的支持。
python使用matplotlib绘制折线图教程的更多相关文章
- 【Python】matplotlib绘制折线图
一.绘制简单的折线图 import matplotlib.pyplot as plt squares=[1,4,9,16,25] plt.plot(squares) plt.show() 我们首先导入 ...
- python中matplotlib画折线图实例(坐标轴数字、字符串混搭及标题中文显示)
最近在用python中的matplotlib画折线图,遇到了坐标轴 "数字+刻度" 混合显示.标题中文显示.批量处理等诸多问题.通过学习解决了,来记录下.如有错误或不足之处,望请指 ...
- Python开发【模块】:matplotlib 绘制折线图
matplotlib 1.安装matplotlib ① linux系统安装 # 安装matplotlib模块 $ sudo apt-get install python3-matplotlib # 如 ...
- python用matplotlib画折线图
折线图: import matplotlib.pyplot as plt y1=[10,13,5,40,30,60,70,12,55,25] x1=range(0,10) x2=range(0,10) ...
- Python:matplotlib绘制线条图
线型图是学习matplotlib绘图的最基础案例.我们来看看具体过程: 下面我们将两条曲线绘制到一个图形里: 可以看到这种方式下,两个线条共用一个坐标轴,并且自动区分颜色. plot方法的核心是 ...
- 1 matplotlib绘制折线图
from matplotlib import pyplot as plt #设置图形大小 plt.figure(figsize=(20,8),dpi=80) plt.plot(x,y,color=&q ...
- Python绘制折线图
一.Python绘制折线图 1.1.Python绘制折线图对应代码如下图所示 import matplotlib.pyplot as pltimport numpy as np from pylab ...
- Python pyecharts绘制折线图
一.pyecharts绘制折线图line.add()方法简介 line.add()方法简介 add(name,x_axis,y_axis,is_symbol_show=True, is_smooth= ...
- 用PNChart绘制折线图
写在前面 上一篇文章已经介绍过用PNChart绘制饼状图了,绘制折线图的步骤和饼状图的步骤是相似的,按照中的准备做好准备工作后就可以绘制折线图了. 开始使用 1.在view中声明一个PNLineCha ...
随机推荐
- Spark(四十五):Schema Registry
很多时候在流数据处理时,我们会将avro格式的数据写入到kafka的topic,但是avro写入到kafka的时候,数据有可能会与版本升级,也就是schema发生变化,此时如果消费端,不知道哪些数据的 ...
- 前端 使用 crypto-js 对数据进行对称加密
From: https://www.cnblogs.com/CyLee/p/7216988.html 传送门: # crypto-js github https://github.com/brix/ ...
- 【ASP.NET 问题】ASP.NET 网站404页面返回200,或者302的解决办法
做网站在优化网站时遇到了跳转404页面却返回 200.302状态的问题,这样的话搜索引擎会认为这个页面是一个正常的页面,但是这个页面实际是个错误页面,虽然对访问的用户而言,HTTP状态码是“404”还 ...
- git强制提交本地分支覆盖远程分支
git push origin 分支名 --force eg: cd 代码目录 git push origin master --force 运行结果: Total 0 (delta 0), reus ...
- Netty实战 - 1. 基本概念
1. Netty简介 Netty是由JBOSS提供的一个java开源框架.它提供异步的.事件驱动的网络应用程序框架和工具,用以快速开发高性能.高可靠性的网络服务器和客户端程序.Netty是一个基于NI ...
- from __future__ import print_function的作用
阅读代码的时候会看到下面语句: from __future__ import print_function 该语句是python2的概念,那么python3对于python2就是future了,也就是 ...
- $gopath not set的解决办法
执行安装 sudo go get github.com/nsf/gocode 提示: cannot download, $GOPATH not set. For more details see: g ...
- Python 3安装MySQLdb
Python 2安装的是mysql-python,Python 3安装mysql-python以后,仍然不能import MySQLdb,原来Python 3应该安装mysqlclient,就可以im ...
- 每天一个linux命令:top
1.命令简介 top (top) 令经常用来实时监控linux的系统状况,比如cpu.内存的使用,类似于Windows的任务管理器. 2.用法 top -hv | -abcHimMsS -d dela ...
- idea 自动导入