如何快速实现Prometheus监控Kubernetes集群
Prometheus
K8S集群中常见的监控工具有哪些:
- Kubernetes Dashboard
- Kube-monkey
- K8s-testsuite
- Kubespray
- Minikube
- Prometheus
K8S集群监控-外部
| apiserver 访问 |
| -------------- |
集群外部访问:
- 通过public IPs访问service
- 通过proxy 访问node、pod、service
- 通过集群内的node或pod间接访问
查看 kube-system 命名空间的 proxy url:
$ kubectl cluster-info

Kubernetes control plane is running at https://192.168.50.160:6443

CoreDNS is running at https://192.168.50.160:6443/api/v1/namespaces/kube-system/services/kube-dns:dns/proxy

To further debug and diagnose cluster problems, use 'kubectl cluster-info dump'.
其默认的构造规则为:
# 访问node

https://${other_apiserver_address}/api/v1/nodes/node_name:[port_name]/proxy/metrics

# 访问service

https://${other_apiserver_address}/api/v1/namespaces/service_namespace/services/http:service_name[:port_name]/proxy/metrics

# 访问pod

https://${other_apiserver_address}/api/v1/namespaces/pod_namespace/pods/http:pod_name[:port_name]/proxy/metrics
apiserver授权
集群外访问需要使用token+客户端cert进行认证方案,需要先进行RBAC授权。
创建 prometheus 用户,并绑定cluster-admin角色:
# 创建命名空间

$ kubectl create ns devops

# 创建serviceaccounts

$ kubectl create sa  prometheus -n devops

# 整个集群范围,将名为 cluster-admin 的 ClusterRole 与 devops:prometheus sa绑定,devops:prometheus 具有 cluster-admin 定义的权限

$ kubectl create clusterrolebinding prometheus --clusterrole cluster-admin --serviceaccount=devops:prometheus
构造token:
访问 apiserver 不是直接使用 serviceaccount,而是通过 token。
我们需要获取 serviceaccount:prometheus 对应的 token.
$ kubectl create token prometheus -n devops

eyJhbGciOiJSUzI1NiIsImtpZCI6IkJvUWREbFI1Y2FZcV9JWXBoV3BCTUVyRHE5ZUtVenFXekRzb0ttNllPVFEifQ.eyJhdWQiOlsiaHR0cHM6Ly9rdWJlcm5ldGVzLmRlZmF1bHQuc3ZjLmNsdXN0ZXIubG9jYWwiXSwiZXhwIjoxNjkzMjk0NzMxLCJpYXQiOjE2OTMyOTExMzEsImlzcyI6Imh0dHBzOi8va3ViZXJuZXRlcy5kZWZhdWx0LnN2Yy5jbHVzdGVyLmxvY2FsIiwia3ViZXJuZXRlcy5pbyI6eyJuYW1lc3BhY2UiOiJkZXZvcHMiLCJzZXJ2aWNlYWNjb3VudCI6eyJuYW1lIjoicHJvbWV0aGV1cyIsInVpZCI6ImZjMzU4NGUxLWQ5NDItNGY0My1hN2Q2LTYxMWMyY2M4NWI0NCJ9fSwibmJmIjoxNjkzMjkxMTMxLCJzdWIiOiJzeXN0ZW06c2VydmljZWFjY291bnQ6ZGV2b3BzOnByb21ldGhldXMifQ.FhUo4dcHAYCoKUF-GlN1PvCT40BKJ-DfPy_Bxju8H5GyzD_A7fQyjputEl4VG33ckcYYdRI4uNzvrTU2k4HGojzZASCwqVSHmoH4wvdPsKIVq521G-cq0wfP6mPDnzYx4p2UlqLxpg7-6IBbjFhzKrPRLDEuBmHRnQn77etcv9RXVa2mqoalxrt5VLE7f-8aLIPCBSpzoayRppQDQvpJxZ45Bz5lfId5zY_3topSAwo-by6X-BBNVBQLy2evjKc80M_ne8VWi9GygKtuRVpzNMxq3t8DQOE0VCaPWLB90CcZD_Y2pi63uzwS0N-ikmKB1Rps3xCmO4kKFUm3h6crvg
访问测试:
$ curl -k -H 'Authorization: Bearer TOKEN' https://192.168.50.160:6443/api

{

	"kind": "APIVersions",

	"versions": [

		"v1"

	],

	"serverAddressByClientCIDRs": [

		{

			"clientCIDR": "0.0.0.0/0",

			"serverAddress": "192.168.50.160:6443"

		}

	]

}
检测目标
- kubelet 监控
- 资源
Kubelet监控
kubelet会输出一些监控指标数据,通过:
地址可以访问到。
cAdvisor 是一个开源的分析容器资源使用率和性能特性的代理工具,集成到 Kubelet中,当Kubelet启动时会同时启动cAdvisor,且一个cAdvisor只监控一个Node节点的信息。cAdvisor 自动查找所有在其所在节点上的容器,自动采集 CPU、内存、文件系统和网络使用的统计信息。cAdvisor 通过它所在节点机的 Root 容器,采集并分析该节点机的全面使用情况。通过:
https://NodeIP:10250/metrics/cadvisor
可以访问到。
K8S资源对象
kube-state-metrics 是一个服务,它监听 Kubernetes APIServer 并生成关联对象的metrics,包括:Node、Service、Pod、Endpoints、Ingress。
# 下载部署文件

wget https://raw.githubusercontent.com/kubernetes/kube-state-metrics/main/examples/standard/service-account.yaml

wget https://raw.githubusercontent.com/kubernetes/kube-state-metrics/main/examples/standard/cluster-role.yaml

wget https://raw.githubusercontent.com/kubernetes/kube-state-metrics/main/examples/standard/cluster-role-binding.yaml

wget https://raw.githubusercontent.com/kubernetes/kube-state-metrics/main/examples/standard/deployment.yaml

wget https://raw.githubusercontent.com/kubernetes/kube-state-metrics/main/examples/standard/service.yaml

# 部署

kubectl apply -f service-account.yaml

kubectl apply -f cluster-role.yaml

kubectl apply -f cluster-role-binding.yaml

kubectl apply -f deployment.yaml

kubectl apply -f service.yaml

# 结果:

$ kubectl get pods -n kube-system | grep kube-state-metrics

kube-state-metrics-59b487664-trpjx     1/1     Running   0             19h

$ kubectl get services -n kube-system | grep kube-state-metrics

kube-state-metrics   ClusterIP   None         <none>        8080/TCP,8081/TCP        19h
Node指标:
部署 node_exporter 实现,可以单独部署在node服务器上,但推荐使用 DaemonSet 形式部署在K8S集群中,可以配合Prometheus的动态服务发现使用:
# node-exporter.yaml

kind: DaemonSet

apiVersion: apps/v1

metadata:

  name: node-exporter

  namespace: monitor

  annotations:

    prometheus.io/scrape: 'true'

spec:

  selector:

    matchLabels:

      app: node-exporter

  template:

    metadata:

      labels:

        app: node-exporter

      name: node-exporter

    spec:

      containers:

      - image: quay.io/prometheus/node-exporter:latest

        name: node-exporter

        ports:

        - containerPort: 9100

          hostPort: 9100

          name: node-exporter

      hostNetwork: true

      hostPID: true

      tolerations:

      - key: "node-role.kubernetes.io/master"

        operator: "Exists"

        effect: "NoSchedule"

kind: Service

apiVersion: v1

metadata:

  annotations:

    prometheus.io/scrape: 'true'

  labels:

    app: node-exporter

  name: node-exporter

spec:

  type: ClusterIP

  clusterIP: None

  ports:

  - name: node-exporter

    port: 9100

    protocol: TCP

  selector:

    app: node-exporter
部署:
$ kubectl create namespace monitor

$ kubectl apply -f node-exporter.yaml
Prometheus服务发现
Kubelet监控服务发现
增加两个job:
# prometheus.yaml
- job_name: "kube-node-kubelet"
scheme: https
tls_config:
insecure_skip_verify: true
bearer_token_file: /prometheus/k8s_token #使用 token 值,以文件形式存储
kubernetes_sd_configs: # k8s 服务发现配置
# 使用endpoint级别自动发现
- role: node
api_server: "https://192.168.50.160:6443"
tls_config:
insecure_skip_verify: true
bearer_token_file: /prometheus/k8s_token
relabel_configs:
# 将标签(.*)作为新标签名,原有值不变
- action: labelmap
regex: __meta_kubernetes_node_label_(.*)
# 修改NodeIP:10250为APIServerIP:6443
- action: replace
regex: (.*)
source_labels: [ __address__ ]
target_label: __address__
replacement: 192.168.50.160:6443
# 实际访问指标接口 https://NodeIP:10250/metrics 这个接口只能APISERVER访问,故此重新标记标签使用APISERVER代理访问
- action: replace
source_labels: [ __meta_kubernetes_node_name ]
target_label: __metrics_path__
regex: (.*)
replacement: /api/v1/nodes/${1}/proxy/metrics
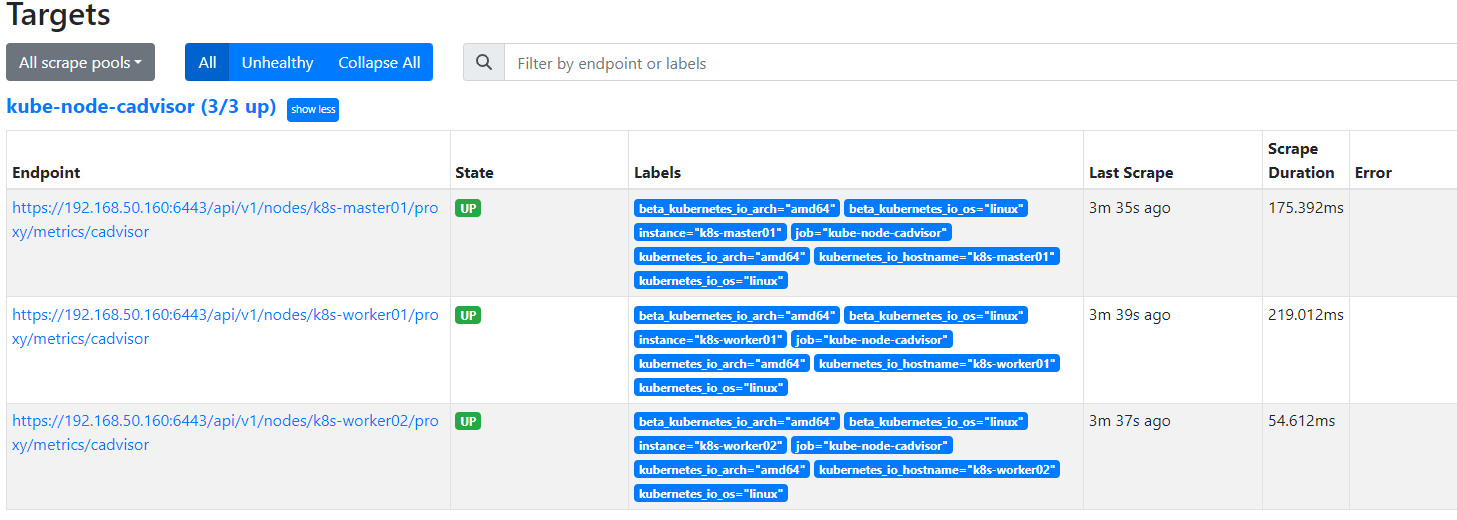
- job_name: "kube-node-cadvisor"
scheme: https
tls_config:
insecure_skip_verify: true
#使用apiserver授权部分解密的token值,以文件形式存储
bearer_token_file: /prometheus/k8s_token
# k8s自动发现具体配置
kubernetes_sd_configs:
# 使用endpoint级别自动发现
- role: node
api_server: "https://192.168.50.160:6443"
tls_config:
insecure_skip_verify: true
bearer_token_file: /prometheus/k8s_token
relabel_configs:
# 将标签(.*)作为新标签名,原有值不变
- action: labelmap
regex: __meta_kubernetes_node_label_(.*)
# 修改NodeIP:10250为APIServerIP:6443
- action: replace
regex: (.*)
source_labels: [ __address__ ]
target_label: __address__
replacement: 192.168.50.160:6443
# 实际访问指标接口 https://NodeIP:10250/metrics/cadvisor 这个接口只能APISERVER访问,故此重新标记标签使用APISERVER代理访问
- action: replace
source_labels: [ __meta_kubernetes_node_name ]
target_label: __metrics_path__
regex: (.*)
replacement: /api/v1/nodes/${1}/proxy/metrics/cadvisor
/prometheus/k8s_token 文件配合容器的volume,基于k8s生成后,拷贝到数据卷中。
kubelet relabel_configs:
| label | default | relabel |
|---|---|---|
__scheme__ |
https | https |
__address__ |
master-node-IP:10250 | master-node-IP:6443 |
__metrics_path__ |
/metrics | /api/v1/nodes/node-name/proxy/metrics |
| URL | https://192.168.50.160:10250/metrics | https://192.168.50.160:6443/api/v1/nodes/k8s-worker01/proxy/metrics |
kubelet advisor relabel_configs:
| label | default | relabel |
|---|---|---|
__scheme__ |
https | https |
__address__ |
master-node-IP:10250 | master-node-IP:6443 |
__metrics_path__ |
/metrics/cadvisor | /api/v1/nodes/node-name/proxy/metrics/cadvisor |
| URL | https://192.168.50.160:10250/metrics/cadvisor | https://192.168.50.160:6443/api/v1/nodes/k8s-worker01/proxy/metrics/cadvisor |
K8S资源对象服务发现
增加一个job
# prometheus.yaml
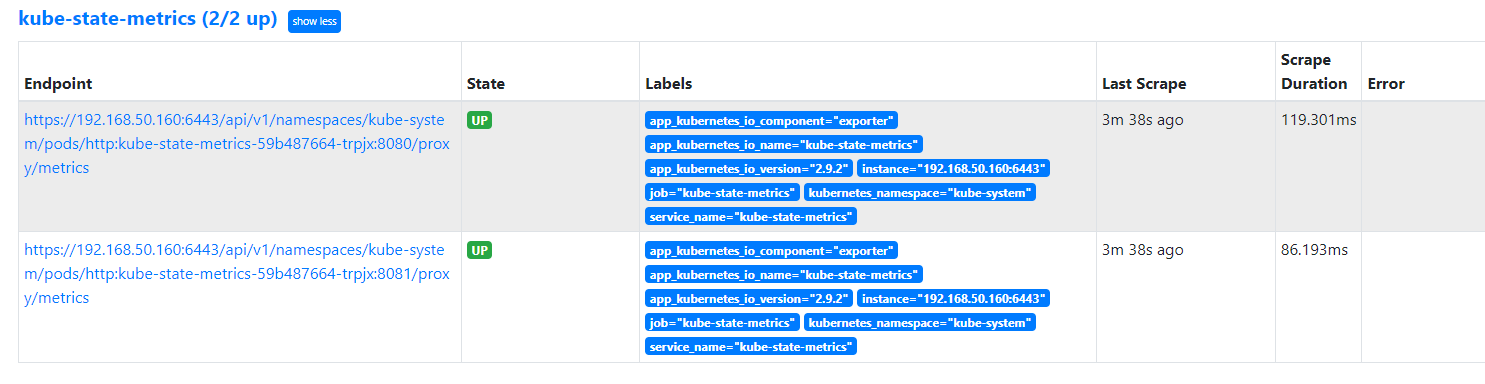
- job_name: "kube-state-metrics"
scheme: https
tls_config:
insecure_skip_verify: true
#使用apiserver授权部分解密的token值,以文件形式存储
bearer_token_file: /prometheus/k8s_token
# k8s自动发现具体配置
kubernetes_sd_configs:
- role: endpoints
api_server: "https://192.168.50.160:6443"
tls_config:
insecure_skip_verify: true
bearer_token_file: /prometheus/k8s_token
relabel_configs:
- action: keep
source_labels: [ __meta_kubernetes_service_name ]
regex: '^(kube-state-metrics)$'
# 将标签(.*)作为新标签名,原有值不变
- action: labelmap
regex: __meta_kubernetes_service_label_(.*)
# 修改NodeIP:10250为APIServerIP:6443
- action: replace
regex: (.*)
source_labels: [ __address__ ]
target_label: __address__
replacement: 192.168.50.160:6443
# 实际访问指标接口
- action: replace
source_labels: [ __meta_kubernetes_namespace, __meta_kubernetes_pod_name, __meta_kubernetes_pod_container_port_number ]
target_label: __metrics_path__
regex: ([^;]+);([^;]+);([^;]+)
replacement: /api/v1/namespaces/${1}/pods/http:${2}:${3}/proxy/metrics
kube-state-metrics relabel_configs:
| label | default | relabel |
|---|---|---|
__scheme__ |
https | https |
__address__ |
cluster-internal-IP:8081 | master-node-IP:6443 |
__metrics_path__ |
/metrics | /api/v1/namespaces/kube-system/pods/http:kube-state-metrics-59b487664-trpjx:8081/proxy/metrics |
| URL | https://cluster-internal-IP:8081/metrics | https://192.168.50.160:6443//api/v1/namespaces/kube-system/pods/http:kube-state-metrics-59b487664-trpjx:8081/proxy/metrics |
启动 prometheus
docker-compose 方案:
# docker-composer.yaml

version: '3'

services:

  prometheus:

    image: prom/prometheus

    container_name: prometheus

    restart: always

    ports:

      - "9090:9090"

    volumes:

      - ./etc/prometheus.yml:/etc/prometheus/prometheus.yml

      - ./data:/prometheus

    command:

      - '--config.file=/etc/prometheus/prometheus.yml'

      - '--storage.tsdb.path=/prometheus'

      - '--web.console.libraries=/usr/share/prometheus/console_libraries'

      - '--web.console.templates=/usr/share/prometheus/consoles'

      - '--web.external-url=http://192.168.1.200:9090/'

      - '--web.enable-lifecycle'

      - '--storage.tsdb.retention=15d'
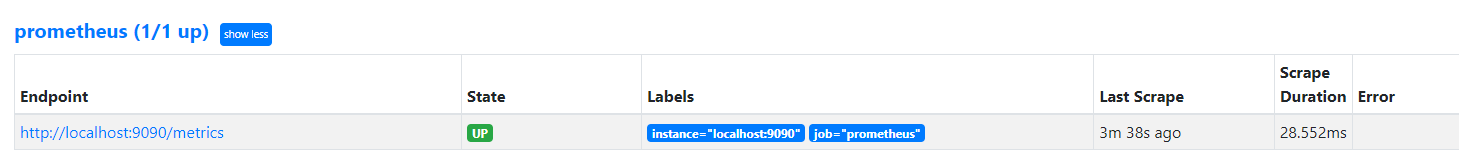
访问 prometheus ui,查看target
http://localhost:9090/targets?search=

Granfana
docker 启动:
docker run --name myGrafana -d -p 3000:3000 grafana/grafana
配置数据源:prometheus
选择DashBoard,示例ID:8588
需要适当编辑具体的panel。

K8S集群监控-内部
如何快速实现Prometheus监控Kubernetes集群的更多相关文章
- Kubernetes集群部署史上最详细(二)Prometheus监控Kubernetes集群
使用Prometheus监控Kubernetes集群 监控方面Grafana采用YUM安装通过服务形式运行,部署在Master上,而Prometheus则通过POD运行,Grafana通过使用Prom ...
- 部署prometheus监控kubernetes集群并存储到ceph
简介 Prometheus 最初是 SoundCloud 构建的开源系统监控和报警工具,是一个独立的开源项目,于2016年加入了 CNCF 基金会,作为继 Kubernetes 之后的第二个托管项目. ...
- 基于prometheus监控k8s集群
本文建立在你已经会安装prometheus服务的基础之上,如果你还不会安装,请参考:prometheus多维度监控容器 如果你还没有安装库k8s集群,情参考: 从零开始搭建基于calico的kuben ...
- Prometheus 监控K8S集群资源监控
Prometheus 监控K8S集群中Pod 目前cAdvisor集成到了kubelet组件内,可以在kubernetes集群中每个启动了kubelet的节点使用cAdvisor提供的metrics接 ...
- 监控Kubernetes集群证书过期时间的三种方案
前言 Kubernetes 中大量用到了证书, 比如 ca证书.以及 kubelet.apiserver.proxy.etcd等组件,还有 kubeconfig 文件. 如果证书过期,轻则无法登录 K ...
- Prometheus 监控 Redis 集群的正确姿势
Prometheus 监控Redis的正确姿势(redis集群) Prometheus 监控 Redis cluster,其实套路都是一样的,使用 exporter. exporter 负责采集指标, ...
- Kubernetes之利用prometheus监控K8S集群
prometheus它是一个主动拉取的数据库,在K8S中应该展示图形的grafana数据实例化要保存下来,使用分布式文件系统加动态PV,但是在本测试环境中使用本地磁盘,安装采集数据的agent使用Da ...
- Rancher2.x 一键式部署 Prometheus + Grafana 监控 Kubernetes 集群
目录 1.Prometheus & Grafana 介绍 2.环境.软件准备 3.Rancher 2.x 应用商店 4.一键式部署 Prometheus 5.验证 Prometheus + G ...
- 监控 Kubernetes 集群应用
Prometheus的数据指标是通过一个公开的 HTTP(S) 数据接口获取到的,我们不需要单独安装监控的 agent,只需要暴露一个 metrics 接口,Prometheus 就会定期去拉取数据: ...
- 快速安装与配置kubernetes集群搭
Kubernetes是什么? 首先,它是一个全新的基于容器技术的分布式架构领先方案.这个方案尽然很新,但它是谷歌十几年以来大规模应用容器技术的经验积累和升华的一个重要成果.确切地说,kubernete ...
随机推荐
- 一些Clion使用记录
一些Clion使用记录 编译链设置 在设置"工具链"中可以按需增加不同的编译链 访问越界溢出debug AddressSanitizer介绍:AddressSanitizer 交的 ...
- centos 添加 公钥,root不用输入密码 ssh-keygen
centos 添加 公钥,root不用输入密码 ssh-keygen -t rsa -C "yourEmail" 一通回车后,生成 C:\Users\Reciter/.ssh/id ...
- 用户不在 sudoers 文件中。此事将被报告
在终端,进入root模式 vim /etc/sudoers 在 sudo (ALL:ALL) ALL下 添加 用户名 (ALL:ALL) ALL
- Base MYSQL Database create stored procedures resolve the Delimiter error
Base MYSQL Database create stored procedures resolve the Delimiter error, It must be created using a ...
- day02-SpringMVC映射请求数据
SpringMVC映射请求数据 1.获取参数值 在开发中,如何获取到 http://xxx/url?参数名1=参数值1&参数名2=参数值2 中的参数? 之前的案例中我们知道:提交的url的参数 ...
- [置顶]
cas单点登录出现的重定向循环问题解决方案
先描述下出现的问题,截图如下: 出现该问题的原因可以通过F12查看Network找到,即http和https两个协议开头的url在不停的跳转,最后就出现了上图所示的重定向循环错误,导致页面崩溃. 解决 ...
- 2、Azure Devops之Azure Boards使用
1.什么是Azure Boards 使用面板.积压工作.冲刺.查询管理项目的用户故事.待办事项.任务.特性和bug. 2.工作项(WorkItem) 工作项管理的可以管理和创建用户故事.特性.任务. ...
- 译:使用 Bun 执行 Shell 脚本
原文地址(Bun Blog): https://bun.sh/blog/the-bun-shell 作者: jarredsumner 发布时间:2024-01-20 前言 JavaScript 是世界 ...
- 什么是3D可视化,为什么要使用3D可视化
虽然许多设计师听说过为什么设计的可视化在他们的审批过程中是有益的,但并不是每个人都知道3D可视化到底是什么. 3D可视化与3D图形.3D渲染.计算机生成图像和其他术语同义使用.3D可视化是指使用计算机 ...
- Python简单程序设计(Average篇)
如题: 解题方式如下: