Python库 - Albumentations 图片数据增强库
Python图像处理库 - Albumentations,可用于深度学习中网络训练时的图片数据增强.
Albumentations 图像数据增强库特点:
- 基于高度优化的 OpenCV 库实现图像快速数据增强.
- 针对不同图像任务,如分割,检测等,超级简单的 API 接口.
- 易于个性化定制.
- 易于添加到其它框架,比如 PyTorch.
1. Albumentations 的 pip 安装
sudo pip install albumentations # 或 sudo pip install -U git+https://github.com/albu/albumentations
2. 不同图片数据增强库对比
对 ImageNet validation set 中的前 2000 张图片进行处理,采用 Intel Core i7-7800X CPU.
不同数据增强库的处理速度对比(以秒为单位,时间越少越好).
3. 使用示例
https://github.com/albu/albumentations/blob/master/notebooks/example.ipynb
import numpy as np

import cv2

from matplotlib import pyplot as plt

from  albumentations  import (

    HorizontalFlip, IAAPerspective, ShiftScaleRotate, CLAHE, RandomRotate90,

    Transpose, ShiftScaleRotate, Blur, OpticalDistortion, GridDistortion, HueSaturationValue,

    IAAAdditiveGaussianNoise, GaussNoise, MotionBlur, MedianBlur, IAAPiecewiseAffine,

    IAASharpen, IAAEmboss, RandomContrast, RandomBrightness, Flip, OneOf, Compose

) # 图像变换函数

image = cv2.imread('test.jpg', 1) # BGR

image = cv2.cvtColor(image, cv2.COLOR_BGR2RGB)

aug = HorizontalFlip(p=1)

img_HorizontalFlip = aug(image=image)['image']

aug = IAAPerspective(scale=0.2, p=1)

img_IAAPerspective = aug(image=image)['image']

aug = ShiftScaleRotate(p=1)

img_ShiftScaleRotate = aug(image=image)['image']

def  augment_flips_color(p=.5):

    return Compose([

        CLAHE(),

        RandomRotate90(),

        Transpose(),

        ShiftScaleRotate(shift_limit=0.0625, scale_limit=0.50, rotate_limit=45, p=.75),

        Blur(blur_limit=3),

        OpticalDistortion(),

        GridDistortion(),

        HueSaturationValue()

    ], p=p)

aug = augment_flips_color(p=1)

img_augment_flips_color = aug(image=image)['image']

def strong_aug(p=.5):

    return Compose([

        RandomRotate90(),

        Flip(),

        Transpose(),

        OneOf([

            IAAAdditiveGaussianNoise(),

            GaussNoise(),

        ], p=0.2),

        OneOf([

            MotionBlur(p=.2),

            MedianBlur(blur_limit=3, p=.1),

            Blur(blur_limit=3, p=.1),

        ], p=0.2),

        ShiftScaleRotate(shift_limit=0.0625, scale_limit=0.2, rotate_limit=45, p=.2),

        OneOf([

            OpticalDistortion(p=0.3),

            GridDistortion(p=.1),

            IAAPiecewiseAffine(p=0.3),

        ], p=0.2),

        OneOf([

            CLAHE(clip_limit=2),

            IAASharpen(),

            IAAEmboss(),

            RandomContrast(),

            RandomBrightness(),

        ], p=0.3),

        HueSaturationValue(p=0.3),

    ], p=p)

aug  ==  strong_aug(p=1)

img_strong_aug = aug(image=image)['image']

# show

plt.subplot(2, 3, 1)

plt.imshow(image)

plt.subplot(2, 3, 2)

plt.imshow(img_HorizontalFlip)

plt.subplot(2, 3, 3)

plt.imshow(img_IAAPerspective)

plt.subplot(2, 3, 4)

plt.imshow(img_ShiftScaleRotate)

plt.subplot(2, 3, 5)

plt.imshow(img_augment_flips_color)

plt.subplot(2, 3, 6)

plt.imshow(img_strong_aug)

plt.show()
from albumentations import (

    RandomRotate90, Transpose, ShiftScaleRotate, Blur,

    OpticalDistortion, CLAHE, GaussNoise, MotionBlur,

    GridDistortion, HueSaturationValue, IAAAdditiveGaussianNoise,

    MedianBlur, IAAPiecewiseAffine, IAASharpen, IAAEmboss,

    RandomContrast, RandomBrightness, Flip, OneOf, Compose

)

import numpy as np

def strong_aug(p=0.5):

    return Compose([

        RandomRotate90(),

        Flip(),

        Transpose(),

        OneOf([

            IAAAdditiveGaussianNoise(),

            GaussNoise(),

        ], p=0.2),

        OneOf([

            MotionBlur(p=0.2),

            MedianBlur(blur_limit=3, p=0.1),

            Blur(blur_limit=3, p=0.1),

        ], p=0.2),

        ShiftScaleRotate(shift_limit=0.0625, scale_limit=0.2, rotate_limit=45, p=0.2),

        OneOf([

            OpticalDistortion(p=0.3),

            GridDistortion(p=0.1),

            IAAPiecewiseAffine(p=0.3),

        ], p=0.2),

        OneOf([

            CLAHE(clip_limit=2),

            IAASharpen(),

            IAAEmboss(),

            RandomContrast(),

            RandomBrightness(),

        ], p=0.3),

        HueSaturationValue(p=0.3),

    ], p=p)

image = np.ones((300, 300, 3), dtype=np.uint8)

mask = np.ones((300, 300), dtype=np.uint8)

whatever_data = "my name"

augmentation = strong_aug(p=0.9)

data = {"image": image, "mask": mask, "whatever_data": whatever_data, "additional": "hello"}

augmented = augmentation(**data)  ## 数据增强

image, mask, whatever_data, additional = augmented["image"], augmented["mask"], augmented["whatever_data"], augmented["additional"]
4. 更新的使用示例
https://github.com/albu/albumentations 更新了几个关于 albumentations 的使用 Demo.
4.1 综合示例 - showcase
# 导入相关库,并定义用于可视化的函数

#!--*-- coding: utf-8 --*--

import os

import numpy as np

import cv2

from matplotlib import pyplot as plt

from skimage.color import label2rgb

import albumentations as A

import random

BOX_COLOR = (255, 0, 0)

TEXT_COLOR = (255, 255, 255)

def visualize_bbox(img, bbox, color=BOX_COLOR, thickness=2, **kwargs):

    #height, width = img.shape[:2]

    x_min, y_min, w, h = bbox

    x_min, x_max, y_min, y_max = int(x_min), int(x_min + w), int(y_min), int(y_min + h)

    cv2.rectangle(img, (x_min, y_min), (x_max, y_max), color=color, thickness=thickness)

    return img

def visualize_titles(img, bbox, title, color=BOX_COLOR, thickness=2, font_thickness = 2, font_scale=0.35, **kwargs):

    #height, width = img.shape[:2]

    x_min, y_min, w, h = bbox

    x_min, x_max, y_min, y_max = int(x_min), int(x_min + w), int(y_min), int(y_min + h)

    ((text_width, text_height), _) = cv2.getTextSize(title, cv2.FONT_HERSHEY_SIMPLEX, font_scale, font_thickness)

    cv2.rectangle(img, (x_min, y_min - int(1.3 * text_height)), (x_min + text_width, y_min), BOX_COLOR, -1)

    cv2.putText(img, title, (x_min, y_min - int(0.3 * text_height)), cv2.FONT_HERSHEY_SIMPLEX, font_scale, TEXT_COLOR,

                font_thickness, lineType=cv2.LINE_AA)

    return img

def augment_and_show(aug, image, mask=None, bboxes=[],

                     categories=[], category_id_to_name=[], filename=None,

                     font_scale_orig=0.35, font_scale_aug=0.35,

                     show_title=True, **kwargs):

    augmented = aug(image=image, mask=mask, bboxes=bboxes, category_id=categories)

    image = cv2.cvtColor(image, cv2.COLOR_BGR2RGB)

    image_aug = cv2.cvtColor(augmented['image'], cv2.COLOR_BGR2RGB)

    for bbox in bboxes:

        visualize_bbox(image, bbox, **kwargs)

    for bbox in augmented['bboxes']:

        visualize_bbox(image_aug, bbox, **kwargs)

    if show_title:

        for bbox,cat_id in zip(bboxes, categories):

            visualize_titles(image, bbox, category_id_to_name[cat_id], font_scale=font_scale_orig, **kwargs)

        for bbox,cat_id in zip(augmented['bboxes'], augmented['category_id']):

            visualize_titles(image_aug, bbox, category_id_to_name[cat_id], font_scale=font_scale_aug, **kwargs)

    if mask is None:

        f, ax = plt.subplots(1, 2, figsize=(16, 8))

        ax[0].imshow(image)

        ax[0].set_title('Original image')

        ax[1].imshow(image_aug)

        ax[1].set_title('Augmented image')

    else:

        f, ax = plt.subplots(2, 2, figsize=(16, 16))

        if len(mask.shape) != 3:

            mask = label2rgb(mask, bg_label=0)

            mask_aug = label2rgb(augmented['mask'], bg_label=0)

        else:

            mask = cv2.cvtColor(mask, cv2.COLOR_BGR2RGB)

            mask_aug = cv2.cvtColor(augmented['mask'], cv2.COLOR_BGR2RGB)

        ax[0, 0].imshow(image)

        ax[0, 0].set_title('Original image')

        ax[0, 1].imshow(image_aug)

        ax[0, 1].set_title('Augmented image')

        ax[1, 0].imshow(mask, interpolation='nearest')

        ax[1, 0].set_title('Original mask')

        ax[1, 1].imshow(mask_aug, interpolation='nearest')

        ax[1, 1].set_title('Augmented mask')

    f.tight_layout()

    plt.show()

    if filename is not None:

        f.savefig(filename)

    return augmented['image'], augmented['mask'], augmented['bboxes']

def find_in_dir(dirname):

    return [os.path.join(dirname, fname) for fname in sorted(os.listdir(dirname))]
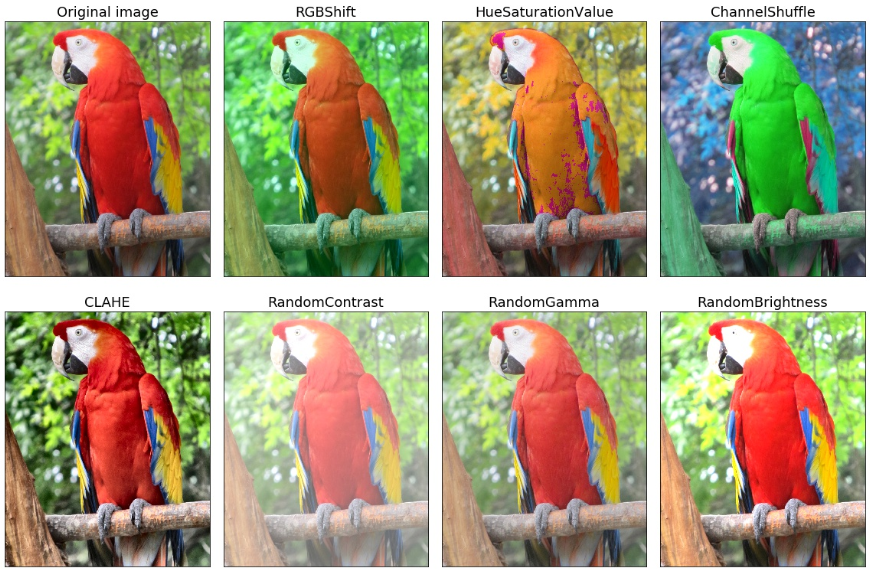
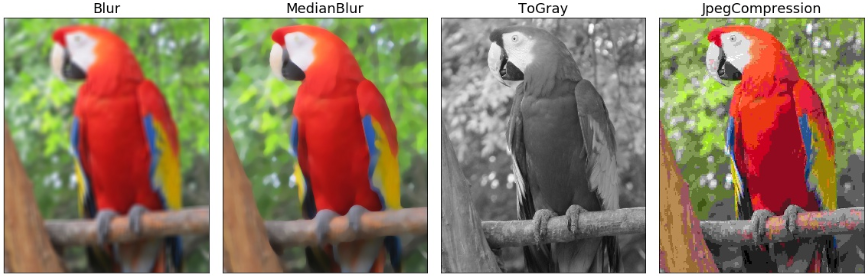
颜色增强 - Color Augmentations
# 颜色增强处理函数

random.seed(42)

image = cv2.imread('images/parrot.jpg')

light = A.Compose([

    A.RandomBrightness(p=1),

    A.RandomContrast(p=1),

    A.RandomGamma(p=1),

#     A.RGBShift(),

    A.CLAHE(p=1),

#     A.ToGray(),

#     A.HueSaturationValue(),

], p=1)

medium = A.Compose([

    A.CLAHE(p=1),

    A.HueSaturationValue(hue_shift_limit=20, sat_shift_limit=50, val_shift_limit=50, p=1),

], p=1)

strong = A.Compose([

    A.ChannelShuffle(p=1),

], p=1)
颜色增强 - light:
res = augment_and_show(light, image)
颜色增强 - medium:
res = augment_and_show(medium, image)
颜色增强 - strong:
res = augment_and_show(strong, image)
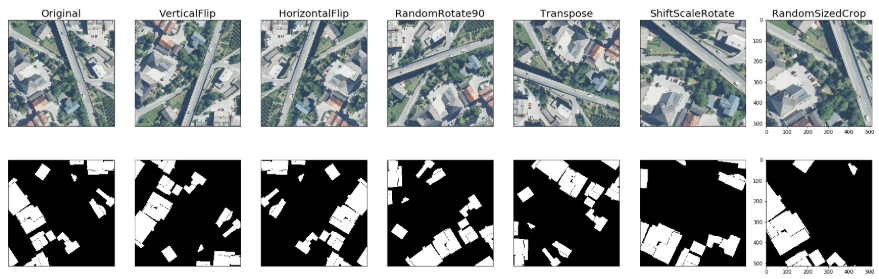
航空遥感图像 - Inria Aerial Image Labeling Dataset:
random.seed(42)

image = cv2.imread('images/inria/inria_tyrol_w4_image.jpg')

mask = cv2.imread('images/inria/inria_tyrol_w4_mask.tif', cv2.IMREAD_GRAYSCALE)

image, mask = image[:1024, :1024], mask[:1024,:1024]

light = A.Compose([

    A.RandomSizedCrop((512-100, 512+100), 512, 512),

    A.ShiftScaleRotate(),

    A.RGBShift(),

    A.Blur(),

    A.GaussNoise(),

    A.ElasticTransform(),

    A.Cutout(p=1)

],p=1)

res = augment_and_show(light, image, mask)
细胞核分割 - 2018 Data Science Bowl
random.seed(42)

image = cv2.imread('images/dsb2018/1a11552569160f0b1ea10bedbd628ce6c14f29edec5092034c2309c556df833e/images/1a11552569160f0b1ea10bedbd628ce6c14f29edec5092034c2309c556df833e.png')

masks = [cv2.imread(x, cv2.IMREAD_GRAYSCALE) for x in find_in_dir('images/dsb2018/1a11552569160f0b1ea10bedbd628ce6c14f29edec5092034c2309c556df833e/masks')]

bboxes = [cv2.boundingRect(cv2.findNonZero(mask)) for mask in masks]

label_image = np.zeros_like(masks[0])

for i, mask in enumerate(masks):

    label_image += (mask > 0).astype(np.uint8) * i

light = A.Compose([

    A.RGBShift(),

    A.InvertImg(),

    A.Blur(),

    A.GaussNoise(),

    A.Flip(),

    A.RandomRotate90(),

    A.RandomSizedCrop((512 - 100, 512 + 100), 512, 512),

], bbox_params={'format':'coco', 'min_area': 1, 'min_visibility': 0.5, 'label_fields': ['category_id']}, p=1)

label_ids = [0] * len(bboxes)

label_names = ['Nuclei']

res = augment_and_show(light, image, label_image, bboxes, label_ids, label_names, show_title=False)
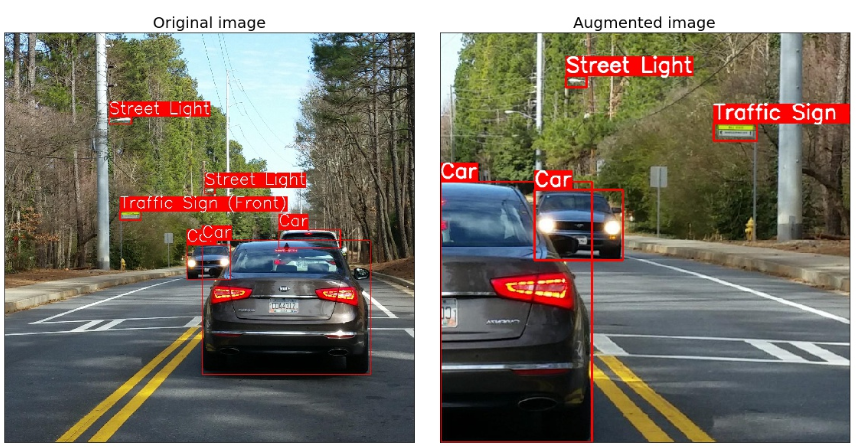
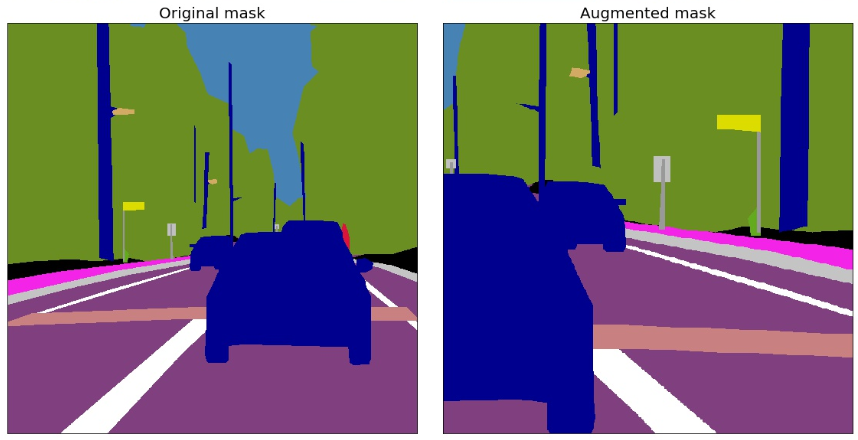
街景数据 - Mapilary Vistas
from PIL import Image

image = cv2.imread('images/vistas/_HnWguqEbRCphUquTMrCCA.jpg')

labels = cv2.imread('images/vistas/_HnWguqEbRCphUquTMrCCA_labels.png', cv2.IMREAD_COLOR)

instances = np.array(Image.open('images/vistas/_HnWguqEbRCphUquTMrCCA_instances.png'),dtype=np.uint16)

IGNORED = 65 * 256

instances[(instances//256 != 55) & (instances//256 != 44) & (instances//256 != 50)] = IGNORED

image = image[1000:2500, 1000:2500]

labels = labels[1000:2500, 1000:2500]

instances = instances[1000:2500, 1000:2500]

bboxes = [cv2.boundingRect(cv2.findNonZero((instances == instance_id).astype(np.uint8))) for instance_id in np.unique(instances) if instance_id != IGNORED]

instance_labels = [instance_id // 256 for instance_id in np.unique(instances) if instance_id != IGNORED]

# coco_bboxes = [list(bbox) + [label] for bbox, label in zip(bboxes, instance_labels)]

# coco_bboxes = A.convert_bboxes_to_albumentations(image.shape, coco_bboxes, source_format='coco')

titles = ["Bird",

"Ground Animal",

"Curb",

"Fence",

"Guard Rail",

"Barrier",

"Wall",

"Bike Lane",

"Crosswalk - Plain",

"Curb Cut",

"Parking",

"Pedestrian Area",

"Rail Track",

"Road",

"Service Lane",

"Sidewalk",

"Bridge",

"Building",

"Tunnel",

"Person",

"Bicyclist",

"Motorcyclist",

"Other Rider",

"Lane Marking - Crosswalk",

"Lane Marking - General",

"Mountain",

"Sand",

"Sky",

"Snow",

"Terrain",

"Vegetation",

"Water",

"Banner",

"Bench",

"Bike Rack",

"Billboard",

"Catch Basin",

"CCTV Camera",

"Fire Hydrant",

"Junction Box",

"Mailbox",

"Manhole",

"Phone Booth",

"Pothole",

"Street Light",

"Pole",

"Traffic Sign Frame",

"Utility Pole",

"Traffic Light",

"Traffic Sign (Back)",

"Traffic Sign (Front)",

"Trash Can",

"Bicycle",

"Boat",

"Bus",

"Car",

"Caravan",

"Motorcycle",

"On Rails",

"Other Vehicle",

"Trailer",

"Truck",

"Wheeled Slow",

"Car Mount",

"Ego Vehicle",

"Unlabeled"]

light = A.Compose([

    A.HorizontalFlip(p=1),

    A.RandomSizedCrop((800 - 100, 800 + 100), 600, 600),

    A.GaussNoise(var_limit=(100, 150), p=1),

], bbox_params={'format':'coco', 'min_area': 1, 'min_visibility': 0.5, 'label_fields': ['category_id']},  p=1)

medium = A.Compose([

    A.HorizontalFlip(p=1),

    A.RandomSizedCrop((800 - 100, 800 + 100), 600, 600),

    A.MotionBlur(blur_limit=37, p=1),

], bbox_params={'format':'coco', 'min_area': 1, 'min_visibility': 0.5, 'label_fields': ['category_id']}, p=1)

strong = A.Compose([

    A.HorizontalFlip(p=1),

    A.RandomSizedCrop((800 - 100, 800 + 100), 600, 600),

    A.RGBShift(p=1),

    A.Blur(blur_limit=11, p=1),

    A.RandomBrightness(p=1),

    A.CLAHE(p=1),

], bbox_params={'format':'coco', 'min_area': 1, 'min_visibility': 0.5, 'label_fields': ['category_id']}, p=1)
街景数据增强 - light:
random.seed(13)

res = augment_and_show(light, image, labels, bboxes,

                       instance_labels, titles, thickness=2,

                       font_scale_orig=2, font_scale_aug=1)
街景数据增强 - medium:
random.seed(13)

res = augment_and_show(medium, image, labels, bboxes,

                       instance_labels, titles, thickness=2,

                       font_scale_orig=2, font_scale_aug=1)
街景数据增强 - strong:
random.seed(13)

res = augment_and_show(strong, image, labels, bboxes,

                       instance_labels, titles, thickness=2,

                       font_scale_orig=2, font_scale_aug=1)
4.2 分类 Classification 示例
https://github.com/albu/albumentations/blob/master/notebooks/example.ipynb
import numpy as np

import cv2

import matplotlib.pyplot as plt

from albumentations import (

    HorizontalFlip, IAAPerspective, ShiftScaleRotate, CLAHE,

    RandomRotate90, Transpose, ShiftScaleRotate, Blur,

    OpticalDistortion, GridDistortion, HueSaturationValue,

    IAAAdditiveGaussianNoise, GaussNoise, MotionBlur, MedianBlur,

    IAAPiecewiseAffine, IAASharpen, IAAEmboss, RandomContrast,

    RandomBrightness, Flip, OneOf, Compose

)

def augment_and_show(aug, image):

    image = aug(image=image)['image']

    plt.figure(figsize=(10, 10))

    plt.imshow(image)

image = cv2.imread('test.jpg')

image = cv2.cvtColor(image, cv2.COLOR_BGR2RGB)

plt.subplot(2, 2, 1)

plt.imshow(image)

plt.subplot(2, 2, 2)

aug = HorizontalFlip(p=1)

image_aug1 = aug(image=image)['image']

plt.imshow(image_aug1)

plt.subplot(2, 2, 3)

aug = IAAPerspective(scale=0.2, p=1)

image_aug2 = aug(image=image)['image']

plt.imshow(image_aug2)

plt.subplot(2, 2, 4)

aug = ShiftScaleRotate(p=1)

image_aug3 = aug(image=image)['image']

plt.imshow(image_aug3)

plt.show()
def augment_flips_color(p=.5):

    return Compose([

        CLAHE(),

        RandomRotate90(),

        Transpose(),

        ShiftScaleRotate(shift_limit=0.0625,

                         scale_limit=0.50,

                         rotate_limit=45, p=.75),

        Blur(blur_limit=3),

        OpticalDistortion(),

        GridDistortion(),

        HueSaturationValue()

    ], p=p)

aug = augment_flips_color(p=1)

image_aug = aug(image=image)['image']

plt.subplot(1, 2, 1)

plt.imshow(image)

plt.subplot(1, 2, 2)

plt.imshow(image_aug)

plt.show()
def strong_aug(p=.5):

    return Compose([

        RandomRotate90(),

        Flip(),

        Transpose(),

        OneOf([

            IAAAdditiveGaussianNoise(),

            GaussNoise(),

        ], p=0.2),

        OneOf([

            MotionBlur(p=.2),

            MedianBlur(blur_limit=3, p=.1),

            Blur(blur_limit=3, p=.1),

        ], p=0.2),

        ShiftScaleRotate(shift_limit=0.0625, scale_limit=0.2, rotate_limit=45, p=.2),

        OneOf([

            OpticalDistortion(p=0.3),

            GridDistortion(p=.1),

            IAAPiecewiseAffine(p=0.3),

        ], p=0.2),

        OneOf([

            CLAHE(clip_limit=2),

            IAASharpen(),

            IAAEmboss(),

            RandomContrast(),

            RandomBrightness(),

        ], p=0.3),

        HueSaturationValue(p=0.3),

    ], p=p)

aug = strong_aug(p=1)

image_aug = aug(image=image)['image']

plt.subplot(1, 2, 1)

plt.imshow(image)

plt.subplot(1, 2, 2)

plt.imshow(image_aug)

plt.show()
4.3 检测 Object Detection 示例
https://github.com/albu/albumentations/blob/master/notebooks/example_bboxes.ipynb
# 导入相关库,定义可视化函数

import os

import numpy as np

import cv2

from matplotlib import pyplot as plt

from urllib.request import urlopen

from albumentations import (

    HorizontalFlip,

    VerticalFlip,

    Resize,

    CenterCrop,

    RandomCrop,

    Crop,

    Compose

)

# 用于图片上的边界框和类别 labels 的可视化函数

BOX_COLOR = (255, 0, 0)

TEXT_COLOR = (255, 255, 255)

def visualize_bbox(img, bbox, class_id, class_idx_to_name, color=BOX_COLOR, thickness=2):

    x_min, y_min, w, h = bbox

    x_min, x_max, y_min, y_max = int(x_min), int(x_min + w), int(y_min), int(y_min + h)

    cv2.rectangle(img, (x_min, y_min), (x_max, y_max), color=color, thickness=thickness)

    class_name = class_idx_to_name[class_id]

    ((text_width, text_height), _) = cv2.getTextSize(class_name, cv2.FONT_HERSHEY_SIMPLEX, 0.35, 1)

    cv2.rectangle(img, (x_min, y_min - int(1.3 * text_height)), (x_min + text_width, y_min), BOX_COLOR, -1)

    cv2.putText(img, class_name, (x_min, y_min - int(0.3 * text_height)), cv2.FONT_HERSHEY_SIMPLEX, 0.35,TEXT_COLOR, lineType=cv2.LINE_AA)

    return img

def visualize(annotations, category_id_to_name):

    img = annotations['image'].copy()

    for idx, bbox in enumerate(annotations['bboxes']):

        img = visualize_bbox(img, bbox, annotations['category_id'][idx], category_id_to_name)

    plt.figure(figsize=(12, 12))

    plt.imshow(img)

    plt.imshow()
对于检测问题,必须以指定格式定义 bbox_params. 支持的格式有两种: coco 和 pascal_voc.
coco 的 bounding box 格式为:[x_min, y_min, width, height], e.g. [97, 12, 150, 200].
pascal_voc 的 bounding box 格式为: [x_min, y_min, x_max, y_max], e.g. [97, 12, 247, 212].
def get_aug(aug, min_area=0., min_visibility=0.):

    return Compose(aug, bbox_params={'format': 'coco', 'min_area': min_area, 'min_visibility': min_visibility, 'label_fields': ['category_id']})

def download_image(url):

    data = urlopen(url).read()

    data = np.frombuffer(data, np.uint8)

    image = cv2.imdecode(data, cv2.IMREAD_COLOR)

    image = cv2.cvtColor(image, cv2.COLOR_BGR2RGB)

    return image

image = download_image('http://images.cocodataset.org/train2017/000000386298.jpg')

# Annotations for image 386298 from COCO http://cocodataset.org/#explore?id=386298

annotations = {'image': image, 'bboxes': [[366.7, 80.84, 132.8, 181.84], [5.66, 138.95, 147.09, 164.88]], 'category_id': [18, 17]}

category_id_to_name = {17: 'cat', 18: 'dog'}
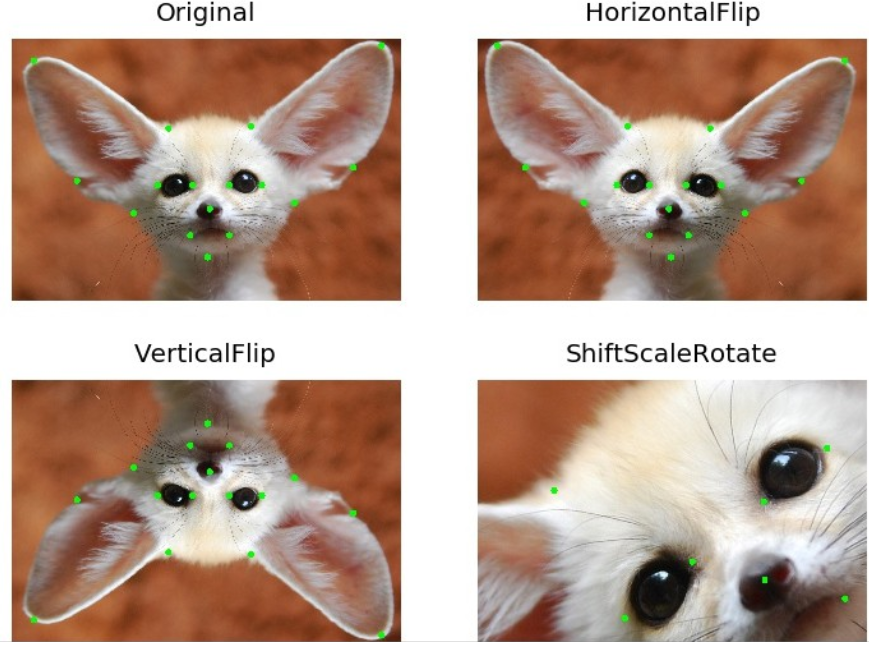
可视化原图标注:
visualize(annotations, category_id_to_name)
垂直翻转增强:
aug = get_aug([VerticalFlip(p=1)])

augmented = aug(**annotations)

visualize(augmented, category_id_to_name)
水平翻转增强:
aug = get_aug([HorizontalFlip(p=1)])

augmented = aug(**annotations)

visualize(augmented, category_id_to_name)
Resize 数据增强:
aug = get_aug([Resize(p=1, height=256, width=256)])

augmented = aug(**annotations)

visualize(augmented, category_id_to_name)
Albumentation 库还支持 boxes 裁剪与删除. 主要包括两个参数:min_aera 和 min_visibility.
默认 min_aera 和 min_visibility 值均为 0,故,只有超出图片尺寸之外的 boxes 才会被删除.
CenterCrop:
aug = get_aug([CenterCrop(p=1, height=300, width=300)])

augmented = aug(**annotations)

visualize(augmented, category_id_to_name)
CenterCrop with default filter:
aug = get_aug([CenterCrop(p=1, height=224, width=224)])

augmented = aug(**annotations)

print(augmented['category_id'])

visualize(augmented, category_id_to_name)
CenterCrop + filter with min_area:
aug = get_aug([CenterCrop(p=1, height=224, width=224)], min_area=4000)

augmented = aug(**annotations)

visualize(augmented, category_id_to_name)
CenterCrop + filter by visibility:
# 只返回变换后可见性大于 threshold 的 boxes

aug = get_aug([CenterCrop(p=1, height=300, width=300)], min_visibility=0.3)

augmented = aug(**annotations)

visualize(augmented, category_id_to_name)

# 如图,变换后,dog 的 box 面积大约是原始 box 的 25%,小于 0.3,故舍弃.

# 变换后,cat 的 box 面积大约是原始 box 的 36%,大于 0.3,故保留.
4.3 分割 Segmentation 示例
example_kaggle_salt.ipynb: https://github.com/albu/albumentations/blob/master/notebooks/example_kaggle_salt.ipynb
图片和数据来自: TGS Salt Identification Challenge: https://www.kaggle.com/c/tgs-salt-identification-challenge
# 导入相关库,定义可视化函数

import numpy as np

import cv2

from matplotlib import pyplot as plt

from albumentations import (

    PadIfNeeded,

    HorizontalFlip,

    VerticalFlip,

    CenterCrop,

    Crop,

    Compose,

    Transpose,

    RandomRotate90,

    ElasticTransform,

    GridDistortion,

    OpticalDistortion,

    RandomSizedCrop,

    OneOf,

    CLAHE,

    RandomContrast,

    RandomGamma,

    RandomBrightness

)

def visualize(image, mask, original_image=None, original_mask=None):

    fontsize = 18

    if original_image is None and original_mask is None:

        f, ax = plt.subplots(2, 1, figsize=(8, 8))

        ax[0].imshow(image)

        ax[1].imshow(mask)

    else:

        f, ax = plt.subplots(2, 2, figsize=(8, 8))

        ax[0, 0].imshow(original_image)

        ax[0, 0].set_title('Original image', fontsize=fontsize)

        ax[1, 0].imshow(original_mask)

        ax[1, 0].set_title('Original mask', fontsize=fontsize)

        ax[0, 1].imshow(image)

        ax[0, 1].set_title('Transformed image', fontsize=fontsize)

        ax[1, 1].imshow(mask)

        ax[1, 1].set_title('Transformed mask', fontsize=fontsize)

    plt.show()

# 原图

image = cv2.imread('images/kaggle_salt/0fea4b5049_image.png')

mask = cv2.imread('images/kaggle_salt/0fea4b5049.png', 0)

print(image.shape, mask.shape)

original_height, original_width = image.shape[:2]

visualize(image, mask)
Padding:
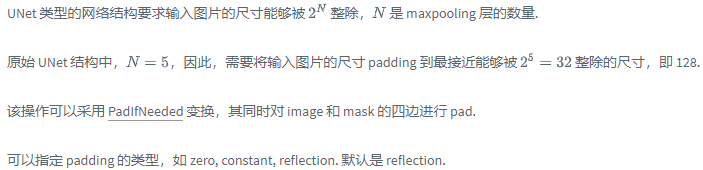
aug = PadIfNeeded(p=1, min_height=128, min_width=128)

augmented = aug(image=image, mask=mask)

image_padded = augmented['image']

mask_padded = augmented['mask']

print(image_padded.shape, mask_padded.shape)

visualize(image_padded, mask_padded, original_image=image, original_mask=mask)
(128, 128, 3) (128, 128)
CenterCrop 和 Crop:
aug = CenterCrop(p=1, height=original_height, width=original_width)

augmented = aug(image=image_padded, mask=mask_padded)

image_center_cropped = augmented['image']

mask_center_cropped = augmented['mask']

print(image_center_cropped.shape, mask_center_cropped.shape)

assert (image - image_center_cropped).sum() == 0

assert (mask - mask_center_cropped).sum() == 0

visualize(image_padded, mask_padded,

          original_image=image_center_cropped,

          original_mask=mask_center_cropped)
(101, 101, 3) (101, 101)
x_min = (128 - original_width) // 2

y_min = (128 - original_height) // 2

x_max = x_min + original_width

y_max = y_min + original_height

aug = Crop(p=1, x_min=x_min, x_max=x_max, y_min=y_min, y_max=y_max)

augmented = aug(image=image_padded, mask=mask_padded)

image_cropped = augmented['image']

mask_cropped = augmented['mask']

print(image_cropped.shape, mask_cropped.shape)

assert (image - image_cropped).sum() == 0

assert (mask - mask_cropped).sum() == 0

visualize(image_cropped, mask_cropped, original_image=image_padded, original_mask=mask_padded)
无损变换(Non destructive transformations)
对于卫星和遥感图像,医疗图像而言,最好是能够不增加或者损失图片信息,进行图像增强变换.
有 8 种不同的方式来表示平面上的同一个方框.
可以采用 HorizontalFlip, VerticalFlip, Transpose, RandomRotate90 实现这八种数据增强.
水平翻转:
aug = HorizontalFlip(p=1)

augmented = aug(image=image, mask=mask)

image_h_flipped = augmented['image']

mask_h_flipped = augmented['mask']

visualize(image_h_flipped, mask_h_flipped,

          original_image=image, original_mask=mask)
垂直翻转:
aug = VerticalFlip(p=1)

augmented = aug(image=image, mask=mask)

image_v_flipped = augmented['image']

mask_v_flipped = augmented['mask']

visualize(image_v_flipped, mask_v_flipped,

          original_image=image, original_mask=mask)
随机旋转 90 度:
# 随机旋转 0,90,180,270.

aug = RandomRotate90(p=1)

augmented = aug(image=image, mask=mask)

image_rot90 = augmented['image']

mask_rot90 = augmented['mask']

visualize(image_rot90, mask_rot90,

          original_image=image, original_mask=mask)
转置 Transpose:
# 交换 X 轴和 Y 轴

aug = Transpose(p=1)

augmented = aug(image=image, mask=mask)

image_transposed = augmented['image']

mask_transposed = augmented['mask']

visualize(image_transposed, mask_transposed,

          original_image=image, original_mask=mask)
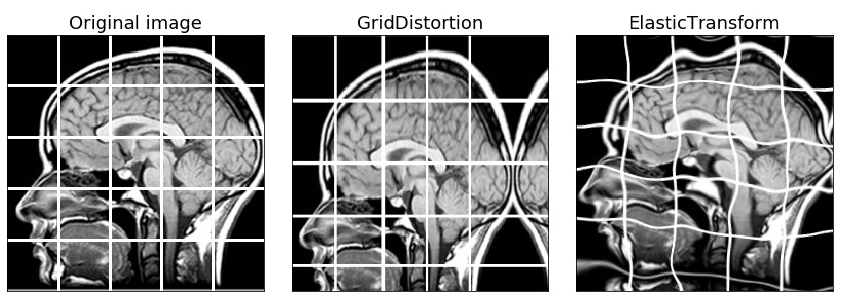
非刚性变换:弹性变换、网格变形、光学畸变(Non-rigid transformations: ElasticTransform, GridDistortion, OpticalDistortion)
在医学图像问题中,非刚性变换有助于数据增强.
弹性变换(ElasticTransform):
aug = ElasticTransform(p=1,

                       alpha=120,

                       sigma=120 * 0.05,

                       alpha_affine=120 * 0.03)

augmented = aug(image=image, mask=mask)

image_elastic = augmented['image']

mask_elastic = augmented['mask']

visualize(image_elastic, mask_elastic,

          original_image=image, original_mask=mask)
网格变形GridDistortion:
aug = GridDistortion(p=1)

augmented = aug(image=image, mask=mask)

image_grid = augmented['image']

mask_grid = augmented['mask']

visualize(image_grid, mask_grid,

          original_image=image, original_mask=mask)
光学畸变OpticalDistortion:
aug = OpticalDistortion(p=1, distort_limit=2, shift_limit=0.5)

augmented = aug(image=image, mask=mask)

image_optical = augmented['image']

mask_optical = augmented['mask']

visualize(image_optical, mask_optical,

          original_image=image, original_mask=mask)
RandomSizedCrop:
RandomCrop (https://albumentations.readthedocs.io/en/latest/api/augmentations.html#albumentations.augmentations.transforms.RandomCrop)和 RandomScale (https://albumentations.readthedocs.io/en/latest/api/augmentations.html#albumentations.augmentations.transforms.RandomScale)组合.
aug = RandomSizedCrop(p=1,

                      min_max_height=(50, 101),

                      height=original_height,

                      width=original_width)

augmented = aug(image=image, mask=mask)

image_scaled = augmented['image']

mask_scaled = augmented['mask']

visualize(image_scaled, mask_scaled,

          original_image=image, original_mask=mask)
数据增强 - Light,non destructive augmentations:
aug = Compose([VerticalFlip(p=0.5),

              RandomRotate90(p=0.5)])

augmented = aug(image=image, mask=mask)

image_light = augmented['image']

mask_light = augmented['mask']

visualize(image_light, mask_light,

          original_image=image, original_mask=mask)
数据增强 - Medium:
aug = Compose([

    OneOf([RandomSizedCrop(min_max_height=(50, 101),

                           height=original_height,

                           width=original_width, p=0.5),

          PadIfNeeded(min_height=original_height,

                      min_width=original_width, p=0.5)], p=1),

    VerticalFlip(p=0.5),

    RandomRotate90(p=0.5),

    OneOf([ElasticTransform(p=0.5,

                            alpha=120,

                            sigma=120 * 0.05,

                            alpha_affine=120 * 0.03),

        GridDistortion(p=0.5),

        OpticalDistortion(p=1,

                          distort_limit=1,

                          shift_limit=0.5)

        ], p=0.8)])

augmented = aug(image=image, mask=mask)

image_medium = augmented['image']

mask_medium = augmented['mask']

visualize(image_medium, mask_medium,

          original_image=image, original_mask=mask)
数据增强 - Strong:
添加 CLAHE, RandomBrightness, RandomContrast, RandomGamma 等只对图片进行非空间变换处理,而不对 mask 处理.
aug = Compose([

    OneOf([RandomSizedCrop(min_max_height=(50, 101),

                           height=original_height,

                           width=original_width, p=0.5),

          PadIfNeeded(min_height=original_height,

                      min_width=original_width, p=0.5)], p=1),

    VerticalFlip(p=0.5),

    RandomRotate90(p=0.5),

    OneOf([ElasticTransform(p=0.5,

                            alpha=120,

                            sigma=120 * 0.05,

                            alpha_affine=120 * 0.03),

        GridDistortion(p=0.5),

        OpticalDistortion(p=1, distort_limit=2, shift_limit=0.5)

        ], p=0.8),

    CLAHE(p=0.8),

    RandomContrast(p=0.8),

    RandomBrightness(p=0.8),

    RandomGamma(p=0.8)])

augmented = aug(image=image, mask=mask)

image_heavy = augmented['image']

mask_heavy = augmented['mask']

visualize(image_heavy, mask_heavy, original_image=image, original_mask=mask)
4.4 Non-8-bit images 示例
https://github.com/albu/albumentations/blob/master/notebooks/example_16_bit_tiff.ipynb
from io import BytesIO

from zipfile import ZipFile

from urllib.request import urlopen

import cv2

import numpy as np

from matplotlib import pyplot as plt

from albumentations import (

    Compose, ToFloat, FromFloat, RandomRotate90,

    Flip, OneOf, MotionBlur, MedianBlur, Blur,

    ShiftScaleRotate, OpticalDistortion, GridDistortion,

    RandomContrast, RandomBrightness, HueSaturationValue,

)

# 下载 16-bit TIFF 图片

url = urlopen("http://www.brucelindbloom.com/downloads/DeltaE_16bit_gamma1.0.tif.zip")

zipfile = ZipFile(BytesIO(url.read()))

zip_names = zipfile.namelist()

file_name = zip_names.pop()

extracted_file = zipfile.open(file_name)

data = np.frombuffer(extracted_file.read(), np.uint16)

img = cv2.imdecode(data, cv2.IMREAD_UNCHANGED)

img = cv2.cvtColor(img, cv2.COLOR_BGR2RGB)

# OpenCV may read incorrectly some TIFF files.

# Consider using `tifffile` - https://github.com/blink1073/tifffile

print(img.dtype)

# dtype('uint16')

# Divide all values by 65535 so we can display the image using matplotlib

plt.imshow(img / 65535)

plt.show()
def strong_tiff_aug(p=.5):

    return Compose([

        # albumentations 支持 uint8 和 float32 输入.

        # 对于 float32, 所有的值必须在 [0.0, 1.0] 之间.

        # 在数据增强变换前,首先进行 `ToFloat()` 处理, 将图像转化为 float32 ndarray.

        ToFloat(),

        # 或者指定输入的最大值

        # ToFloat(max_value=65535.0),

        # 然后进行数据增强

        RandomRotate90(),

        Flip(),

        OneOf([

            MotionBlur(p=0.2),

            MedianBlur(blur_limit=3, p=0.1),

            Blur(blur_limit=3, p=0.1),

        ], p=0.2),

        ShiftScaleRotate(shift_limit=0.0625,

                         scale_limit=0.2,

                         rotate_limit=45, p=.2),

        OneOf([

            OpticalDistortion(p=0.3),

            GridDistortion(p=0.1),

        ], p=0.2),

        OneOf([

            RandomContrast(),

            RandomBrightness(),

        ], p=0.3),

        HueSaturationValue(hue_shift_limit=20,

                           sat_shift_limit=0.1,

                           val_shift_limit=0.1, p=0.3),

        # 可以采用 `FromFloat` 将增强后的图像,转换为原始的数据类型.

        # FromFloat(dtype='uint16'),

        # 可以指定`max_value`,则所有的值都会乘以该值.

        # FromFloat(dtype='uint16', max_value=65535.0),

    ], p=p)

augmentation = strong_tiff_aug(p=0.9)

augmented = augmentation(image=img)

plt.figure(figsize=(14, 14))

plt.imshow(augmented['image'])

plt.show()
Python库 - Albumentations 图片数据增强库的更多相关文章
- ubuntu为python处理图片安装图片数据增强库imgaug
1 依赖Required dependencies: six numpy scipy scikit-image (pip install -U scikit-image) OpenCV (i.e. c ...
- 【Tool】Augmentor和imgaug——python图像数据增强库
Augmentor和imgaug--python图像数据增强库 Tags: ComputerVision Python 介绍两个图像增强库:Augmentor和imgaug,Augmentor使用比较 ...
- python将xml文件数据增强(labelimg)
在处理faster-rcnn和yolo时笔者使用labelimg标注图片 但是我们只截取了大概800张左右的图,这个量级在训练时肯定是不够的,所以我们需要使用数据增强(无非是旋转加噪调量度)来增加我们 ...
- python使用开源图片识别第三方库tesseract
详细安装博客:https://blog.csdn.net/luanyongli/article/details/81385284 第一步tesseract-ocr的安装如果不会请参照:https:// ...
- keras图片数据增强ImageDataGenerator
datagen = ImageDataGenerator( rotation_range=40, width_shift_range=0.2, height_shift_range=0.2, shea ...
- python中用Pillow库进行图片处理
一.Python中 PIL 图像处理库简介 PIL可以做很多和图像处理相关的事情: 图像归档(Image Archives).PIL非常适合于图像归档以及图像的批处理任务.你可以使用PIL创建缩略图, ...
- python的数据可视化库 matplotlib 和 pyecharts
Matplotlib大家都很熟悉 不谈. ---------------------------------------------------------------------------- ...
- 20个最有用的Python数据科学库
核心库与统计 1. NumPy(提交:17911,贡献者:641) 一般我们会将科学领域的库作为清单打头,NumPy 是该领域的主要软件库之一.它旨在处理大型的多维数组和矩阵,并提供了很多高级的数学函 ...
- python中令人惊艳的小众数据科学库
Python是门很神奇的语言,历经时间和实践检验,受到开发者和数据科学家一致好评,目前已经是全世界发展最好的编程语言之一.简单易用,完整而庞大的第三方库生态圈,使得Python成为编程小白和高级工程师 ...
随机推荐
- microsoft.jet.oledb.4.0 未注册
64位系统已经不支持4.0 解决办法 1.下载 ACE2010的驱动,64位的. http://www.microsoft.com/downloads/zh-cn/details.aspx?famil ...
- Unity Input,生命周期,Light,获取组件
1. 递归方法遍历获取指定子物体 知识点:递归的使用:transform.childCount.GetChild(index) 2. Input输入控制类,检测玩家输入 知识点: Input ...
- qnx gpio
in order to set gpio in qnx, you can use msmgpiotool # msmgpiotool gpiotool usage: gpiotool <comm ...
- windows2012 IIS部署GeoTrust证书踩过的坑。 视频测试可用 IIS 证书导入
证书导入方式 https://wenku.baidu.com/view/3504f29a55270722192ef78a.html https://www.cnblogs.com/jackrebel/ ...
- 访问arcserver中的featureServer服务
1.在arcmap中加载图层,并发布成arcser服务(服务名dizhi),记住勾选FeatureServer服务 2.在arcserver manger中查看刚才发布的服务 3.访问featureS ...
- 2019年1月16日22:50:28 白糖SR1905
很好的机会,只拿了点皮毛,如果说都是因为上班时间不充裕那是给自己找借口,最主要原因没别的:思维不清,策略不明- 这里的入场初衷是周线区间下沿,日线向下脱离中枢失败后回拉一笔,那么这一单的做法就应该很明 ...
- 部分视图 - partial
对于partia来说,可以理解为组件化的运用,即将对应的html/js/css进行封装,然后通过模板引擎直接进行调用 1.partial的注册 //可以直接写在app.js,也可以写在之前所说的hel ...
- Oracle层级询语句connect by 用法详解
如果表中包含层级数据,那么你就可以使用层级查询从句选择行层级顺序. 1.层级查询从句语法 层级查询从句语法: { CONNECT BY [ NOCYCLE ] condition [AND condi ...
- 初识Velocity
哇,好长时间没有写文章啦~ 楼主最近在工作中认识了一个叫做Velocity的java的模板引擎,小白的我去网上看了一下,应用还蛮多的,然而我目前接触到的只是用于基于模板生成这块的知识,想写个文章记下, ...
- Mock Server
下载地址:https://repo1.maven.org/maven2/com/github/dreamhead/moco-runner/ 此处使用standalone的方式,不使用api用法 启动方 ...